2007: Year One of RMB Private Equity Funds
2007/6/20 8:13:50
After more than 20 years of reform and opening up, a large number of excellent enterprises have continually emerged. These enterprises have achieved rapid development in their respective industries, becoming the ideal investment targets for RMB private equity funds. However, before the split share structure reform, there were no good exit channels, so such funds could only remain at the theoretical discussion stage without much practical value.
After the split share structure reform, listed company shares gained a smooth exit channel. Coupled with the increasing marketization of IPOs and the need for more quality listing resources to support the extraordinary development of China's capital market, these factors have created a historic opportunity for RMB private equity funds. Since the lock-up period for RMB non-controlling founding shareholders is 12 months, while that for foreign non-controlling founding shareholders is 36 months, a relatively higher barrier to foreign entry has been objectively created. Combined with the government's concerns about foreign mergers and acquisitions in industries vital to "national economy and people's livelihood," a more relaxed environment has been provided for the development and growth of RMB private equity funds.
Due to serious misperceptions in the earlier positioning of the capital market's role, China's capital market has not had a great reputation. The strict control over listing quotas turned IPOs into marathon public-relations contests, often resulting in enormous expenditure of money and energy with nothing to show for it. This made many excellent enterprises without strong connections skeptical of listing, some even harboring strong resistance. On the other hand, the high-speed growth environment of the Chinese economy has provided enterprises with abundant development opportunities, reducing their sense of urgency. Many enterprises developed through real-economy models, and some private companies still operate under family-style management, creating huge conceptual gaps regarding becoming public companies through listing.
Yet the substantial development of China's real economy has made the robust growth of a multi-tiered capital market an indispensable step. The foundation of a capital market lies in the listed companies traded within it, and the quality of listed companies is the key to whether the capital market's foundation is solid. A market born with original sin cannot possibly develop normally. The most fundamental solution to listed company quality is to establish market-based principles, letting all companies that meet listing requirements go public at appropriate times according to their actual development and based on market principles. Then, through strict supervision and market elimination, companies that no longer meet standards must be resolutely delisted — only this way can listed company quality be ensured. The most important prerequisite here is to let all companies meeting listing requirements go public under market-based principles. It can be asserted that this prerequisite is gradually becoming reality, which is also an indispensable prerequisite for China's capital market to become a global capital market. The establishment of this prerequisite likewise provides the most fundamental guarantee for the healthy development of RMB private equity funds.
On the other hand, Chinese enterprises in the real economy have generally hit development bottlenecks and must combine with the capital market to obtain new growth momentum. Those enterprises without capital market support are increasingly facing the risk of being squeezed out, crushed, or acquired by enterprises with the powerful funding backing of the capital market. For those enterprises still attempting to evade the capital market, they will face increasing survival pressure. Under this pressure, to be or not to be is the paramount question every enterprise must face, and fully utilizing the capital market to develop and strengthen themselves is an unavoidable and inevitable choice for all companies that meet listing requirements. It can be asserted that more and more enterprises will tie their fates to the capital market, providing ample exploitable resources for the development of RMB private equity funds.
For the regulators, the robust development of a batch of publicly credible, properly operated RMB private equity funds will enable pre-IPO resources to receive professional, market-based, industrialized, and internationalized integration, providing the capital market with sufficient quality listed companies. More importantly, the development of such funds allows the capital market's resource allocation function to be more effectively realized. The M&A funds that develop from this will play a critical role in the market's ecological balance, with extremely broad development prospects.
On December 28, 2006, the China Banking Regulatory Commission promulgated the new "Administrative Measures for Collective Fund Trust Plans of Trust Companies," making the "collective fund trust plan" an important tool for asset management and structured financing in China. The "Partnership Enterprise Law" implemented on June 1, 2007, provides complete legal frameworks and legislative guarantees for RMB private equity funds. In other words, after June 2007, the development of RMB private equity funds has become unstoppable. 2007 will be recorded in the history of China's capital market development as Year One of RMB Private Equity Funds.
Finally, the basic listing requirements for the Shenzhen SME Board are appended below:
Pre-issuance total share capital of no less than 30 million RMB; pre-issuance net assets to total assets ratio of no less than 30%; pre-issuance intangible assets to net assets ratio of no more than 20% (excluding land use rights, mining rights, and aquaculture rights); pre-issuance consecutive 3-year profitability, with 3-year cumulative net profit of no less than 30 million RMB, using the lower figure after deducting non-recurring gains and losses; pre-issuance 3-year cumulative cash flow from operating activities of no less than 50 million RMB, or 3-year cumulative revenue of no less than 300 million RMB.
Appendix:
Today's price action was perfectly normal — a standard hub oscillation. If you couldn't identify the divergence around 1:30 PM in real time, you need to step up your studies. Detailed analysis will be in Lesson 61. If you couldn't analyze it in real time, please try analyzing it yourself first, then compare with tomorrow morning's lesson — only this way can you improve.
Since Monday's gap is still there, it remains a latent risk for market development. As previously stated, as long as oscillation touches point 46 around 4192, the hub will expand. Today's price action already touched that point, so what follows will be a large hub oscillation. Short-term, watch point 61 at 4224 — if a 1-minute trend cannot touch that level again, it will form a 5-minute third-type sell point, and the oscillation range will need to expand downward. If it can stabilize above 4224 again, the oscillation remains bullish. Medium-term, the 1/2 line at 4144 points is critically important — if this line can't hold, the market's correction level will intensify; otherwise, there's no major issue. For those who can't read charts: short-term, still watch the 5-day moving average; medium-term, watch the 5-week moving average — no break means no problem.
On individual stocks, several of the 16 hit new highs again. The others will follow suit after oscillation. For stocks in the four technical patterns discussed yesterday, each must be treated according to their technical charts. Particularly for stocks making new highs, you must watch for large-level divergence — if present, be careful, beware of falling into a bull trap. If there's no divergence, or if consolidation divergence ultimately transforms into a third-type buy point, only then may you enter. As for other patterns, just follow the technical charts.
Replies
缠中说禅 2007/6/20 15:36:32
Today's price action was perfectly normal — a standard hub oscillation. If you couldn't identify the divergence around 1:30 PM in real time, you need to step up your studies. Detailed analysis will be in Lesson 61. If you couldn't analyze it in real time, please try analyzing it yourself first, then compare with tomorrow morning's lesson — only this way can you improve.
Since Monday's gap is still there, it remains a latent risk for market development. As previously stated, as long as oscillation touches point 46 around 4192, the hub will expand. Today's price action already touched that point, so what follows will be a large hub oscillation. Short-term, watch point 61 at 4224 — if a 1-minute trend cannot touch that level again, it will form a 5-minute third-type sell point, and the oscillation range will need to expand downward. If it can stabilize above 4224 again, the oscillation remains bullish. Medium-term, the 1/2 line at 4144 points is critically important — if this line can't hold, the market's correction level will intensify; otherwise, there's no major issue. For those who can't read charts: short-term, still watch the 5-day moving average; medium-term, watch the 5-week moving average — no break means no problem.
On individual stocks, several of the 16 hit new highs again. The others will follow suit after oscillation. For stocks in the four technical patterns discussed yesterday, each must be treated according to their technical charts. Particularly for stocks making new highs, you must watch for large-level divergence — if present, be careful, beware of falling into a bull trap. If there's no divergence, or if consolidation divergence ultimately transforms into a third-type buy point, only then may you enter. As for other patterns, just follow the technical charts.
缠中说禅 2007/6/20 15:43:19
All in the green
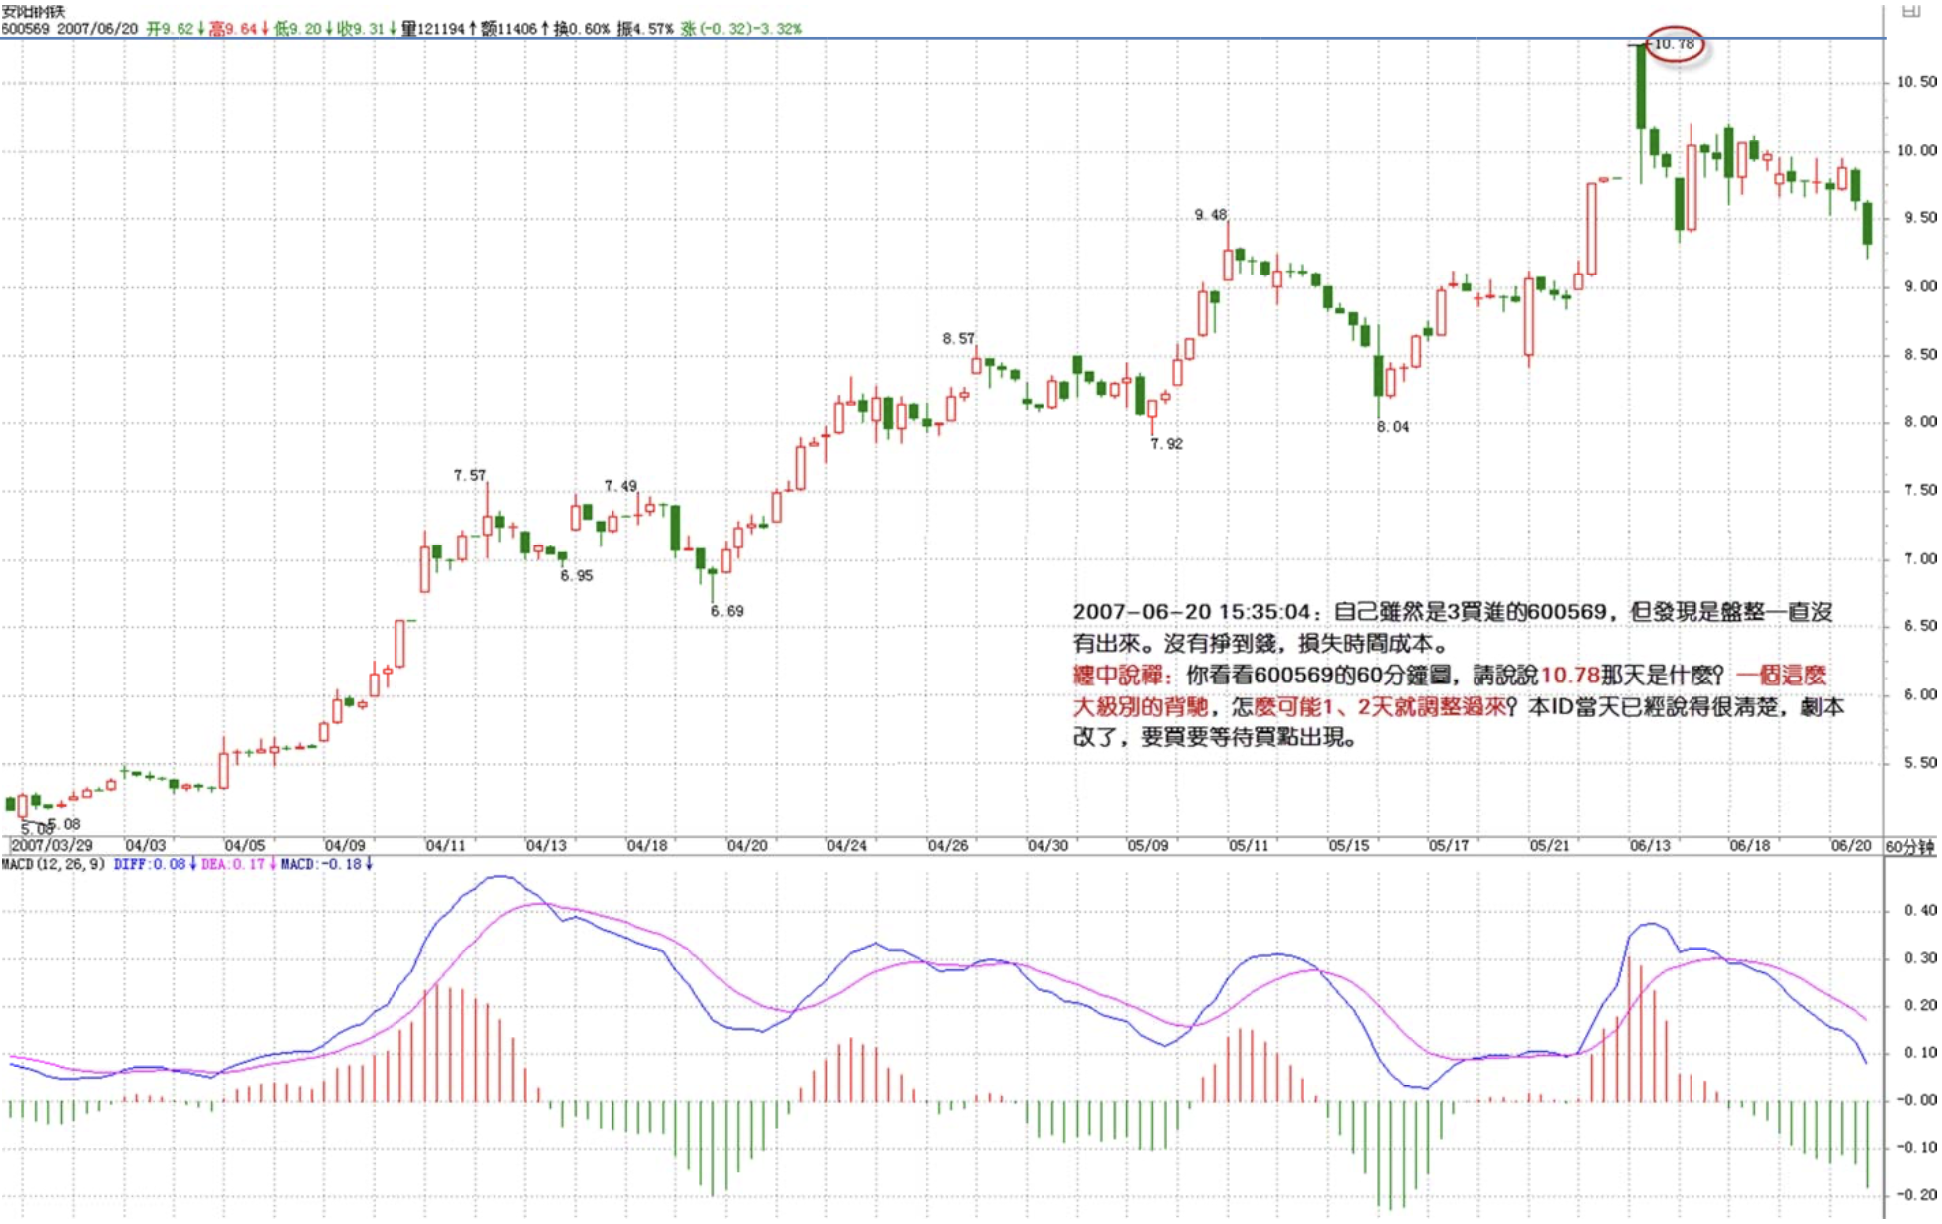
2007-06-20 15:35:04
Self-criticism.
Although I entered 569 at the third-type buy point, I noticed it was consolidation but never exited.
Focused only on the fact that it's Chan's stock, and forgot Chan's theory — didn't make money, lost time cost.
=
Look at 569's 60-minute chart — tell me, what happened on the day of 10.78? With such a large-level divergence, how could it possibly correct in just 1-2 days? This ID explicitly stated that day very clearly: the script has changed, if you want to buy, wait for a buy point to appear.
Saying it again: even if this ID hadn't specifically reminded that the script had changed, you should be reading charts. If you don't understand, look at how a divergence like 569's typically corrects. 569 is this ID's stock — are 000999, 000777, 600635, 600777, 000778, 600432, 000915, etc., any less so? This ID trades every stock strictly by chart.
缠中说禅 2007/6/20 15:47:20
[Anonymous] New Stock Hand
2007-06-20 15:43:08
Boss got angry yesterday, left, no more lessons. Let me offer some consolation first. Hehe.
I haven't learned well, but just using what you taught about watching the 5-day line has been quite practical. Exited at the high point on the morning of 530, dodged a bullet. Also reduced 70% of holdings this morning. Hehe.
My two questions from yesterday went unanswered, adding one more today :)
- You previously said after China Mobile's return, Unicom would have potential. Now China Mobile's return is confirmed — can I go heavy on Unicom?
- 416 has neither earnings nor catalysts — is it still going for first place?
- Can you recommend a few more medium-term stocks? Declare them as not yours. Someone has called for this. I'll second it.
==
Study the theory diligently, if you have a feel for it. Other questions are meaningless. Everything follows chart analysis. As for 600050, medium-term certainly no problem — depends on whether you have the patience. Generally, retail investors don't really need to participate in this kind of stock. Retail investors can perfectly well conduct short-term operations based on at most 30-minute levels — this is the most efficient approach. Of course, the prerequisite is that you truly understand this ID's theory.
缠中说禅 2007/6/20 15:49:31
[Anonymous] abc
2007-06-20 15:45:39
We're rather confused about line segment delineation at the 5-minute or 30-minute level — Master, could you analyze a 5-minute chart next time?
==
The timeframe of a chart and the level are not related. If you use 5-minute or 30-minute charts to determine line segments, it's like using a low-magnification microscope — the only difference from the 1-minute chart is lower precision. Using a 1-minute chart, you can equally identify yearly hubs.
缠中�说禅 2007/6/20 15:53:31
Sorry, guests from out of town arrived today. This ID must go indulge. Technical questions will all be covered in tomorrow's Lesson 61. If possible, please try analyzing on your own first, then compare tomorrow.
Signing off for now, goodbye.
缠中说禅 2007/6/20 8:15:37
Today's market analysis will be appended to this post after 3 PM.
Signing off for now, goodbye.