Teaching You to Trade Stocks 27: Consolidation Divergence and Historic Bottoms
2007/2/2 15:11:27
A trend must have at least two hubs of the same level. For divergence, it definitely won't occur after the first hub — it must be after at least the second hub. For extended trends, divergence might occur only after the 100th hub, but of course, such a situation can barely be seen a few times in a century. The situation where divergence occurs after the second hub accounts for the vast majority of cases, especially on daily and above timeframes, where this reaches over 90%. Therefore, once a daily-or-above-level second hub appears, you must watch closely for divergence. On smaller timeframes, such as 1-minute, this proportion is a bit lower, but still constitutes the majority. Cases where divergence appears only after 4 or 5 hubs are quite rare.
If divergence appears at the first hub, it cannot be true divergence in the strict sense — it can only be counted as consolidation divergence. Its true technical meaning is essentially a movement attempting to break away from the hub that, due to limited force, is stopped and returns to the hub. Generally speaking, small-timeframe consolidation divergence isn't very significant and must be combined with its position. If it's at a high position, the risk is greater — it's often a knife-licking activity. But if it's at a low position, the significance is different because most second and third-type buy points are actually formed by consolidation divergence, while first-type buy points are mostly formed by trend divergence. Generally speaking, second and third-type buy points both have a three-segment structure, where the third segment often slightly breaks the extreme position of the first segment, forming a consolidation divergence. Note that here the first and third segments are being compared as two trend types — this is somewhat different from the trend divergence situation. Whether these two trend types are necessarily trends isn't critical — two consolidations can also have their force compared in consolidation divergence. Here, let me supplement a definition: for a certain type of movement at a certain level, if it constitutes divergence or consolidation divergence, that segment of movement type is called a divergence segment of that level.
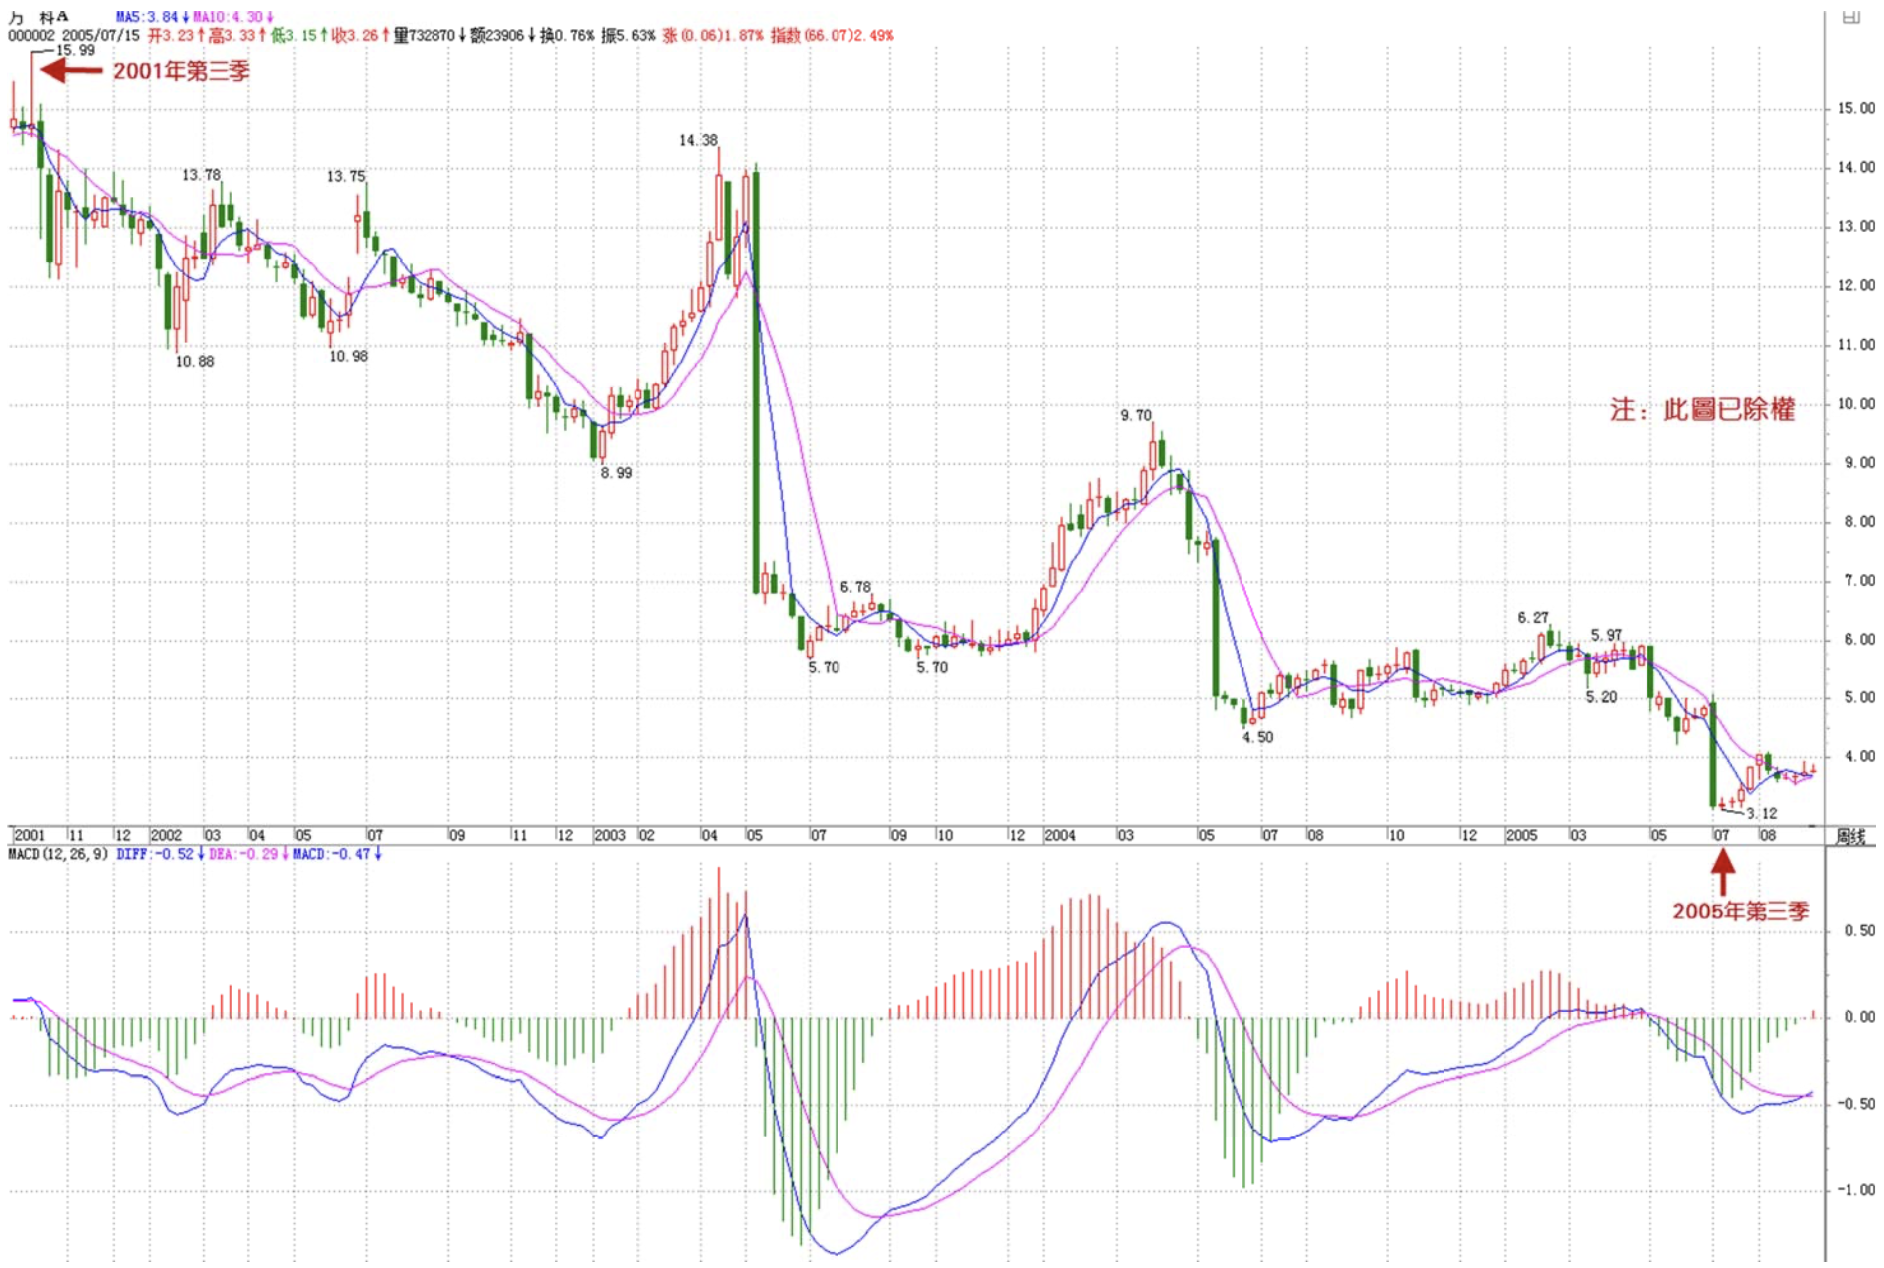
The most useful application of consolidation divergence is on large timeframes, particularly at least the weekly level or above. What consolidation divergence discovers at these levels is often a historic major bottom. Combined with MACD, this divergence is very easy to identify. There are too many examples. Take 000002 — everyone knows this stock is a major bull stock, but its bottom, if you've learned this ID's theory, can be discovered by anyone. Look at the quarterly chart of this stock — that is, three months as one candlestick. The decline from 36.7 yuan in Q1 1993 to 3.2 yuan in Q1 1996 constitutes the first segment, exactly 13 quarters, a Fibonacci number. From Q1 1996 to 15.99 yuan in Q3 2001 constitutes the second segment — a typical triangle (triangles appearing as the second segment of a hub are very common) — 23 quarters, close to the Fibonacci number 21. The decline from Q3 2001 to 3.12 yuan in Q3 2005, exactly 17 quarters — half of the Fibonacci number 34, also a significant number. The first segment's decline was 33.5 yuan, the third segment's was 12.87 yuan, extremely close to the Fibonacci numbers 34 and 13 respectively. Since the next Fibonacci number after 13 is 21, and combined with the aforementioned 17, neither could be the decline of the third segment. Therefore, from this numerical perspective, Vanke's bottom near 2.99 yuan was rock-solid. However, this kind of numerical analysis isn't very significant — the simplest judgment can still use MACD. The third segment broke below the first segment's 3.2 yuan, but MACD clearly showed a standard divergence pattern: the DIF/DEA lines pulled back to the zero axis and then declined again without making a new low, and the bar area was clearly smaller than the first segment's. Generally speaking, as long as one of these conditions is met, it can be a divergence signal — both being satisfied makes it even more standard. From the quarterly chart, you can see that Vanke breaking below 3.2 yuan already signaled divergence. In actual trading, just looking at the quarterly chart obviously can't find the precise buy point, but for large capital, this is already sufficient because large capital's position building inherently involves buying more as prices drop — you just need to know that what follows is a quarterly-level move. For small capital, this wastes too much time, so the precise buy point can continue to be tracked down from monthly, weekly, daily, even 30-minute charts. If your technique is good enough, you can even point out on the spot: at this very 1-minute, Vanke hits its historic major bottom. Because once the quarterly chart broke below 3.2 yuan, the divergence was already confirmed, and the third segment's movement can be analyzed from monthly, weekly, daily charts all the way down to find the most precise divergence point.
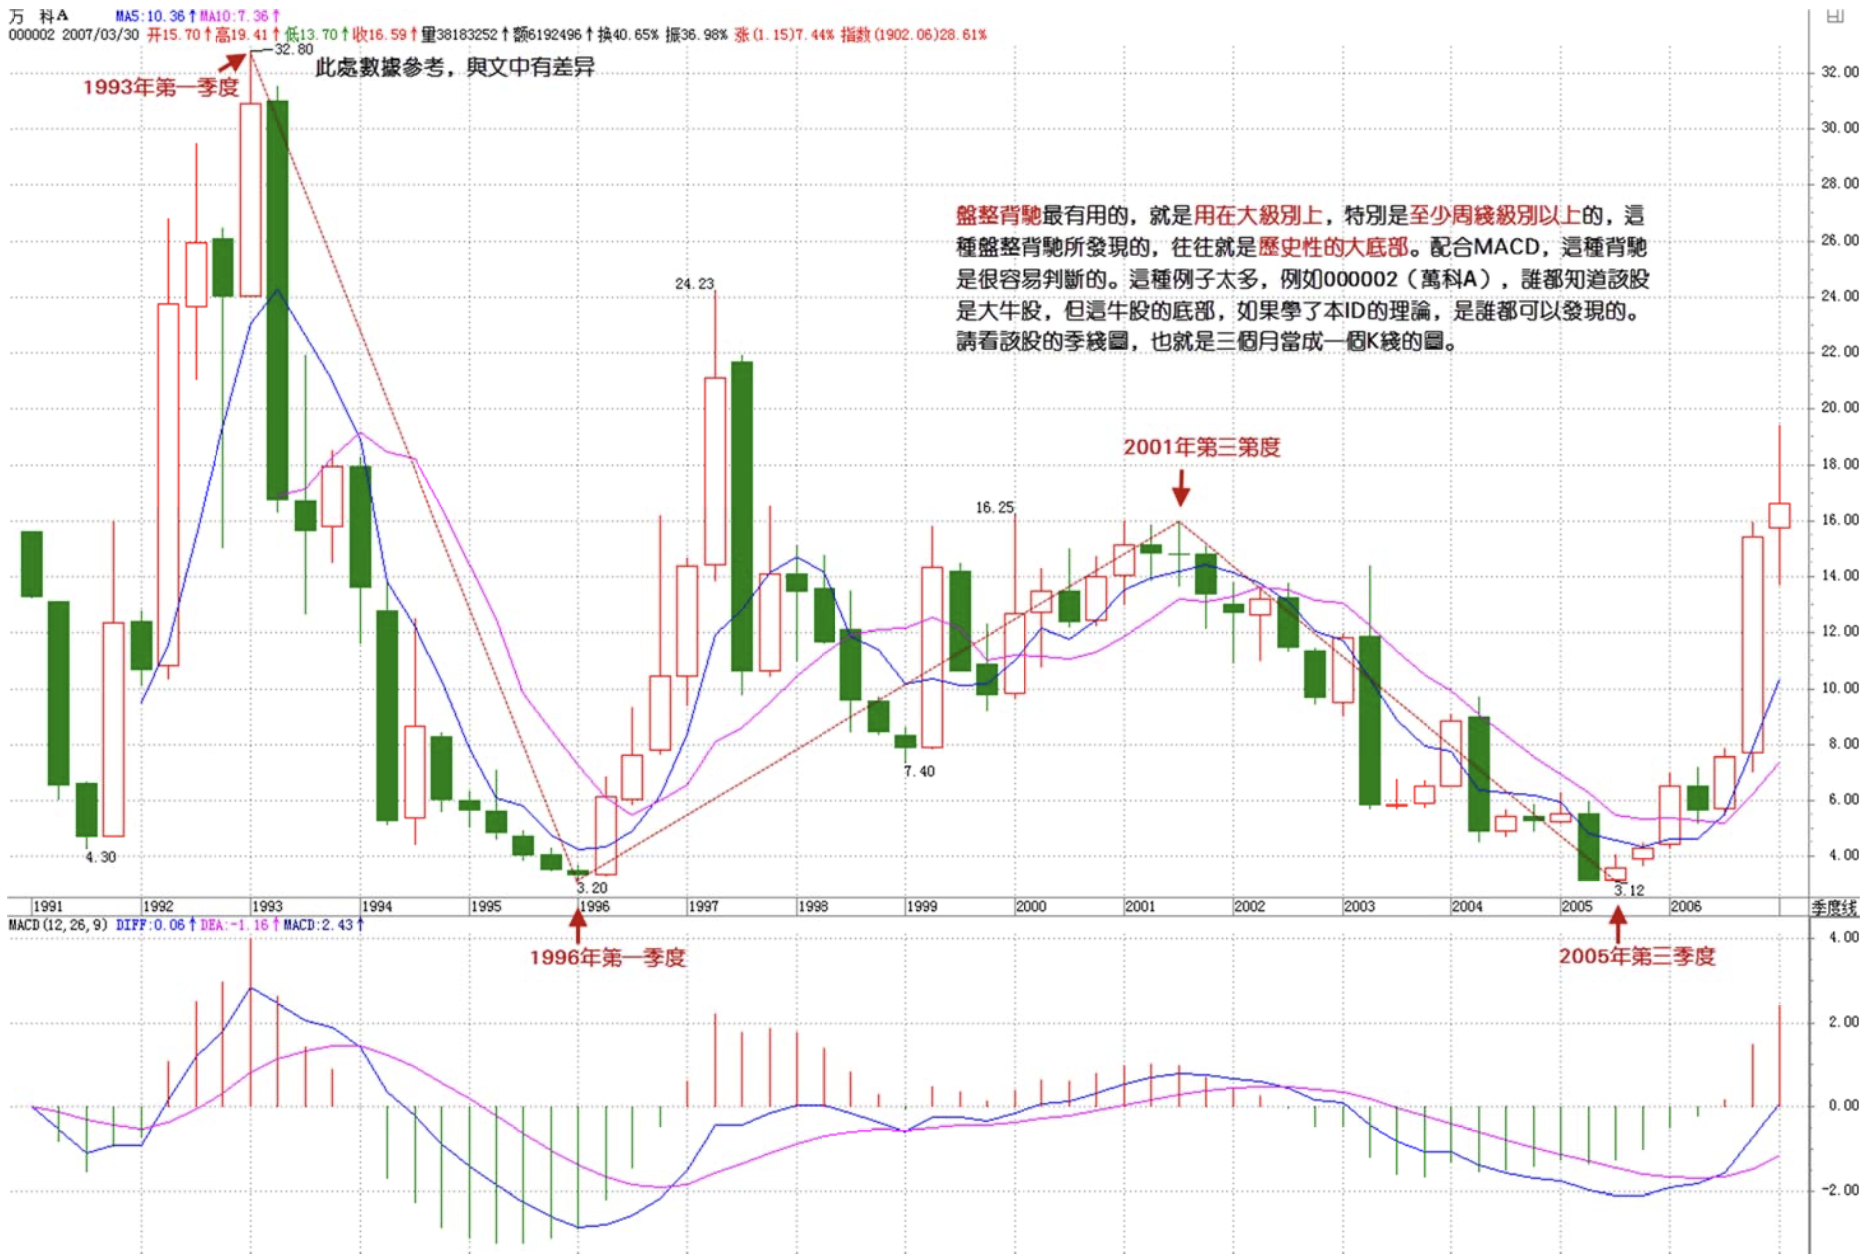
Those who've studied mathematical analysis should remember the Nested Interval Theorem. This method of drilling down from large timeframes to precisely locate large-timeframe buy points follows the same principle as nested intervals. Using Vanke as an example: within the quarterly chart's third segment, on the monthly chart, you can find the divergence segment targeting the last monthly hub. This divergence segment must be within the quarterly divergence segment, and its interval is smaller. Extending this process from monthly to weekly, daily, 30-minute, 5-minute, 1-minute, even down to every single transaction — the interval keeps shrinking. In theory, you could reach a situation where you can pinpoint: this very transaction is the last transaction of Vanke's historic bottom; completing this transaction signifies the formation of a historic bottom and the beginning of a new era. Of course, this is the most ideal case because these levels cannot extend infinitely, so theoretically it cannot be proven to be a point-like situation as precise as a mathematical limit. But using this method to confirm a very precise historic bottom interval is not difficult.
By extension, we can prove the Chán Zhōng Shuō Chán Precise Major Turning Point Location Procedure Theorem: A turning point of a certain major level can be determined through the progressive narrowing of divergence segments across different levels. In other words, for a turning point of a certain major level, first find its divergence segment, then in the sub-level chart, find the divergence segment within the corresponding divergence segment at the sub-level, and repeat this process all the way down to the lowest level. The corresponding turning point lies within the range determined by the divergence segment at that lowest level. If this lowest level can reach every single transaction, theoretically, a major-level turning point can be pinpointed to the divergence of a single transaction — possibly even a unique one. (When this ID discovered this theorem over a decade ago, there was a bad habit of always trying to achieve single-transaction precision in actual trading, which led to inventing other peculiar chart-reading methods. But these are all largely meaningless. A 1-minute divergence segment is typically measured in minutes, which is already sufficiently precise for a major-level turning point and basically useless for large capital.)
To understand this chapter, if you've forgotten, it's best to review the Nested Interval Theorem from advanced calculus — the approach is identical. Of course, since levels are not infinitely divisible, it's impossible to achieve the mathematical precision of a unique point. Those with time can refer to the quarterly charts of 600640, 000001, 000006, 000009, 000012, 600643 to see how historic bottoms were formed. Of course, only particularly old stocks can use quarterly charts. For monthly charts, look at 600663 — a textbook example.
The above discusses buy points formed by divergence. Note that first-type buy points are definitely formed by trend divergence. Buy points formed by consolidation divergence have little significance at small timeframes, which is why they weren't previously designated as a specific type of buy point. But at large timeframes, they also constitute a type similar to first-type buy points, because at ultra-large timeframes, a clear trend often doesn't form. As mentioned previously in replies, from the largest timeframe perspective, all stocks only have one hub. Therefore, at large timeframes, the vast majority of stocks are actually in consolidation, and that's when you need these quasi-first-type buy points formed by consolidation divergence. This level should be at least weekly or above.
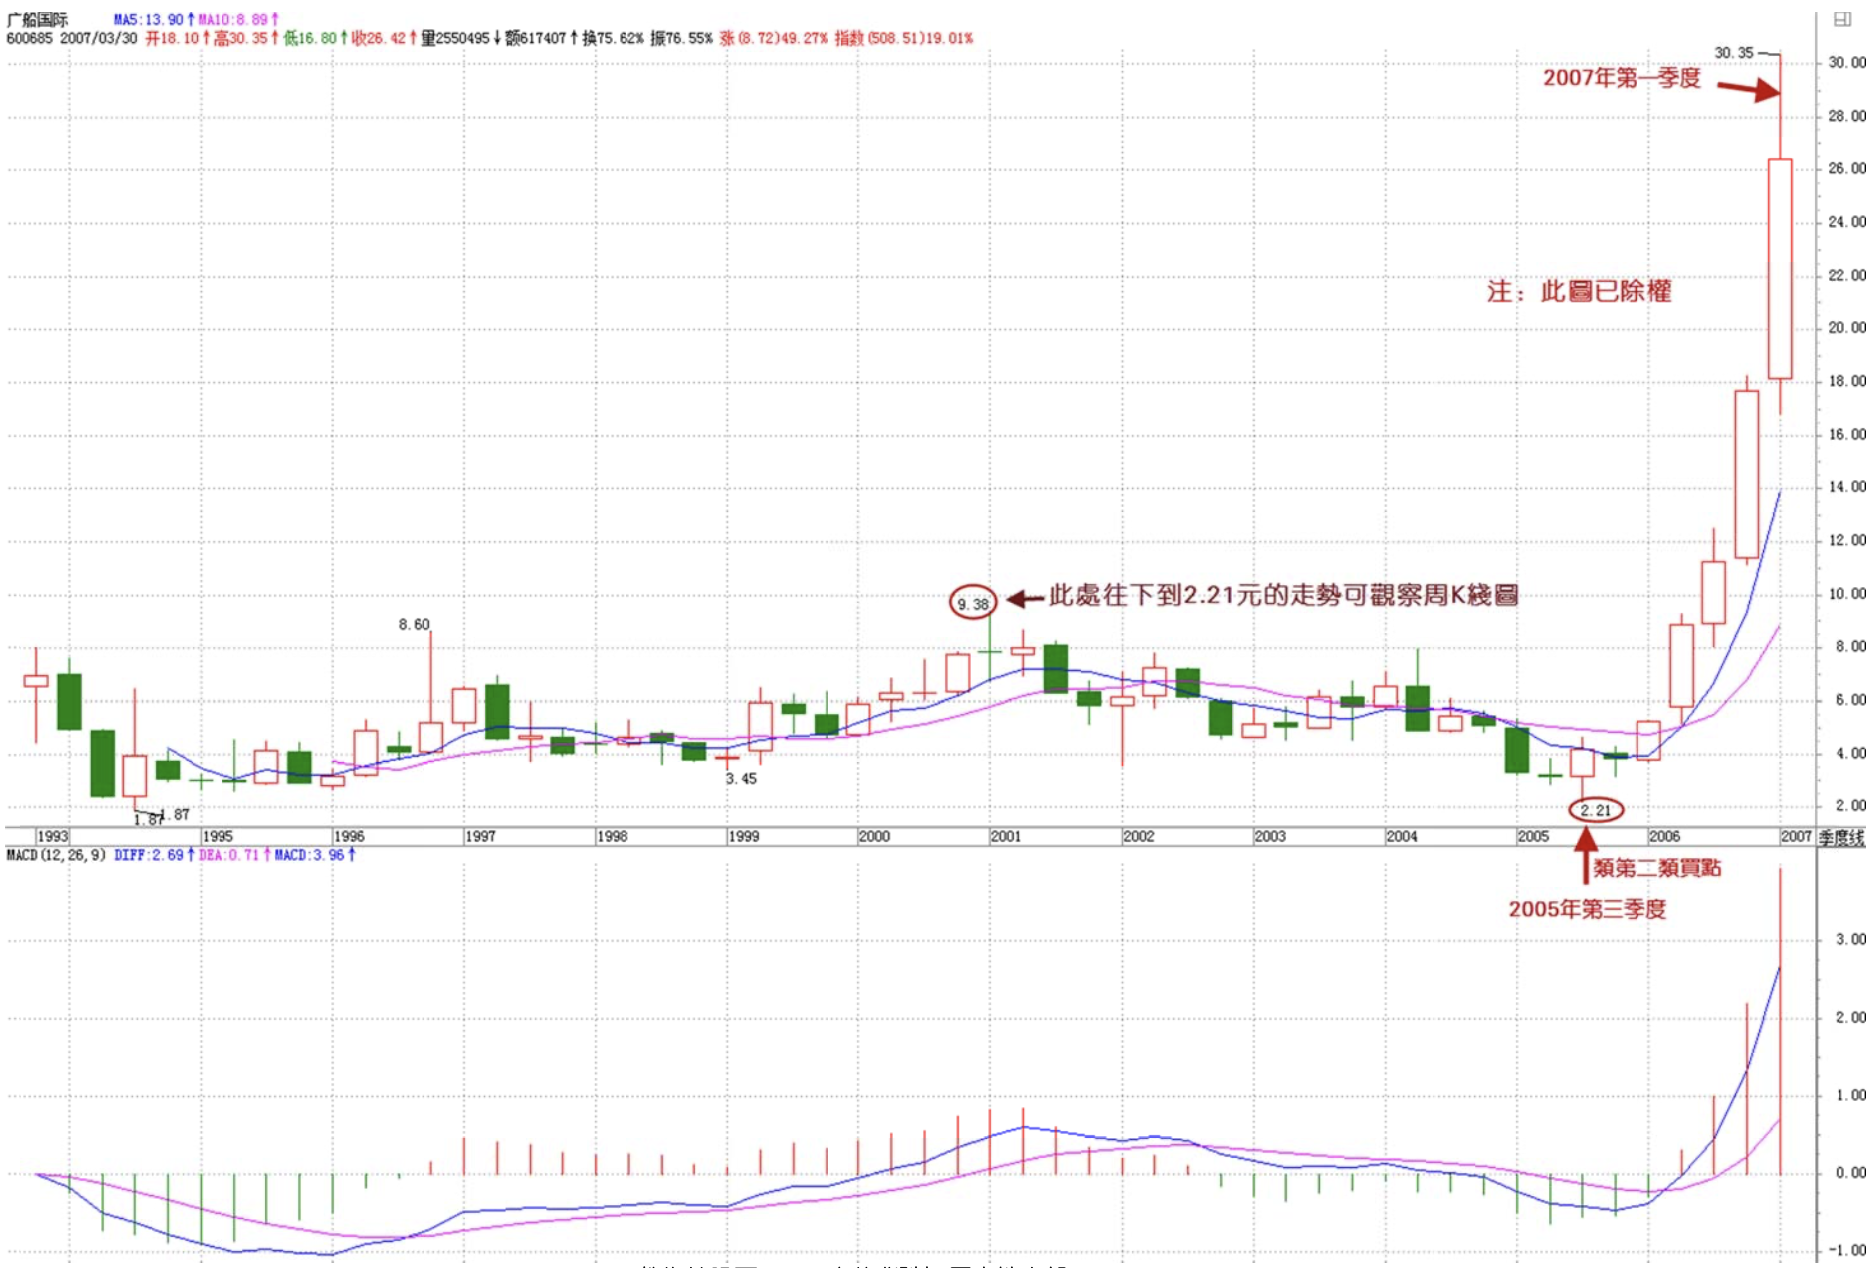
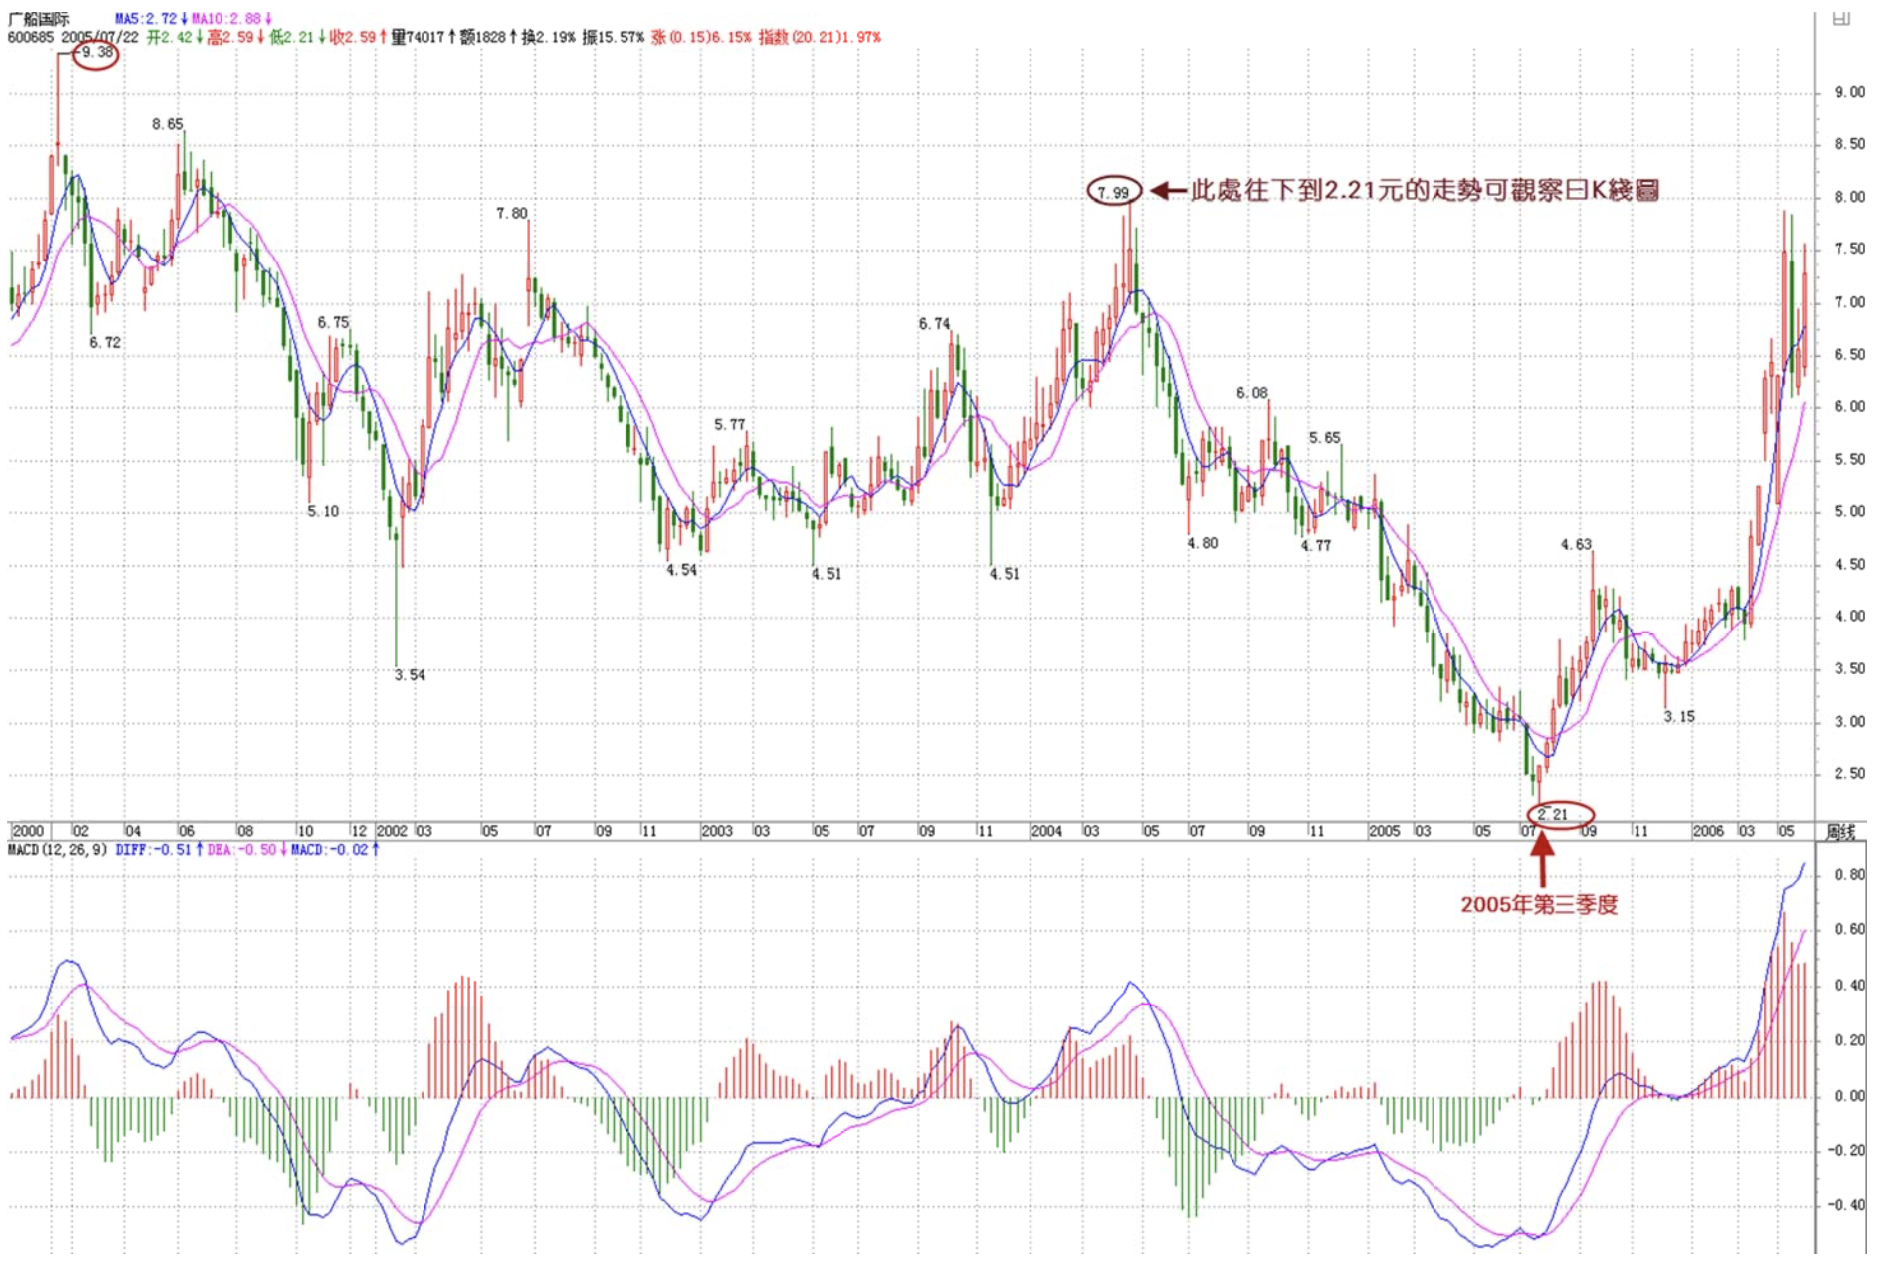
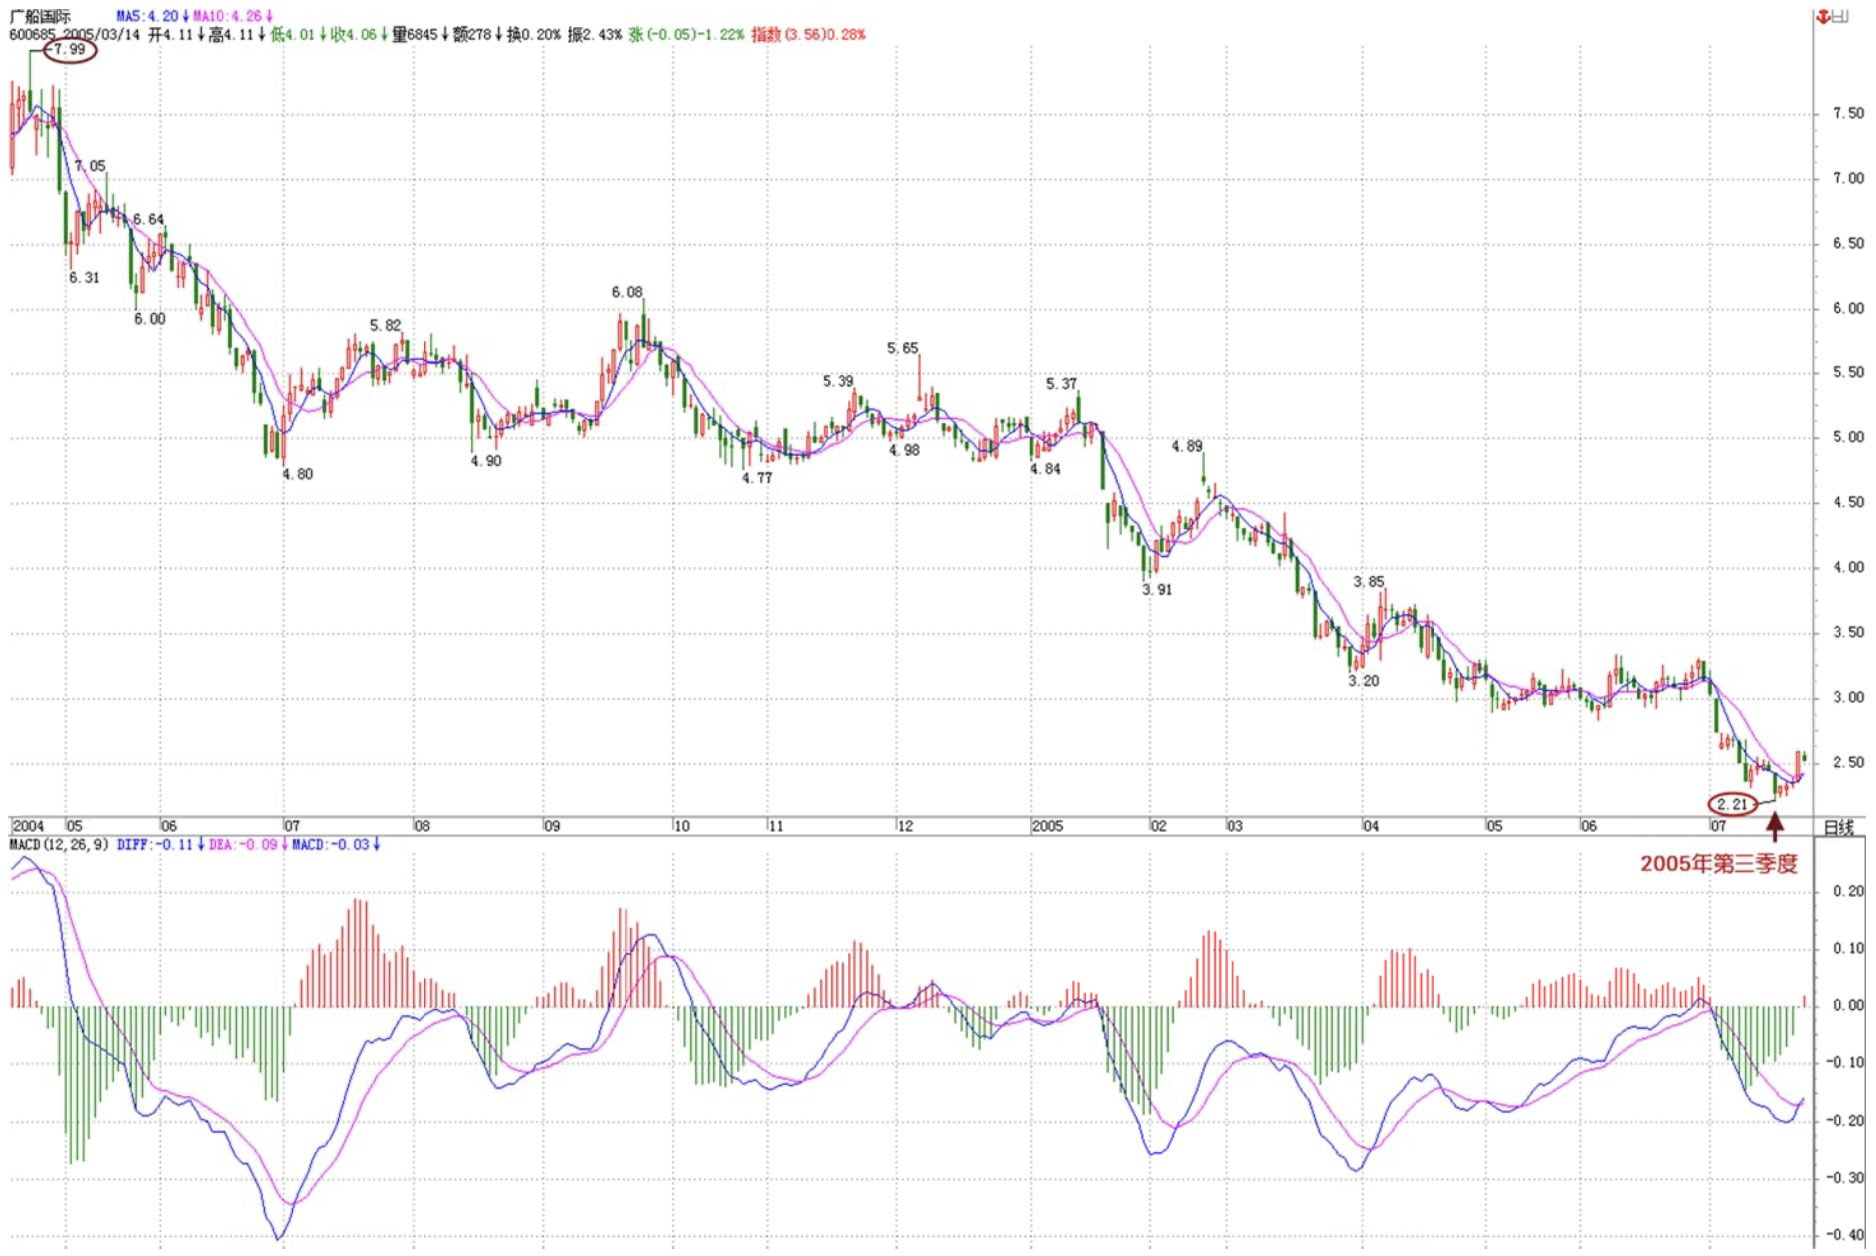
Similarly, at large timeframes, if no new low appears but something resembling a second-type buy point can be formed, MACD shows performance similar to divergence — DIF/DEA lines pull back to around the zero axis, and the latter bar area is smaller than the former. A most typical example is the quarterly chart of 600685 — the 2.21 yuan in Q3 2005 forms a typical quasi-second-type buy point. In actual trading, locating the corresponding interval of 2.21 yuan is also achieved by the method of progressively drilling down through levels to find divergence segments.
This lesson presents a method for finding major bull market bottoms — a method sufficient to serve you for a lifetime. As more stocks accumulate over time and old stocks age, this method will shine brilliantly in the next great bull market — which might not come for another 30 years. In 30 years, I hope you still remember this lesson. Of course, if applied at the weekly level, you don't need to wait 30 years. However, discoveries at the weekly level may not be historic major bottoms — perhaps just relatively long-term bottoms. If this method is applied to the daily level, it still works, but the corresponding reliability is not quite as absolute.
(To be continued)
Here's a supplementary educational standards framework for this ID's theory:
Proficient at identifying hubs at all levels — Kindergarten graduate
Proficient at distinguishing hub regeneration, extension, and expansion — Pre-school graduate
Proficient at differentiating consolidation divergence from trend divergence, and avoiding the transformation of consolidation divergence into third-type buy/sell points — Elementary school graduate
Everyone, check where you stand.
Plagiarism is strictly prohibited; violators will be prosecuted.
Replies
缠中说禅 2007/2/2 15:20:44
[Anonymous] 乐土
2007-02-02 15:19:05
Master Chan: is this round of the great bull market basically overound of the great bull market basically over?
===
This bull market's first segment hasn't even finished — what do you mean "basically over"? A weekly-level adjustment is normal; it's not like we just started saying this today. This adjustment is at most the same level as the one from May to August last year — and what followed August?
缠中说禅 2007/2/2 15:30:09
[Anonymous] 密码
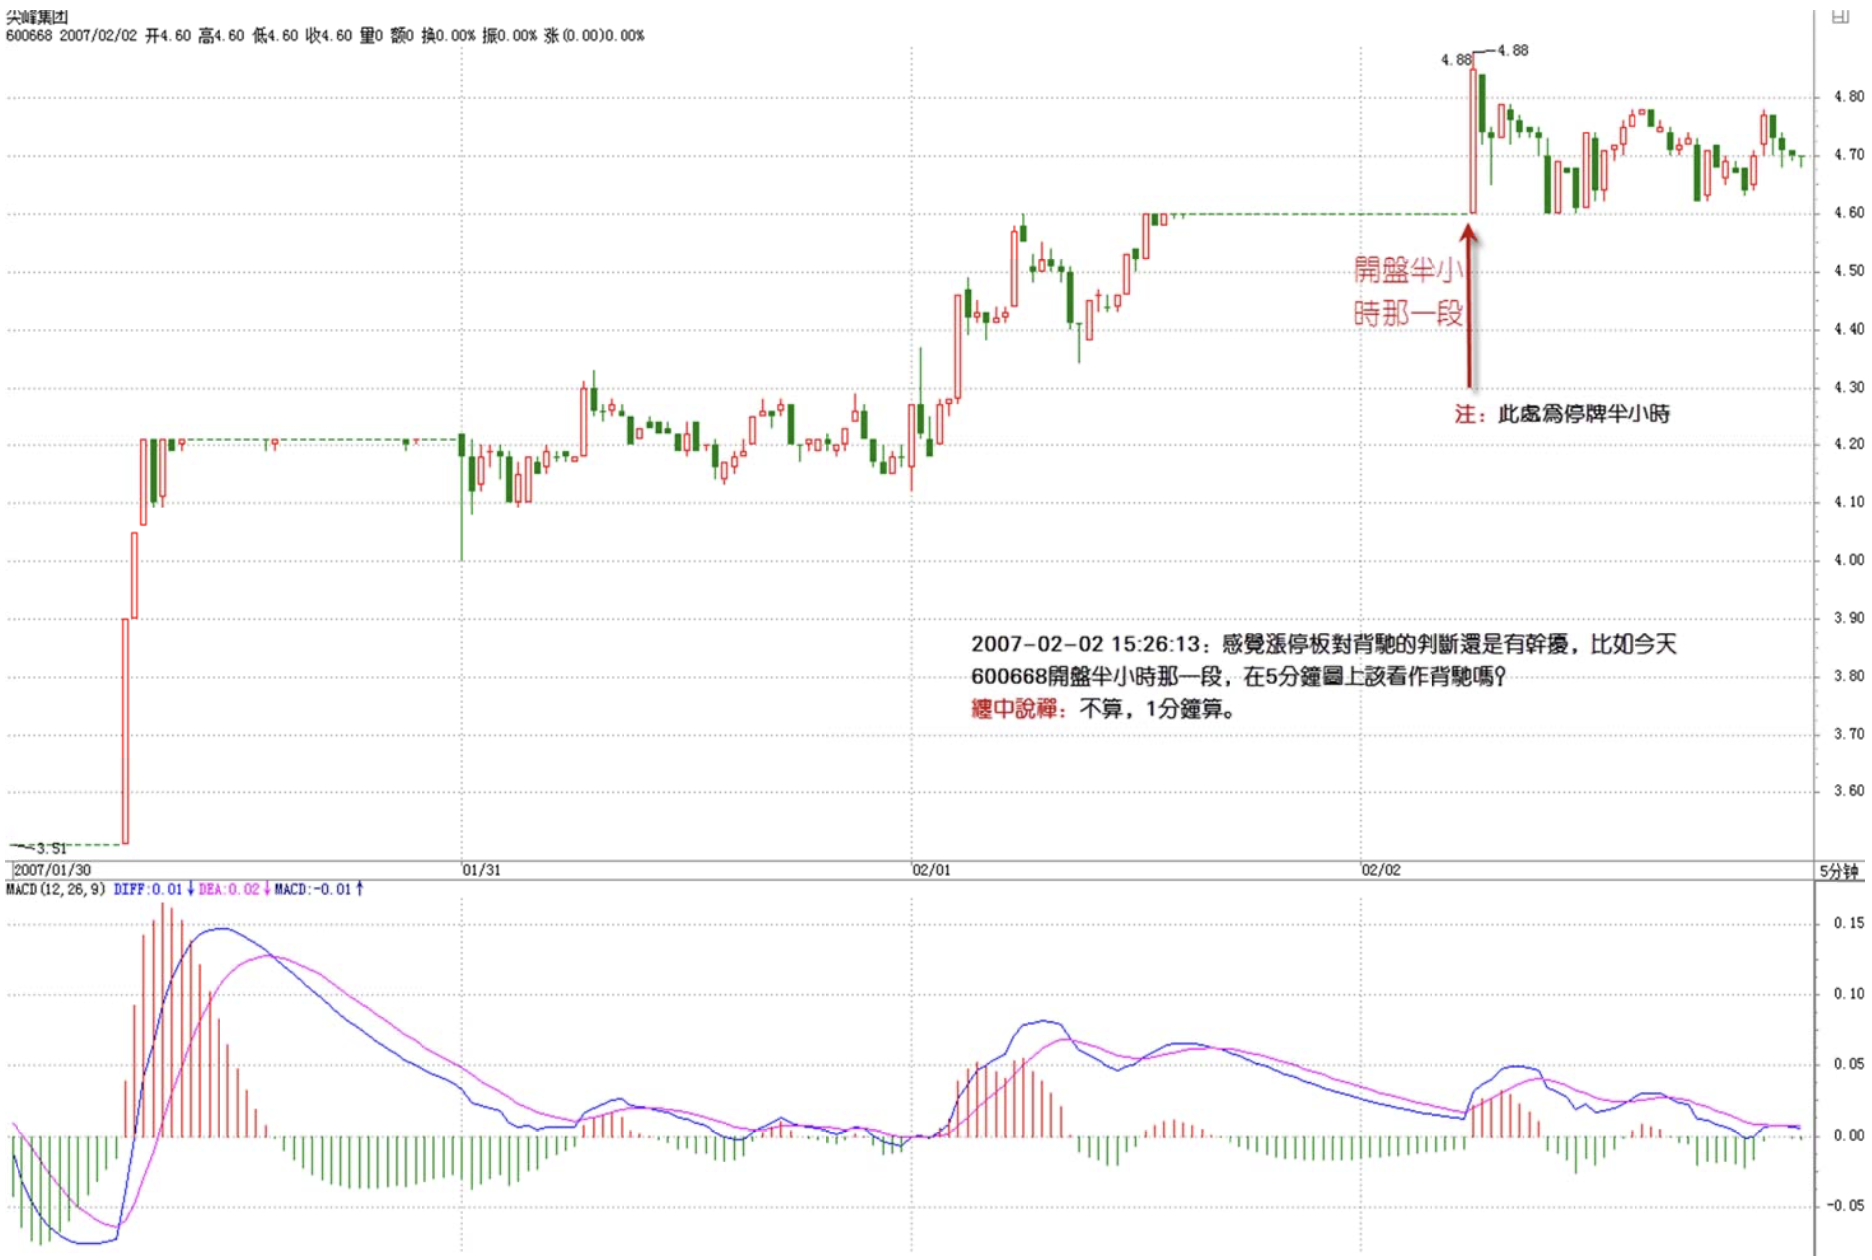
2007-02-02 15:26:13
I feel like daily limit boards still interfere with divergence judgment. For example, the first half hour of today's 600668 opening — should that be seen as divergence on the 5-minute chart?th divergence judgment. For example, the first half hour of today's 600668 opening — should that be seen as divergence on the 5-minute chart?
==
No, it counts on the 1-minute chart.
缠中说禅 2007/2/2 15:31:56
[Anonymous] 乐土
2007-02-02 15:29:26
Master Chan, thanks! One more question: is CITIC Securities 600640's 30-minute chart showing fake divergence today? Should I still wait for a divergence buy point like a hunter? Thanksies 600640's 30-minute chart showing fake divergence today? Should I still wait for a divergence buy point like a hunter? Thanks
===
Divergence is divergence — there's no such thing as "fake divergence." If it's wrong, it's because your judgment was wrong. Most mistakes come from confusing consolidation divergence transforming into a third-type buy/sell point with actual divergence. If you can pass this test, your level is ready for middle school.
缠中说禅 2007/2/2 15:33:25
[Anonymous] 东山
2007-02-02 15:27:35
Miss Chan
Regarding some proofs of Chán Zhōng Shuō Chán theorems — when you have time, could you write them up? Chán theorems — when you have time, could you write them up?
==
For some theorems, you can prove them yourself. If you can prove them, it shows your understanding is deep enough. So this is a great exercise. Today's lesson is a perfect example.
缠中说禅 2007/2/2 15:38:17
[Anonymous] 咻咻
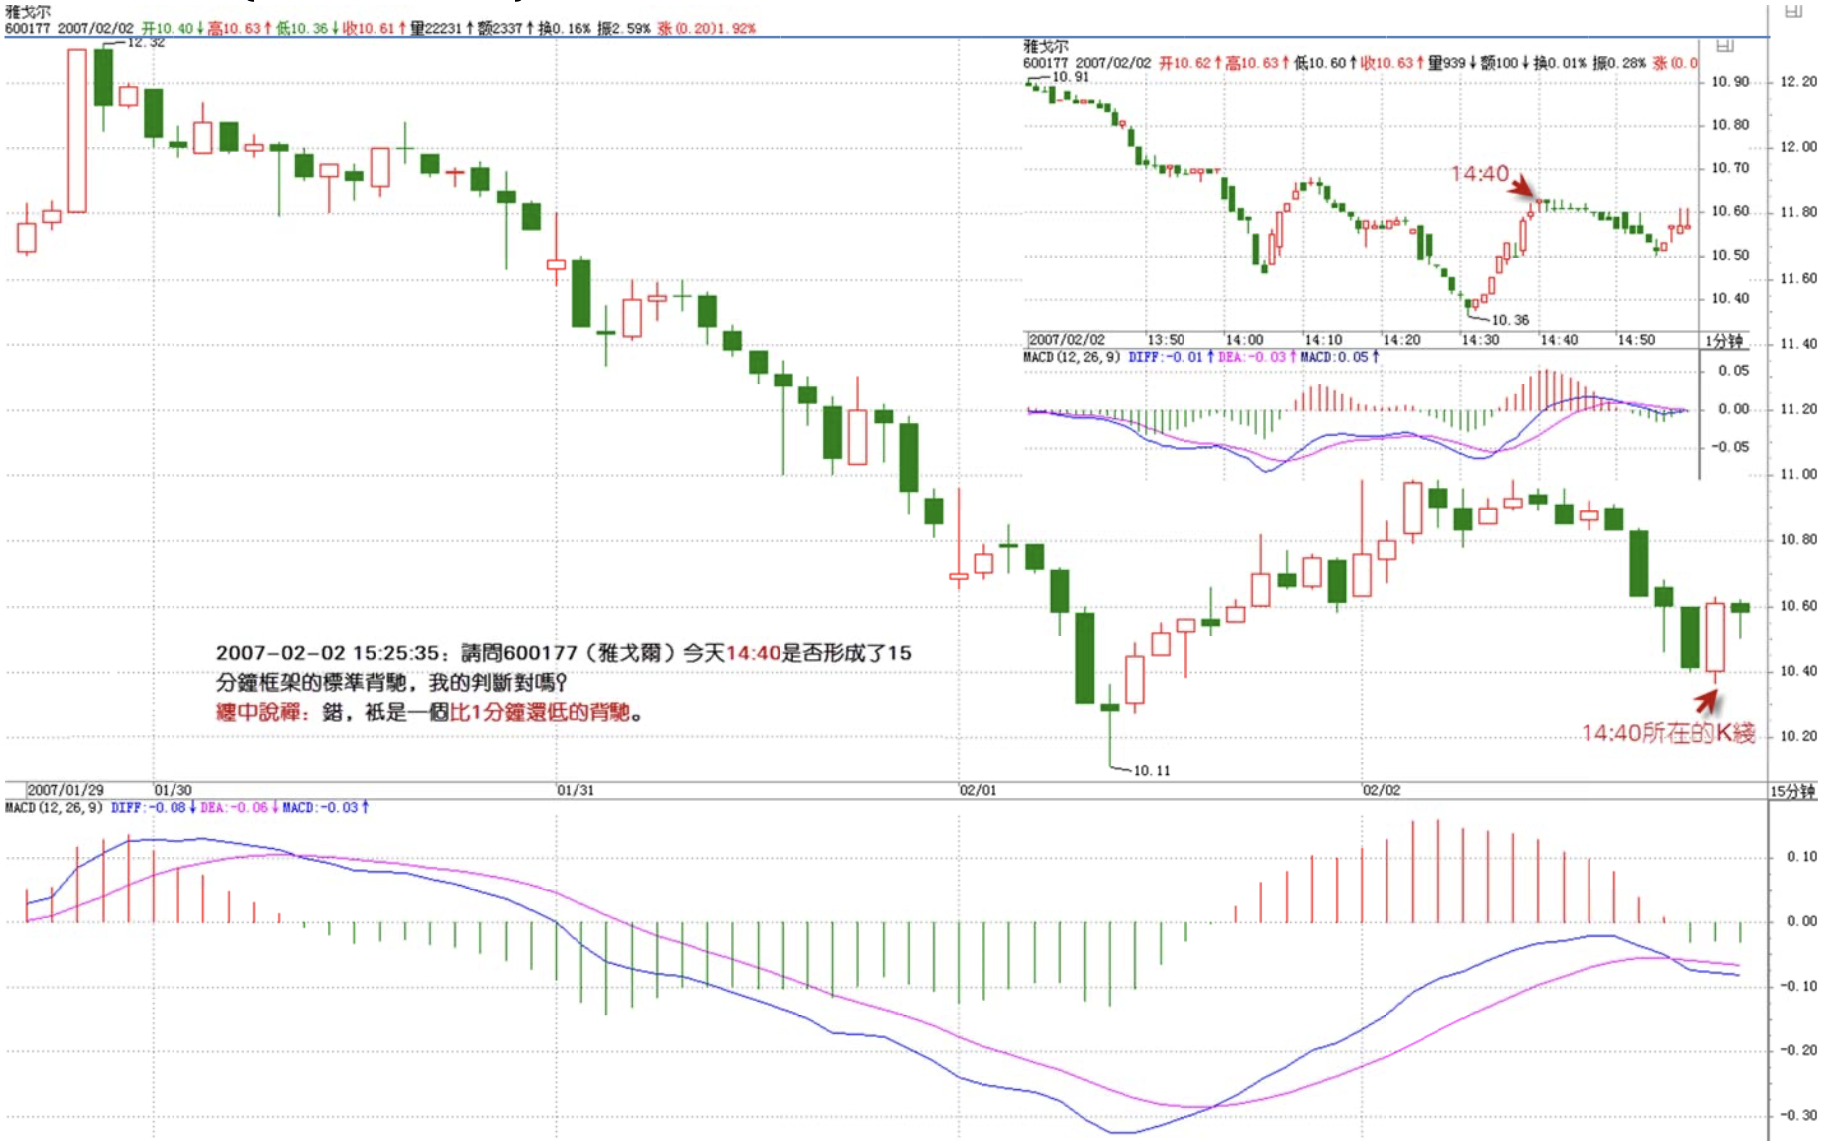
2007-02-02 15:25:35
May I ask whether 600177 formed a standard 15-minute divergence at 14:40 today? Is my judgment correct? Thanksard 15-minute divergence at 14:40 today? Is my judgment correct? Thanks
==
Wrong — it's only a divergence at a level lower than 1-minute.
缠中说禅 2007/2/2 15:39:15
[Anonymous] 罗锅
2007-02-02 15:36:27
Math sister!!!!!!!!!!! I want a big red flower!!!!!!!!!!!! Even consolidation divergence didn't fool me today!!!!!!!!!!!!!!! Can I advance to middle school now???????????????????????
Here's my live commentary!!!!!!!!!!!!!!!
[Anonymous] 罗锅
2007-02-02 14:19:55
This moment is critical!!!!!!!!!!!!!!!! If it can't rally back then it's a No. 3 sell point!!!!!!!! Because math sister said so!!!!!!!!!!!!!!! Consolidation divergence can possibly evolve into No. 3 buy/sell points!!!!!!!!!!!!!!! You must see this clearly!!!!!!!!!!!!!!!!!!!!!!!!!!!! !!! Consolidation divergence can possibly evolve into No. 3 buy/sell points!!!!!!!!!!!!!!! You must see this clearly!!!!!!!!!!!!!!!!!!!!!!!!!!
===
You've graduated elementary school. Be humble from now on — the road ahead is long.
缠中说禅 2007/2/2 15:42:48
Attention everyone!
Here's an educational standards framework for everyone:
Proficient at identifying hubs at all levels — Kindergarten graduate
Proficient at distinguishing hub regeneration, extension, and expansion — Pre-school graduate
Proficient at differentiating consolidation divergence from trend divergence, and avoiding the transformation of consolidation divergence into third-type buy/sell points — Elementary school graduate
缠中说禅 2007/2/2 15:47:13
[Anonymous] 惑
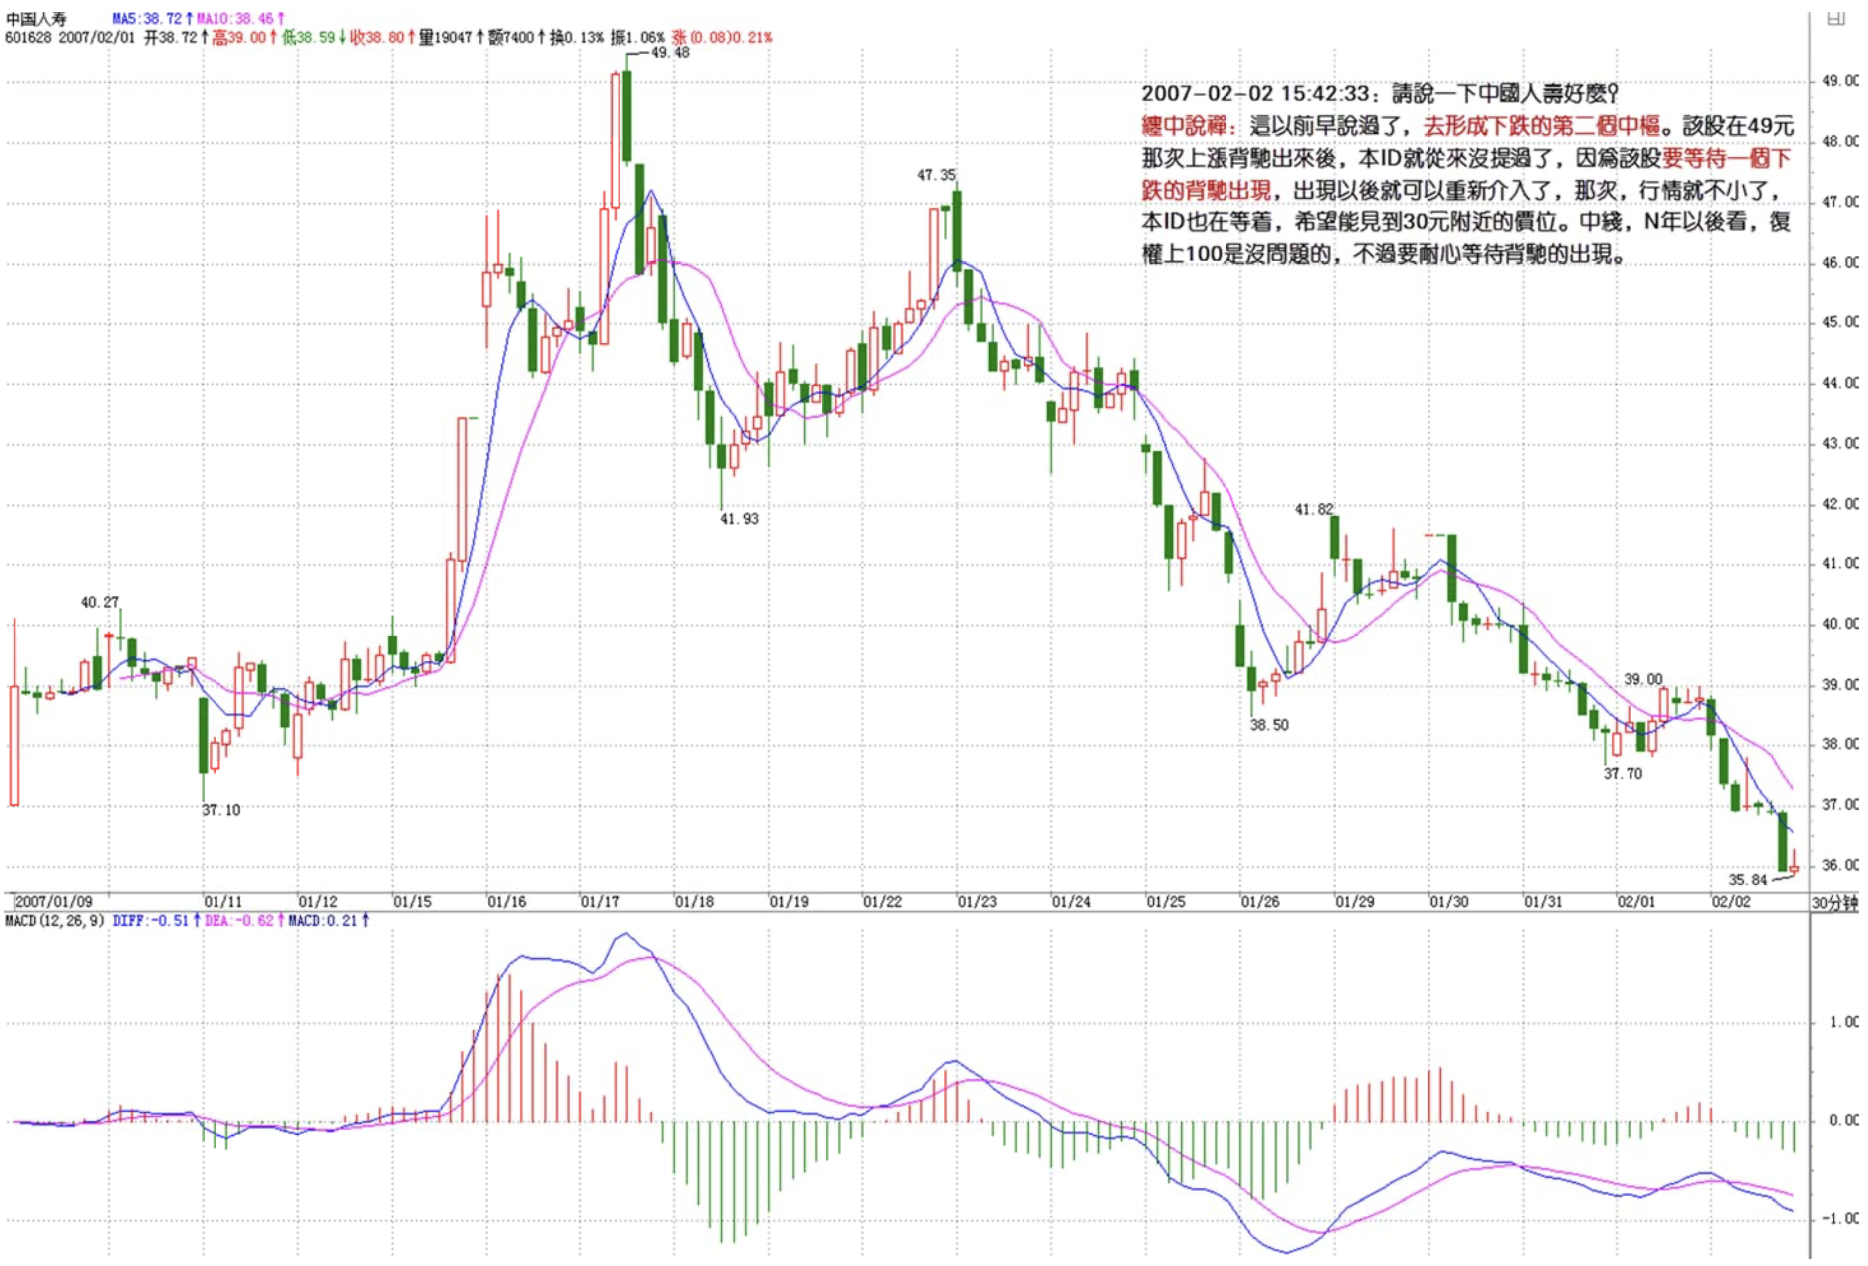
2007-02-02 15:42:33
Could you talk about China Life Insurance?talk about China Life Insurance?
==
This was discussed long ago — it's going to form the second hub of the decline. After this stock showed divergence on the uptrend at 49 yuan, this ID never mentioned it again, because it needed to wait for a downward divergence to appear. Once that appears, re-entry is warranted and the resulting move won't be small. This ID is also waiting — hoping to see prices near 30 yuan. Long-term, looking N years ahead, adjusted price over 100 is no problem, but you need patience to wait for the divergence to appear.
缠中说禅 2007/2/2 15:49:51
[Anonymous] Night雨
2007-02-02 15:44:21
Beautiful big sister, let me summarize today's operation — selling was all correct, but I didn't find good buy points, so buying was all wrong. You really have to see clearly before pulling the trigger. But buy points were so hard to find today.n — selling was all correct, but I didn't find good buy points, so buying was all wrong. You really have to see clearly before pulling the trigger. But buy points were so hard to find today.
==
Who told you that there must be a buy point every day? In strong trends, a 1-minute buy point might appear only once every 2-3 days. But a 5-minute buy point is currently forming. For large capital and good stocks, you can actually begin partial entry today.
缠中说禅 2007/2/2 15:55:38
[Anonymous] Little Bird
2007-02-02 15:50:16
Sister, today on 600331 at 13:50 PM I thought there should be divergence, but it continued to drop. Then the last 10 minutes before close is the divergence, right? But although the green bars are taller than the 10 AM ones, the moving average is even lower — how come?
I haven't even entered kindergarten yet, crying~
To add: this is on the 5-minute charts is on the 5-minute chart
==
Divergence has nothing to do with moving averages. When talking about divergence, you must first specify the level — otherwise there's nothing to discuss.
缠中说禅 2007/2/2 15:58:03
[Anonymous] 炼铁设备
2007-02-02 15:54:58
Help me!
Today on 416, the 1-minute chart: from February 1's 4.30 to February 2's 4.73, did this up-down-up process produce divergence 1's 4.30 to February 2's 4.73, did this up-down-up process produce divergence?
==
For certain sensitive stocks, this ID won't comment — to avoid being accused of being both referee and player. Analyze it yourself, or discuss with each other.
缠中说禅 2007/2/2 15:59:51
[Anonymous] 乐土
2007-02-02 15:57:57
Master Chan: I think since I'm learning your theory, I should pick a different stock to practice on. What do you think about CITIC 600640 or Shenzhen Development? I want to wait for the No. 1 buy point like a hunter. Today I wanted to buy several times, but thinking it didn't match Chán Zhōng Shuō Chán's buy point principles, I held back. Thanksout CITIC 600640 or Shenzhen Development? I want to wait for the No. 1 buy point like a hunter. Today I wanted to buy several times, but thinking it didn't match Chán Zhōng Shuō Chán's buy point principles, I held back. Thanks
==
When you're not yet skilled enough, it's best to pick stocks that have just broken through the bottom with decent fundamentals — that's safer.
缠中说禅 2007/2/2 16:02:18
[Anonymous] 锅贴
2007-02-02 15:57:01
Pretty poster, my 600090 is in bad shape. Could you take a look and tell me if I should still hold? Thanks bad shape. Could you take a look and tell me if I should still hold? Thanks
==
Find a buy point to enter for short-term trades — what's so terrible about that? If your technique is good, oscillations can make you a lot of money. What is there to fear?
缠中说禅 2007/2/2 16:09:29
[Anonymous] No. 1次实战
2007-02-02 15:55:45
Today I finally mustered the courage to conduct my No. 1 real trade following the poster's theory.
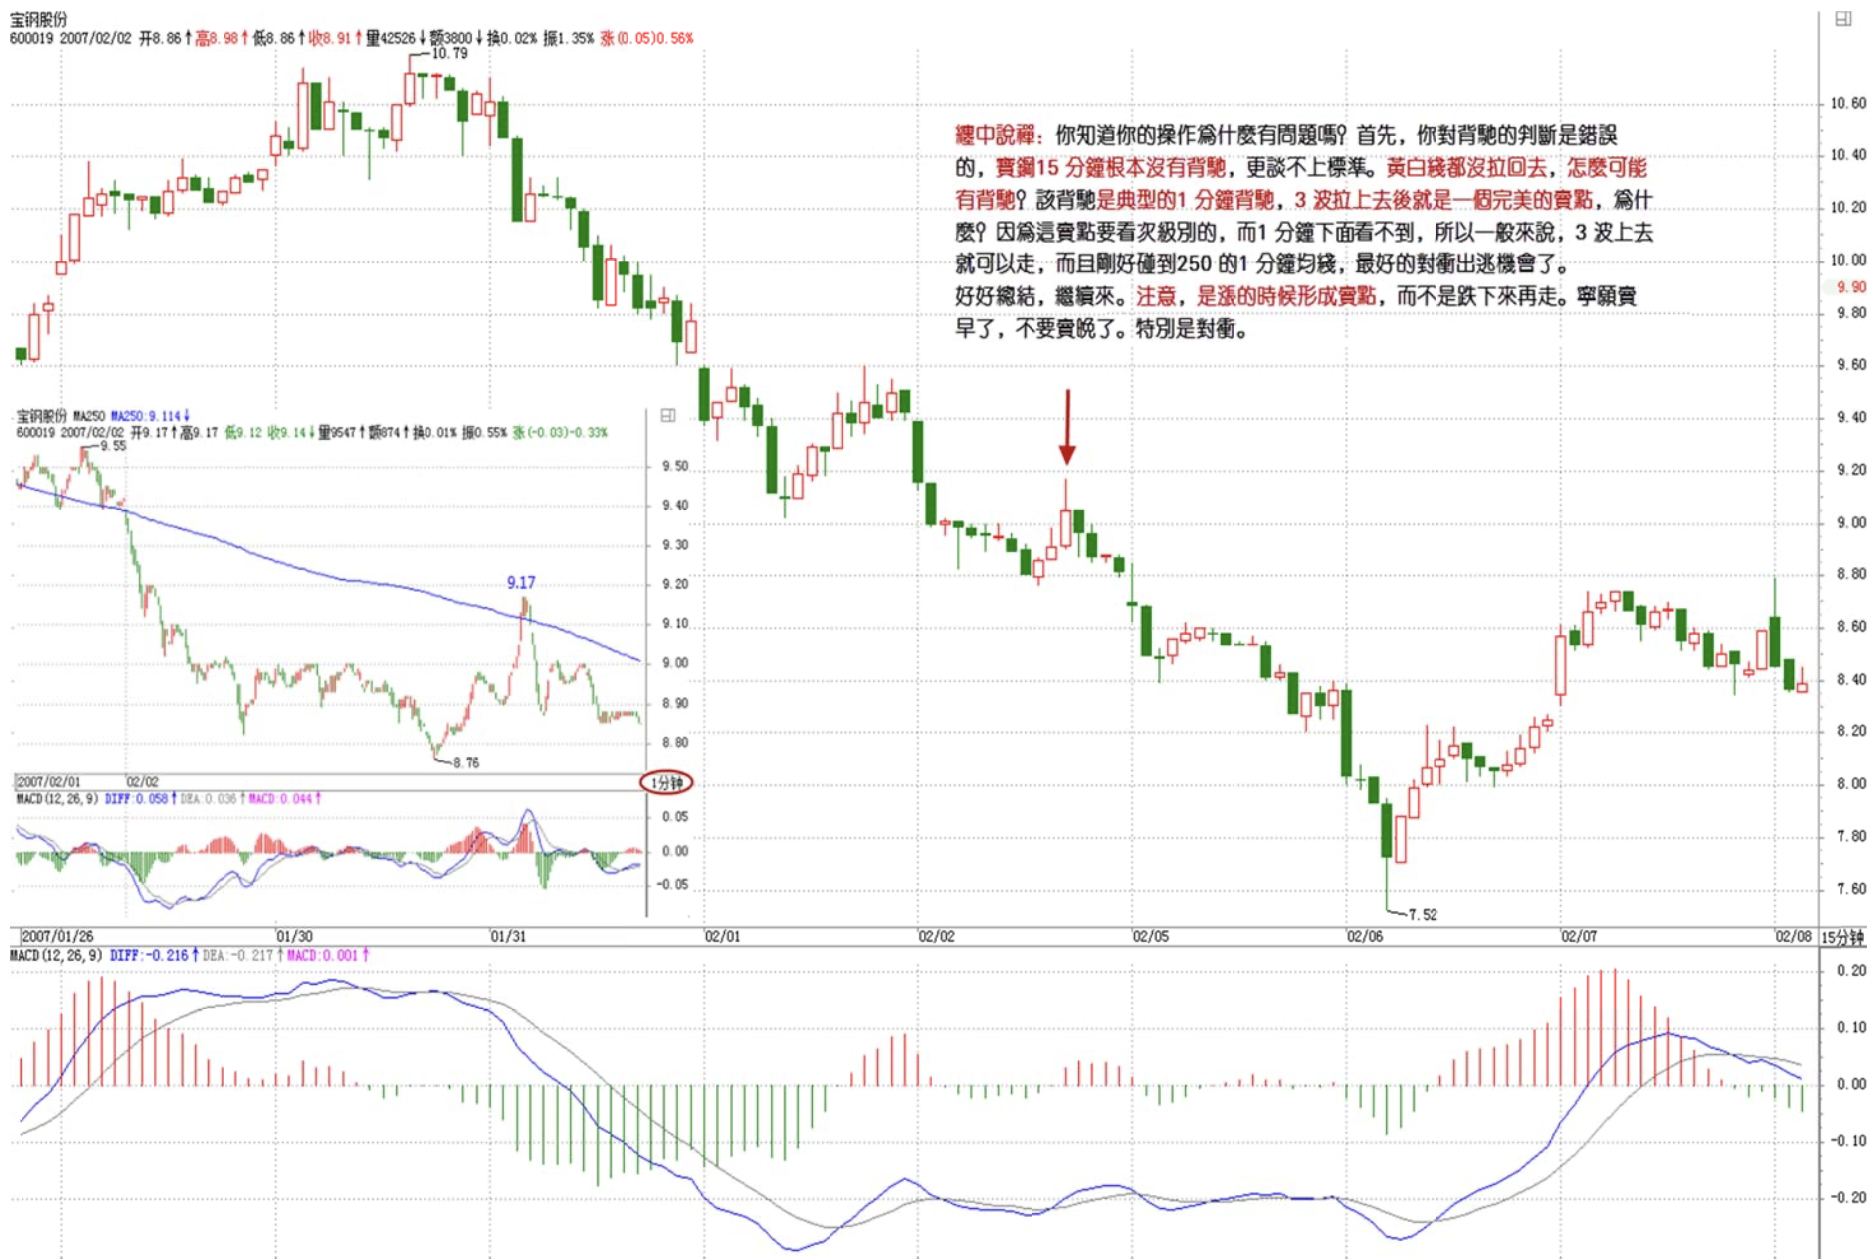
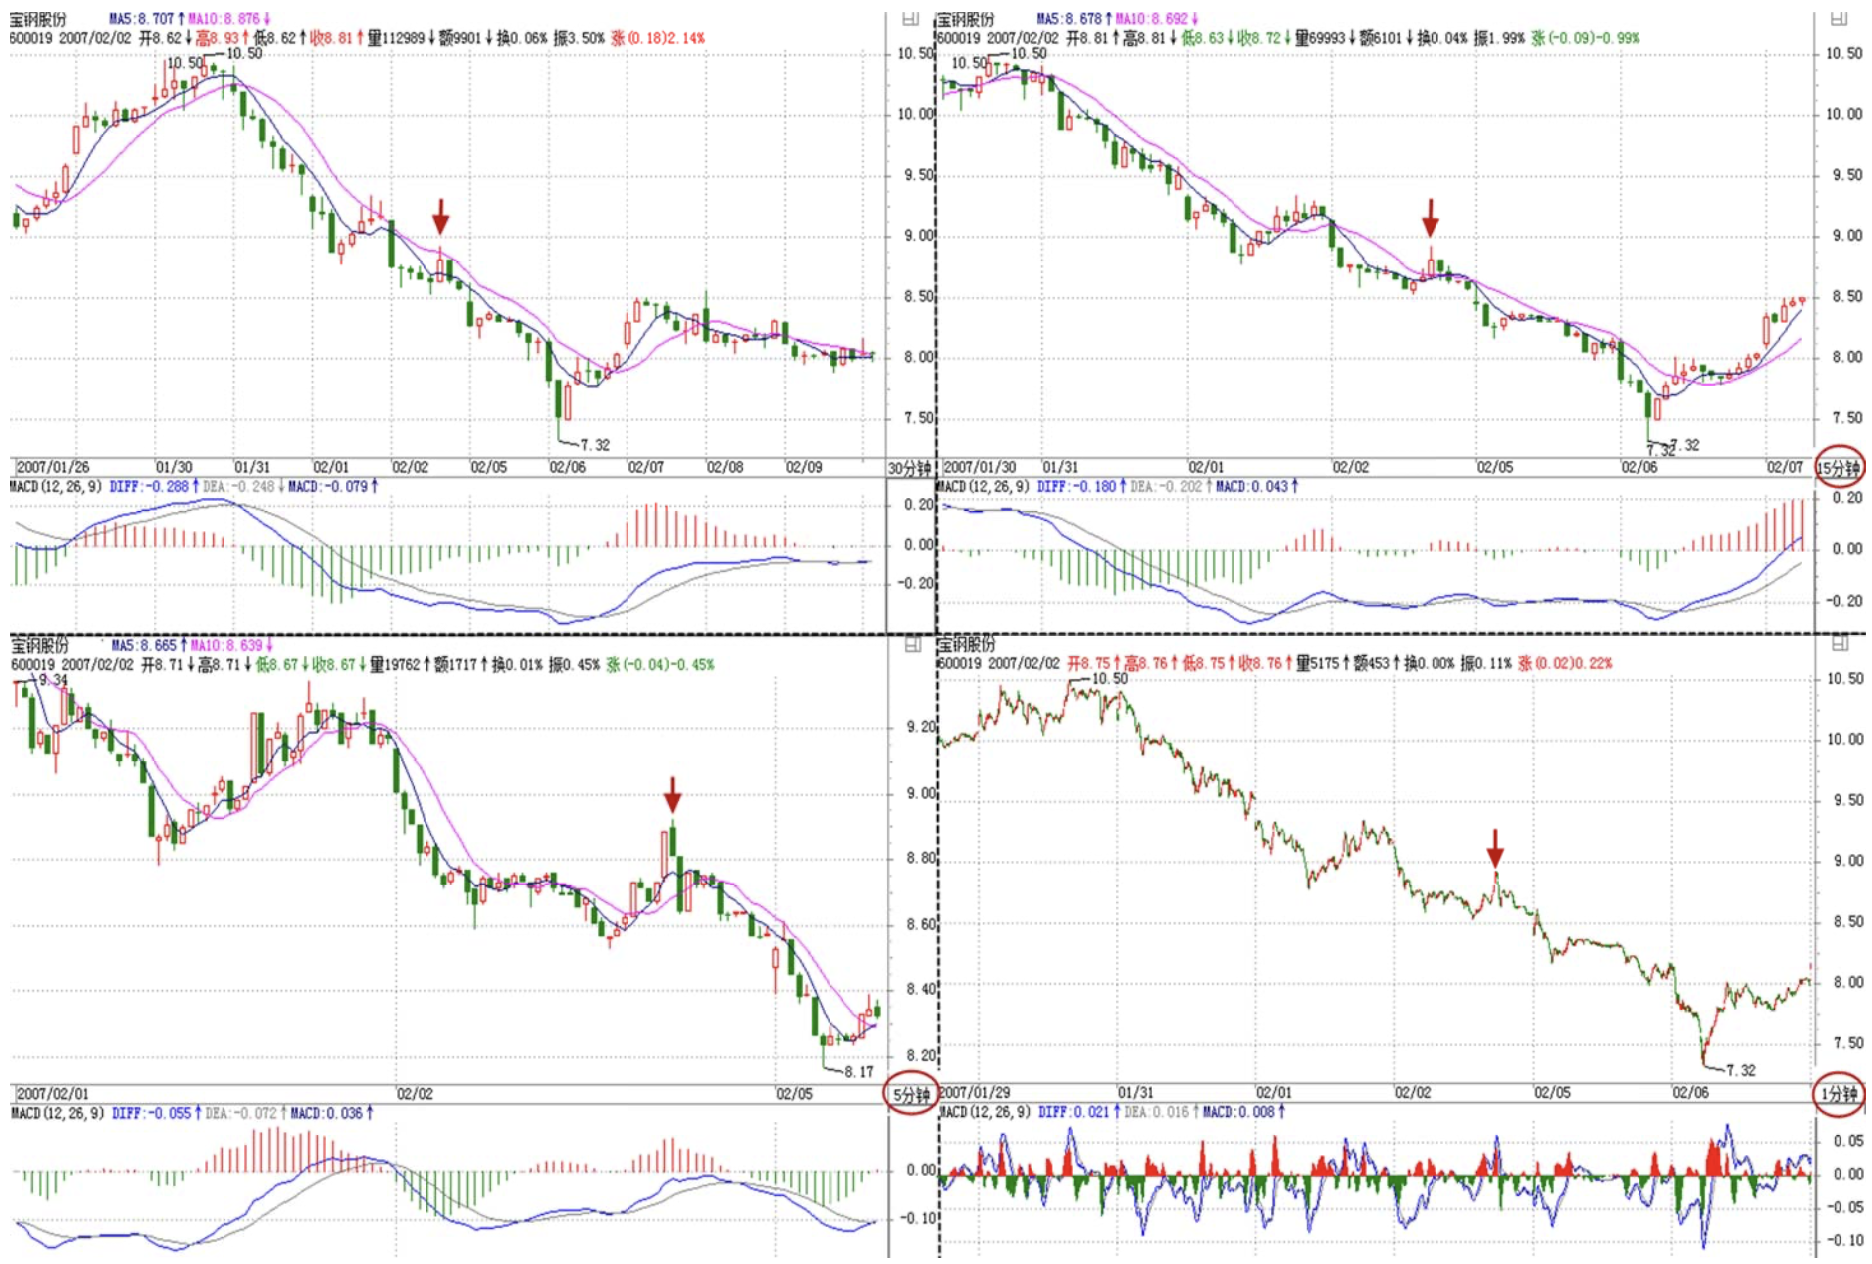
The target was Baosteel. At 2 PM, a clear divergence appeared on the 15-minute K-line. After buying, Baosteel immediately bounced strongly — 2% gain. I then switched to observing lower levels — 5-minute and 1-minute K-lines — for sell points. Although no sell point appeared, the market suddenly weakened and the trend reversed sharply downward (no sell point appeared on either 5-minute or 1-minute K-lines). The 5-minute showed male-on-top entanglement again. Per the poster's instruction, I should strictly follow discipline and exit — at that point I was exactly at breakeven. But being my first real trade, I hesitated for a moment, the trend plunged sharply, -2%, and I firmly exited. Waiting again for the next opportunity.
Conclusion: all trends are uncertain — strictly follow discipline, always use protection.re uncertain — strictly follow discipline, always use protection.
===
Do you know what's wrong with your trade? First, your divergence judgment was incorrect — Baosteel's 15-minute chart had absolutely no divergence, let alone a standard one. The DIF/DEA lines hadn't even pulled back — how could there be divergence? The divergence was a typical 1-minute one. After 3 waves up, it was a perfect sell point — why? Because this sell point must be confirmed by the sub-level, and below 1-minute there's nothing to see, so generally speaking, after 3 waves up you can exit. Moreover, it coincided perfectly with the 250-period 1-minute moving average — the best hedging escape opportunity.
Keep summarizing and keep coming back.
缠中说禅 2007/2/2 16:19:09
[Anonymous] No. 1次实战
2007-02-02 16:18:08
Do you know what's wrong with your trade? First, your divergence judgment was incorrect — Baosteel's 15-minute chart had absolutely no divergence, let alone a standard one. The DIF/DEA lines hadn't even pulled back — how could there be divergence? The divergence was a typical 1-minute one. After 3 waves up, it was a perfect sell point — why? Because this sell point must be confirmed by the sub-level, and below 1-minute there's nothing to see, so generally speaking, after 3 waves up you can exit. Moreover, it coincided perfectly with the 250-period 1-minute moving average — the best hedging escape opportunity.
Keep summarizing and keep coming back.
===
Thank you, poster. My skills are lacking — will keep working hard.skills are lacking — will keep working hard.
==
Note: the sell point forms while prices are rising, not after they've already fallen back. Better to sell too early than too late — especially when hedging.
缠中说禅 2007/2/2 16:22:52
[Anonymous] 糊涂
2007-02-02 16:16:00
Chan sister, hello
600879 (Rocket Co.) today at 10:45 the 15-minute MACD produced divergence, but at 14:30 PM the MACD showed divergence again. How should this situation be judged?
==
Because you haven't graduated elementary school. Look at this standard:
Proficient at differentiating consolidation divergence from trend divergence, and avoiding the transformation of consolidation divergence into third-type buy/sell points — Elementary school graduate
Keep at it.
缠中说禅 2007/2/2 16:27:08
[Anonymous] 小注
2007-02-02 16:19:50
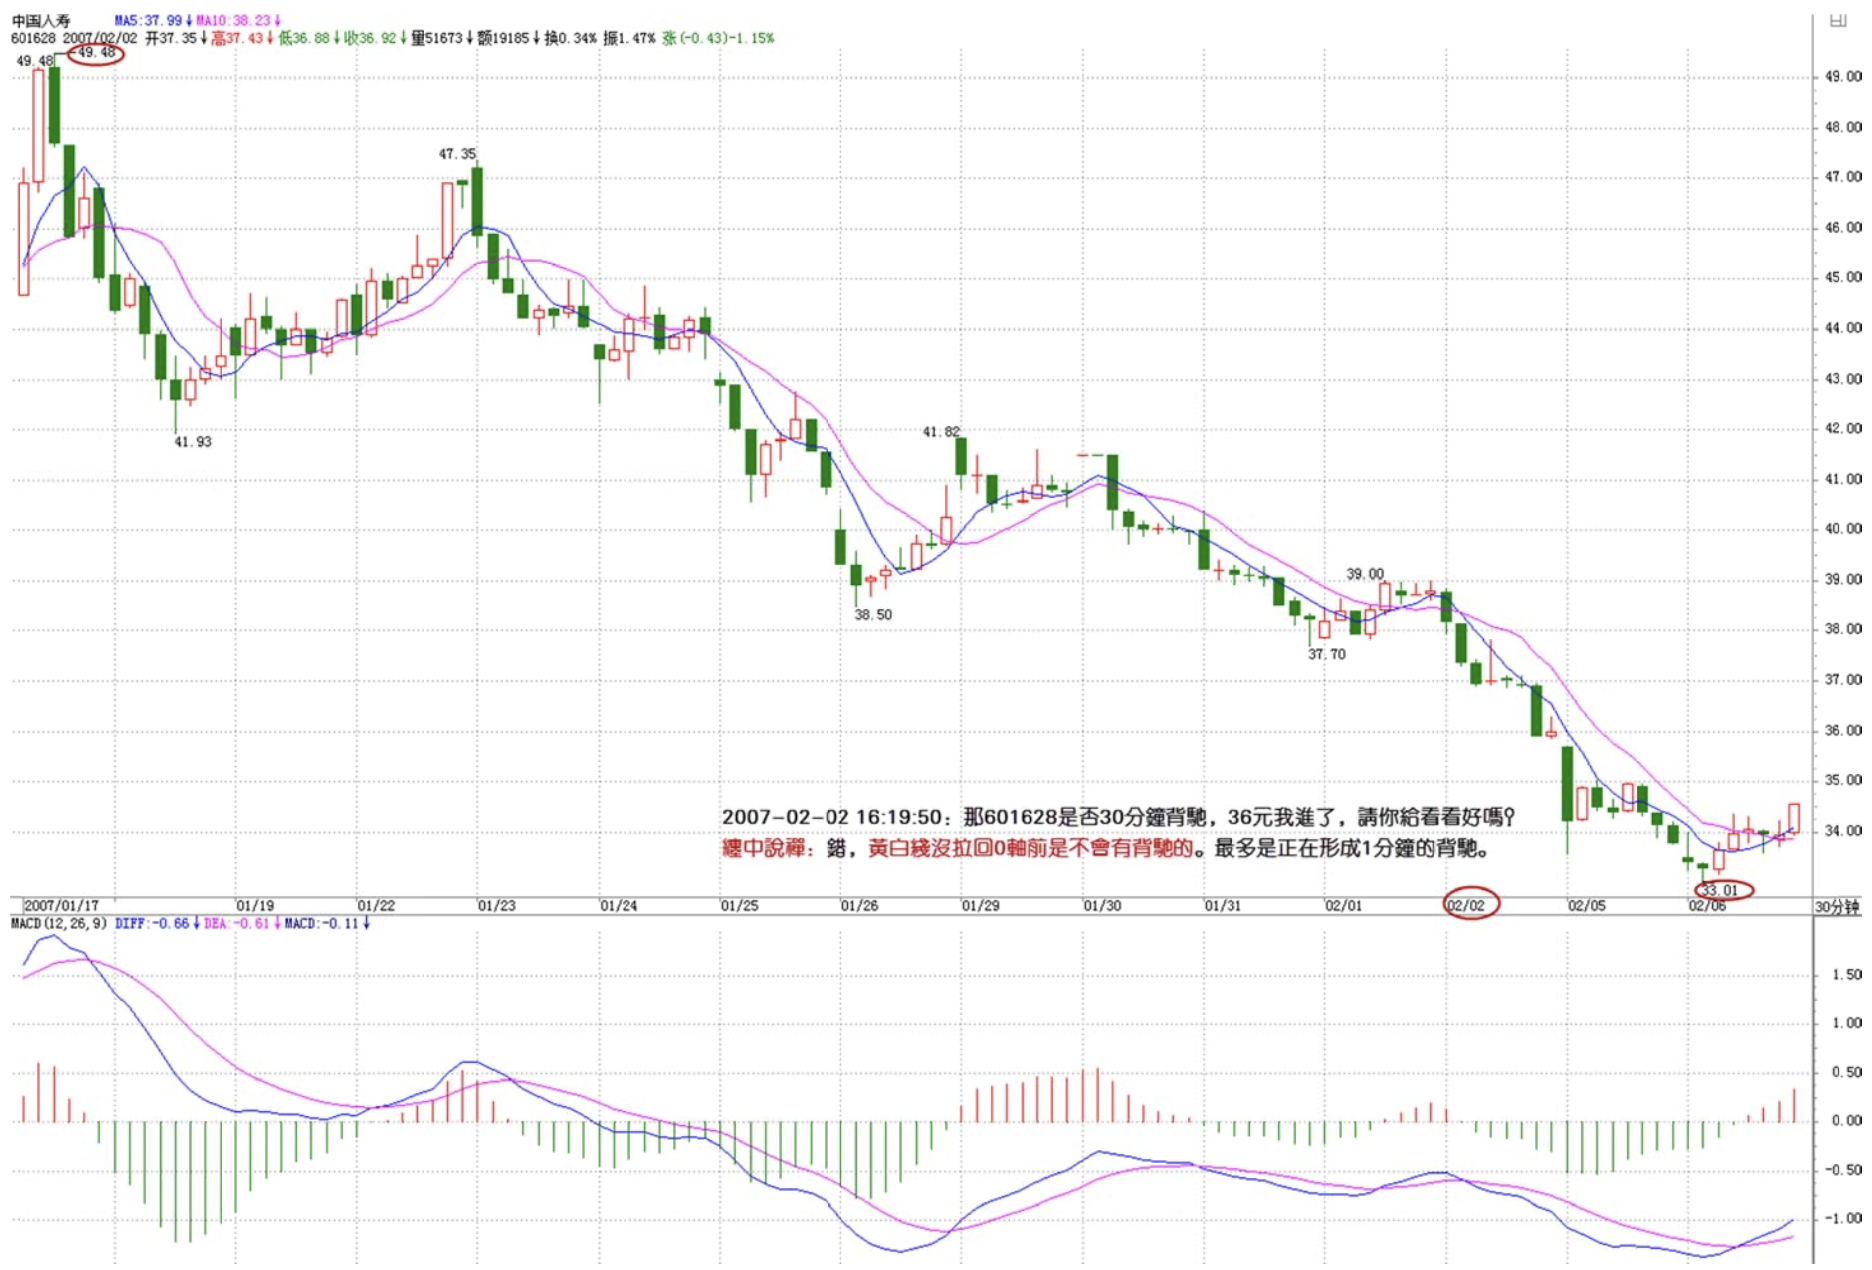
Chan, is 601628 showing 30-minute divergence? I entered at 36 yuan — please take a look for me!
==
Wrong — there can't be divergence until the DIF/DEA lines pull back to the zero axis.
At most, a 1-minute divergence is currently forming.
缠中说禅 2007/2/2 16:30:59
[Anonymous] 缠文观止
2007-02-02 16:26:15
Chan MM, hello. Another question:
The theory feels a bit clearer, but when I look at actual charts, I'm never confident about the level issue.
High and low points filtered by moving averages aren't absolute in level — just for reference.
If I try to derive purely from theory, going layer by layer down, it's very hard to determine the level of high/low points, especially during hub expansion.
Is there a more precise and clear method to determine the level of high/low points or hubs in a trend segment?
==
Very simple — first get one level completely clear before talking about others. Otherwise everything becomes a mess.
缠中说禅 2007/2/2 16:33:19
[Anonymous] 小注
2007-02-02 16:30:02
Master Chan, has 601628 formed a 30-minute divergence?
==
Already answered above — please read carefully.
缠中说禅 2007/2/2 16:34:51
[Anonymous] 乐土
2007-02-02 16:27:57
Master Chan: "avoiding the transformation of consolidation divergence into No. 3 buy/sell points" — I entered China Life Insurance today, not at a No. 1 buy point. Next week I'll look for a No. 3 sell point. Is that okay?
==
There are plenty of first-type buy points — the key is the level. You must have this concept.
Proficient at identifying hubs at all levels — Kindergarten graduate
缠中说禅 2007/2/2 16:37:12
[Anonymous] 惑
2007-02-02 16:34:40
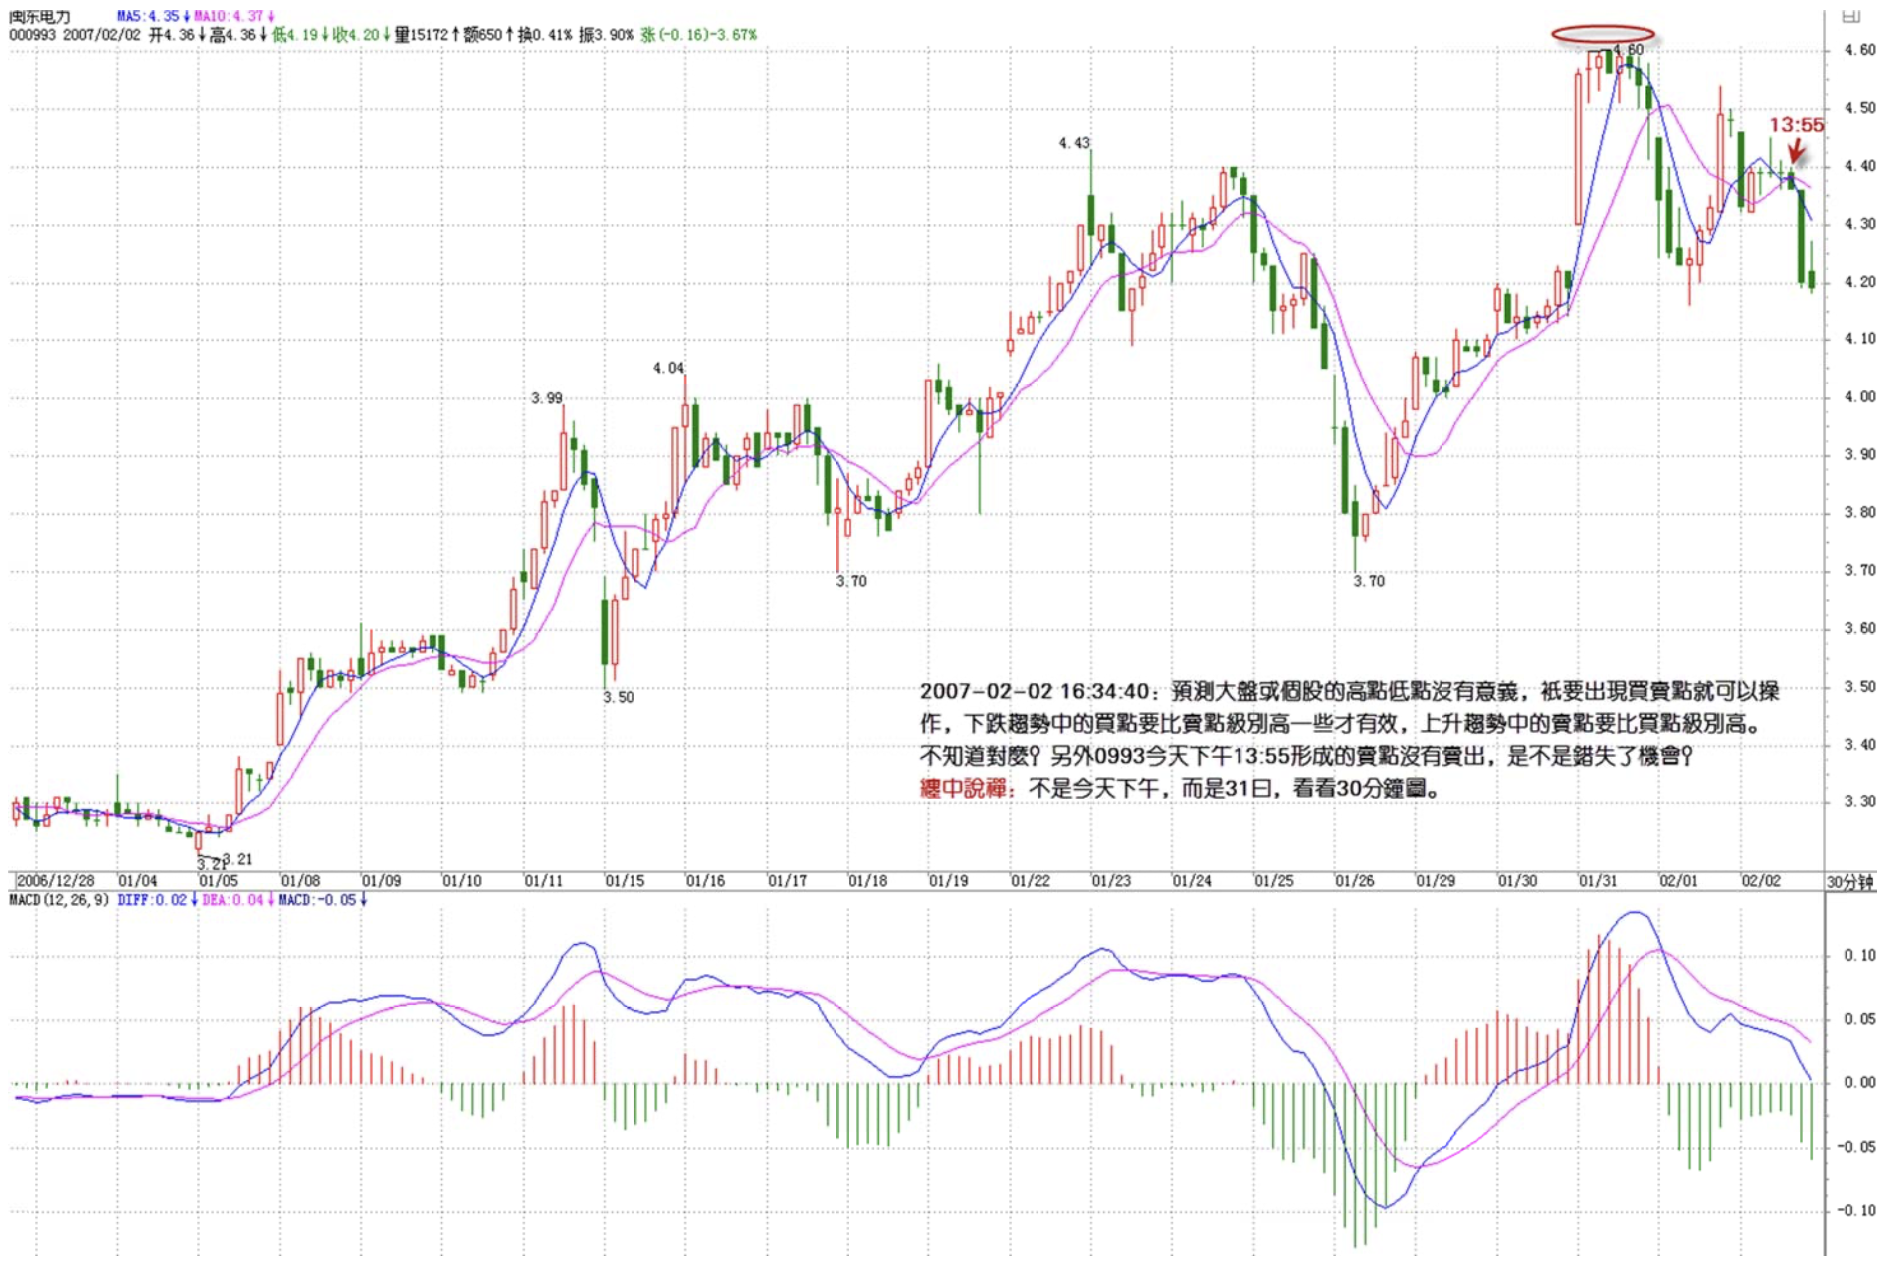
Just started studying, and here's one insight: predicting high and low points for the market or individual stocks has no meaning — you can trade whenever buy/sell points appear. In a downtrend, buy points need to be at a higher level than sell points to be effective; in an uptrend, sell points need to be at a higher level than buy points. Is this right? Also, didn't selling the sell point that formed on 0993 at 13:55 today mean a missed opportunity?
==
It wasn't this afternoon — it was on the 31st. Look at the 30-minute chart.
缠中说禅 2007/2/2 16:40:56
[Anonymous] Little Bird
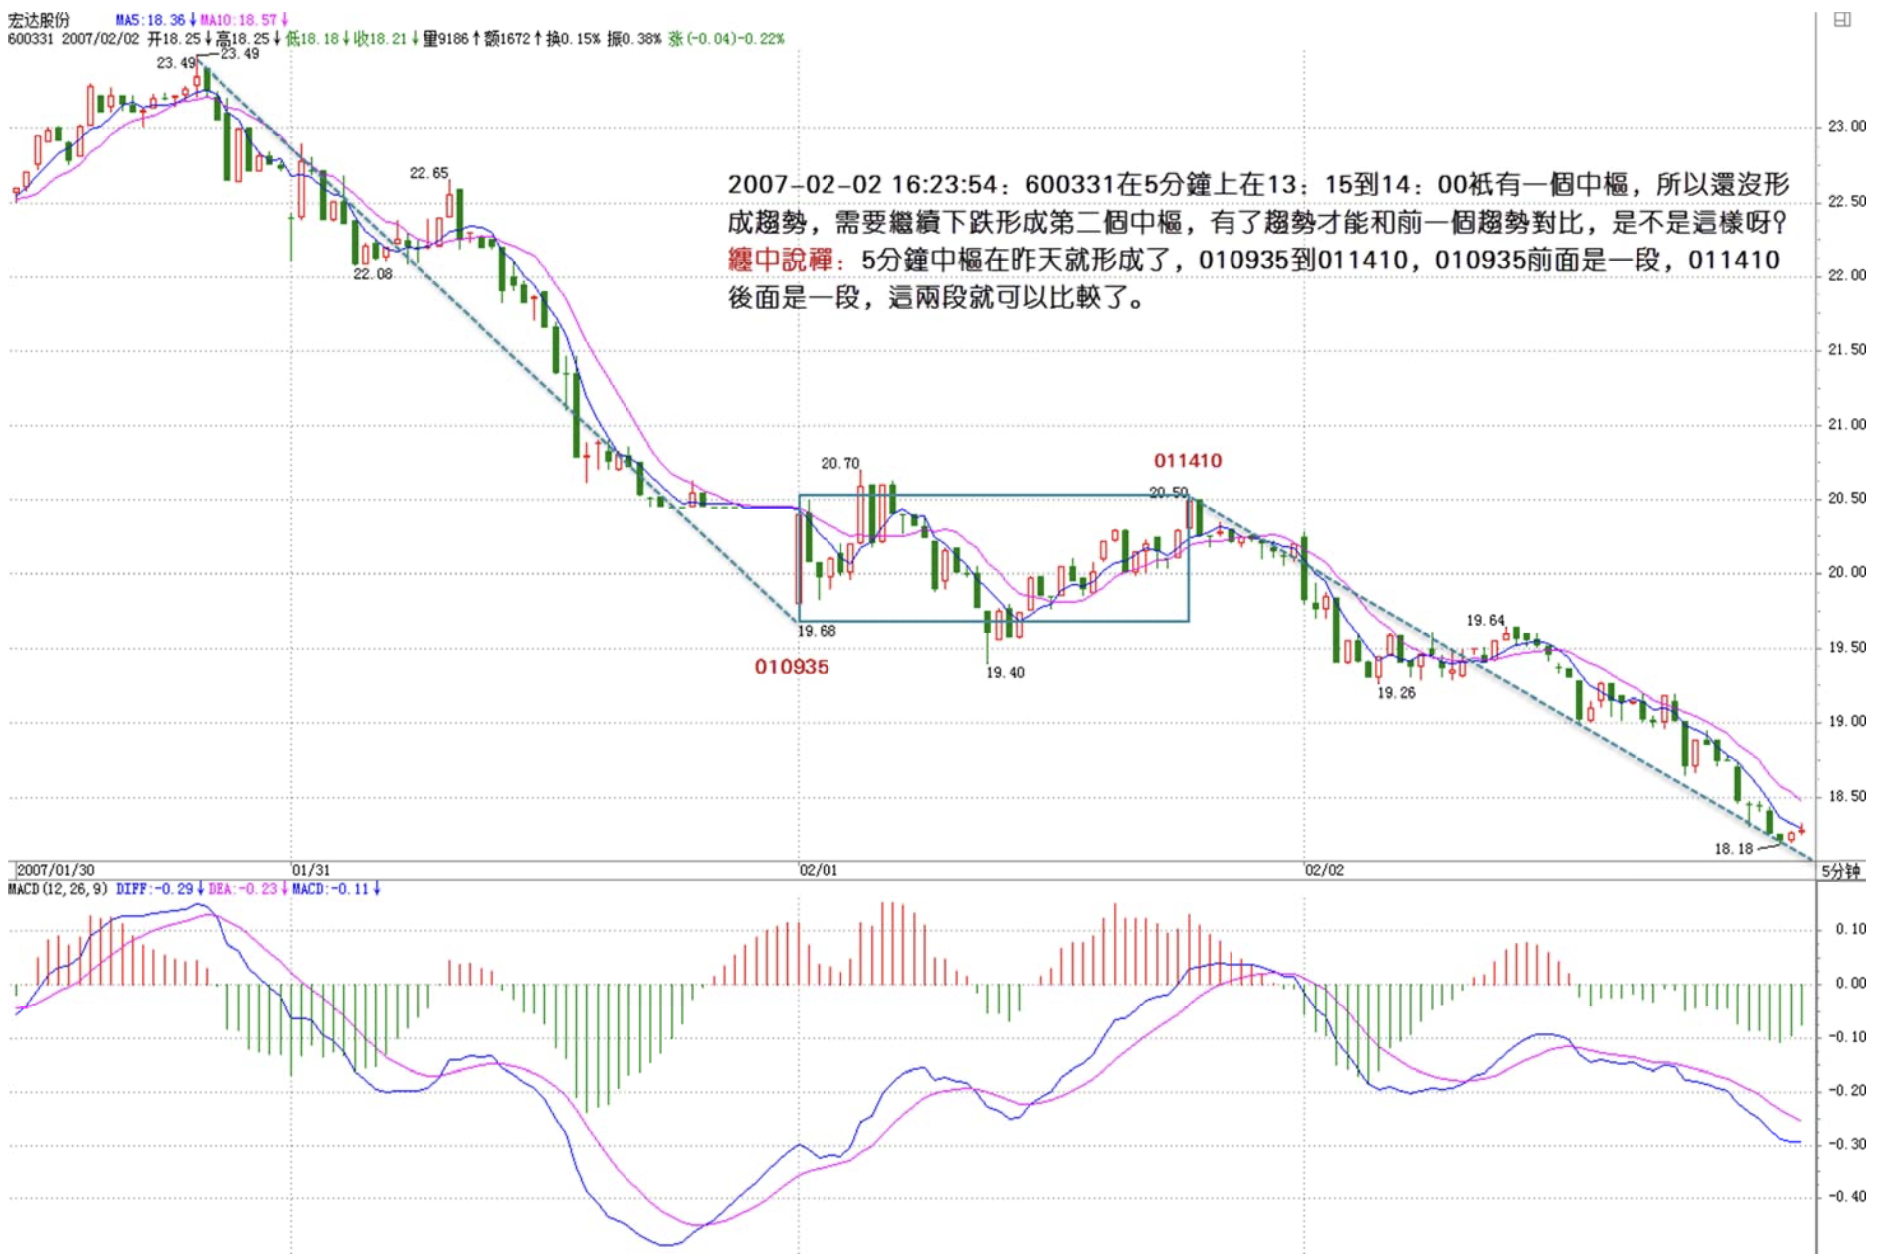
2007-02-02 16:23:54
Let me ask if my understanding is correct?
Sister, on the 5-minute chart, 600331 from 13:15 to 14:00 only has one hub, so a trend hasn't formed yet. It needs to continue dropping to form a No. 2 hub. Only with a trend can you compare it with the previous trend — is that right?
===
The 5-minute hub formed yesterday: 010935 to 011410. Before 010935 is one segment, after 011410 is another — these two segments can be compared.
缠中说禅 2007/2/2 16:43:56
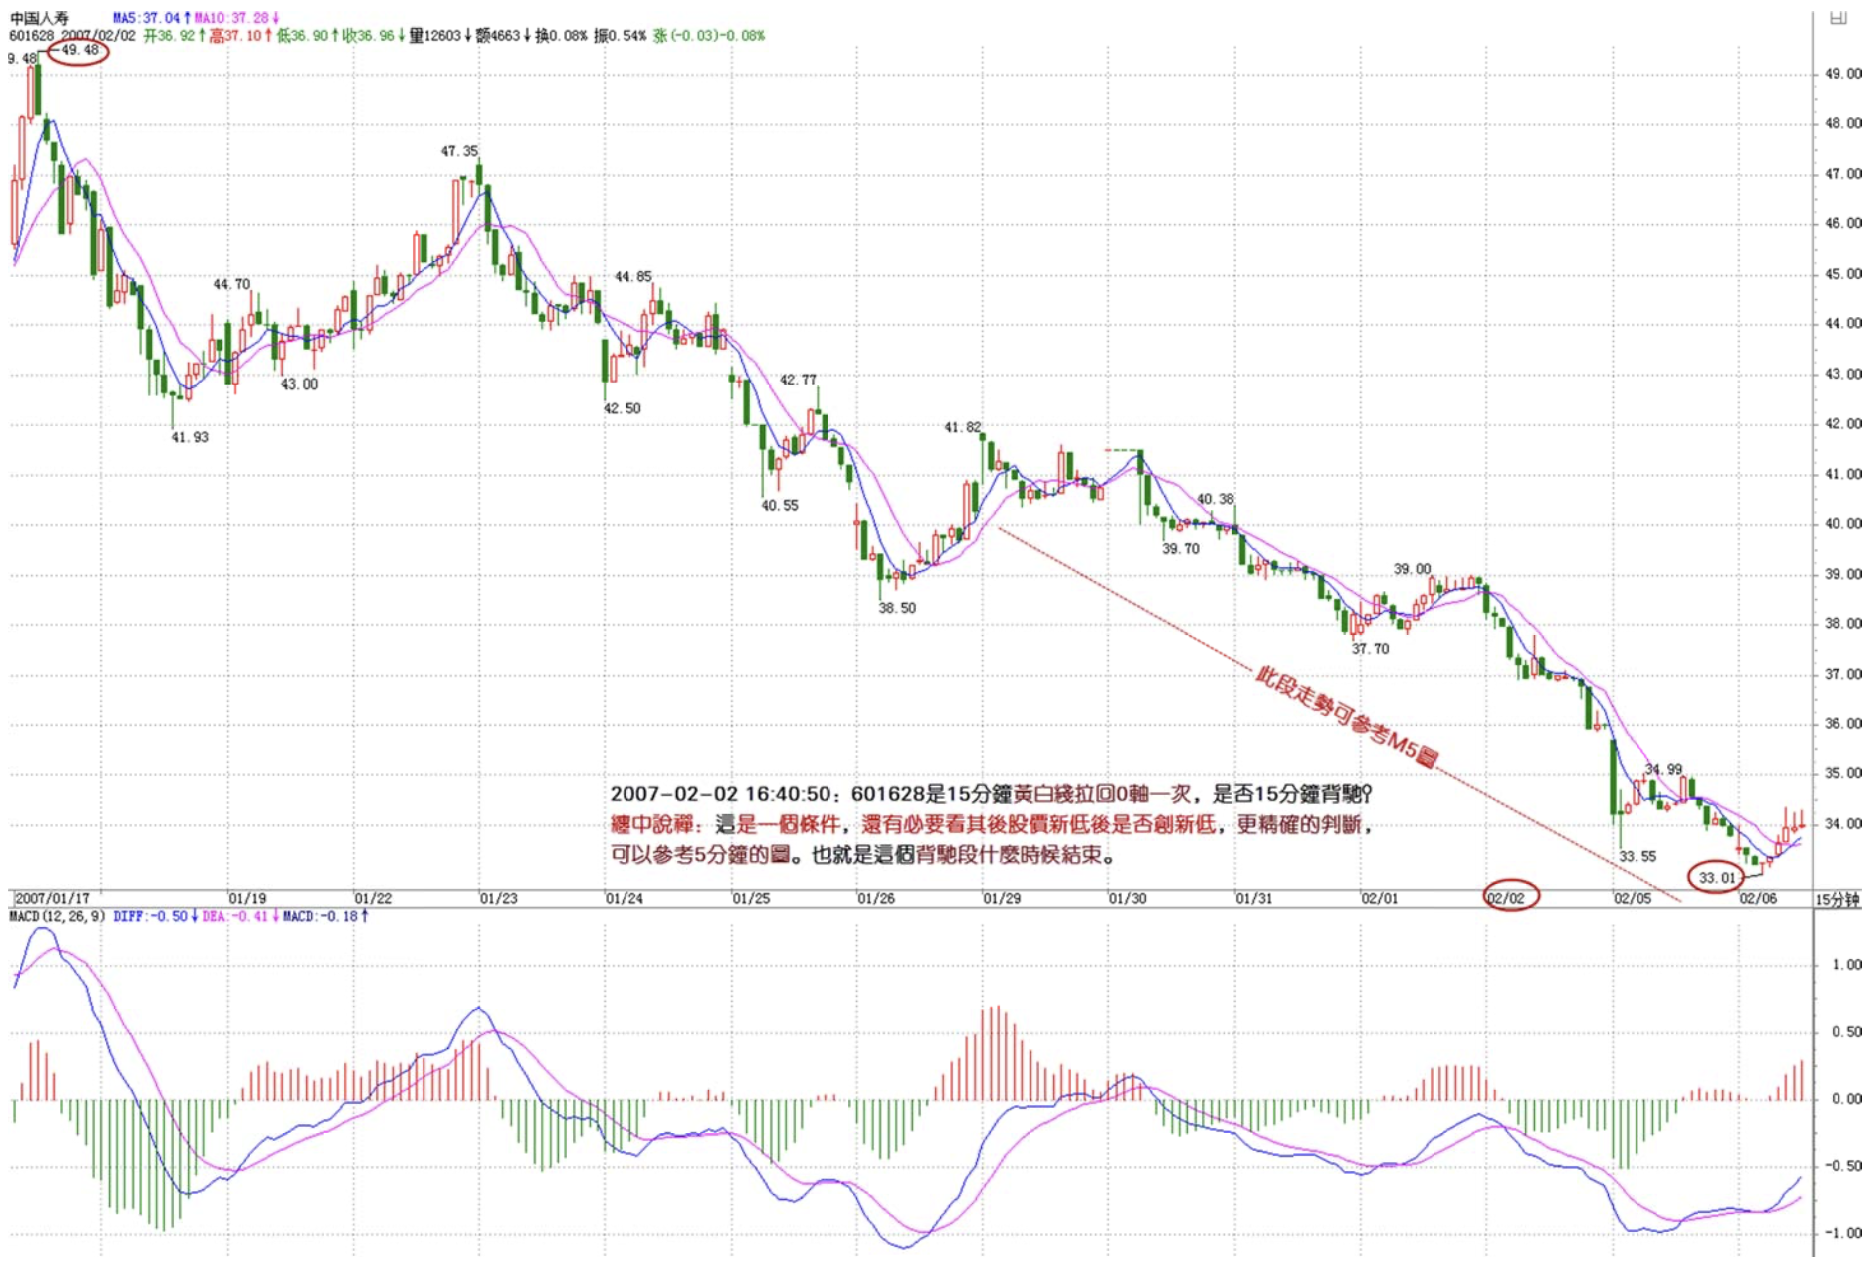
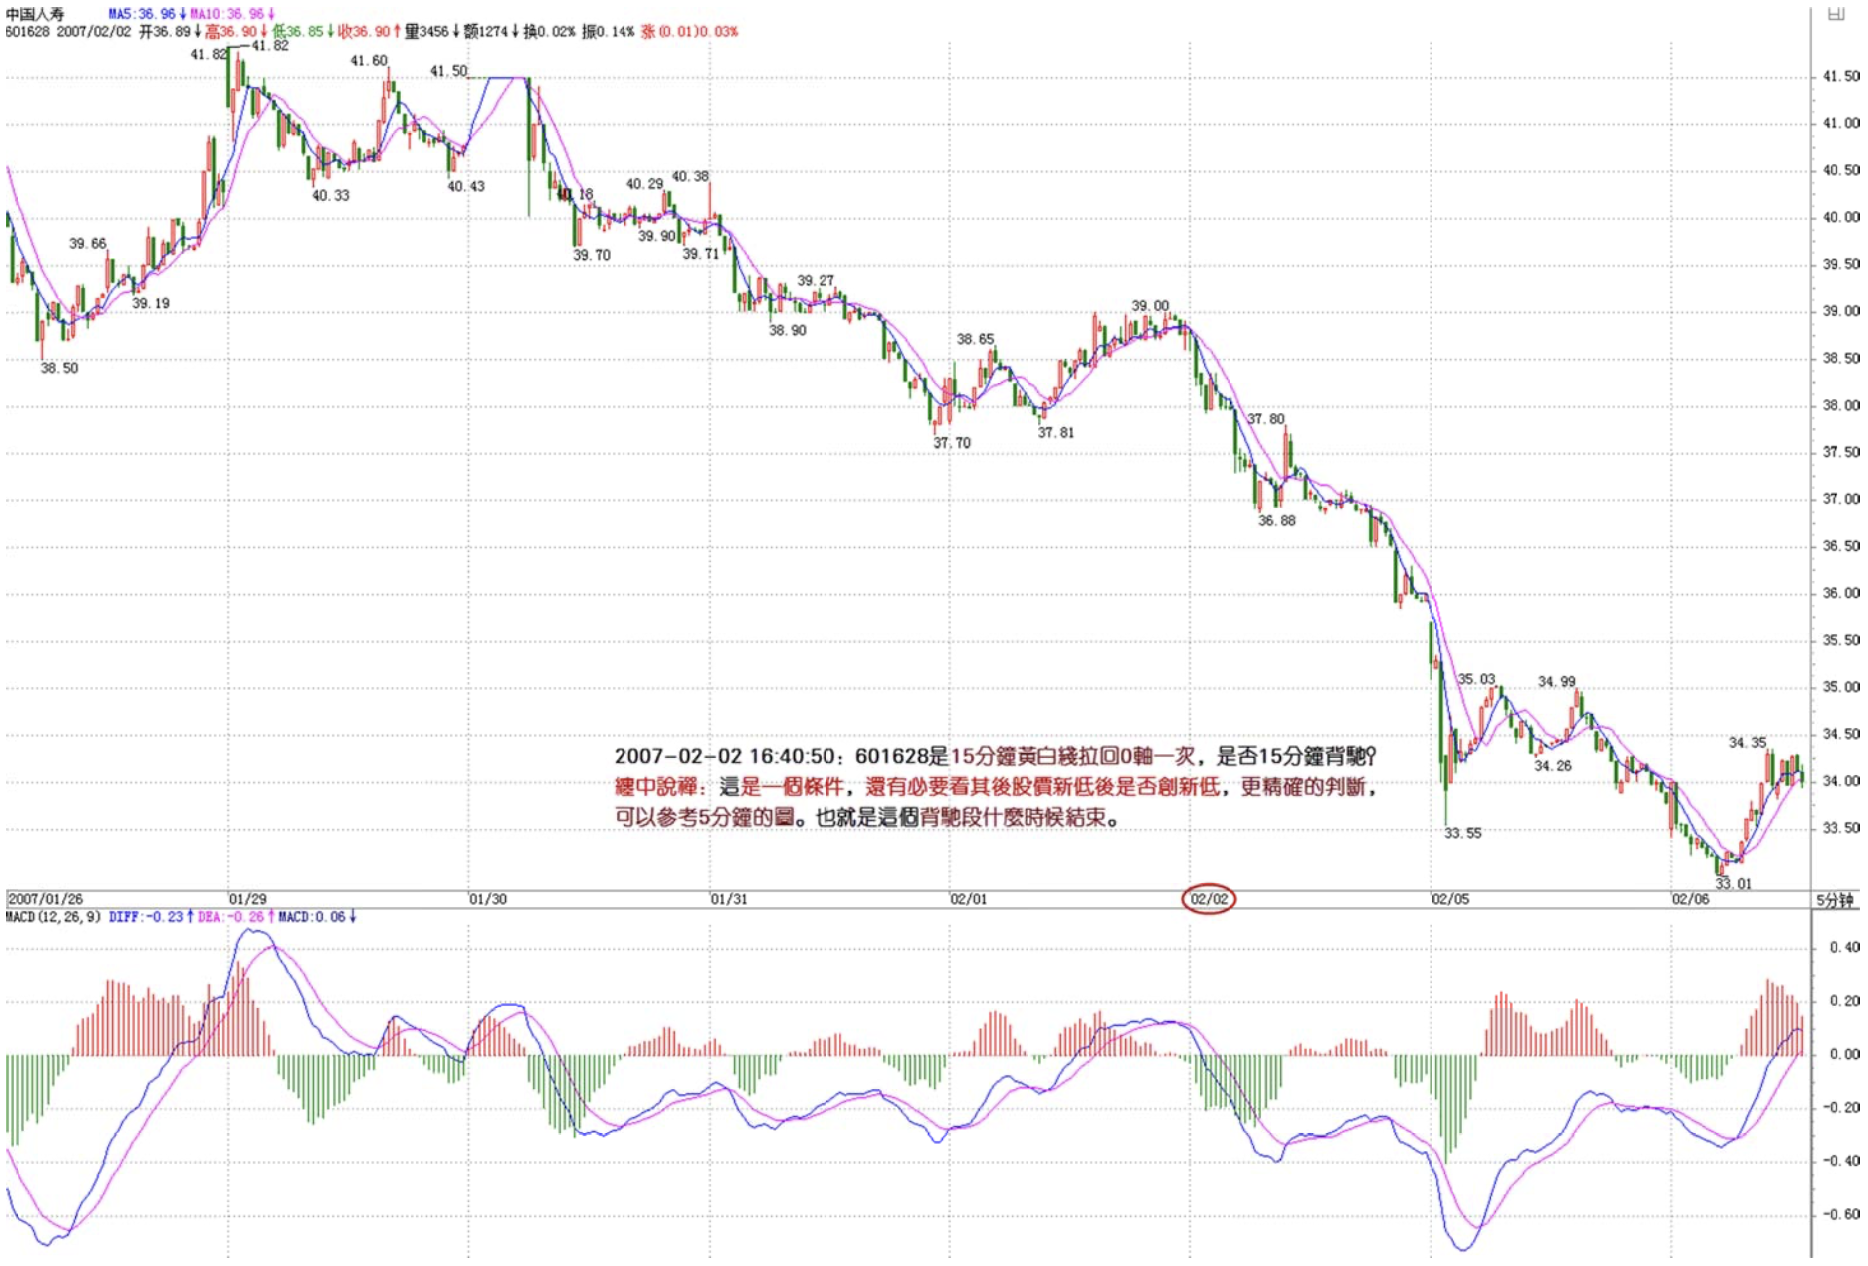
[Anonymous] 小注
2007-02-02 16:40:50
Chan, 601628 — the 15-minute DIF/DEA lines pulled back to the zero axis once! Is this 15-minute divergence?
==
That's one condition. Additionally, you need to see whether the stock price makes a new low without MACD making a new low. For more precise judgment, refer to the 5-minute chart — that is, when this divergence segment ends.
缠中说禅 2007/2/2 16:46:22
[Anonymous] 巴索林
2007-02-02 16:43:38
Poster, please analyze 600316. I'm at 25 yuan cost, severely stuck — what should I do?
==
Find a buy point below to average down — you'll break even quickly.
缠中说禅 2007/2/2 16:49:18
[Anonymous] 清
2007-02-02 16:00:50
First, thank you "this ID" for answering my question from yesterday. Much appreciated.
Today a bunch of my stocks all plummeted — Guoan, Shuijiu, and Guanzi all took a hit. Is "this ID" giving up on Shuijiu?
Since I missed the sell point, I can only ride the roller coaster. Since the bull market will extend further, let me study some technical analysis first.
Some technical questions:
Can divergence be understood as comparing the areas of the two trend segments before and after the DIF/DEA lines pull back to the zero axis, as mapped on MACD? Plus whether the DIF/DEA lines also make new lows (highs)? And whether there are also DIF/DEA pullbacks within the area before the pullback — meaning the DIF/DEA lines entangling around the zero axis multiple times within a short period?
Thanks.. hehe..
===
Didn't this ID say early on that consumer stocks were being rotated out for agriculture, military, etc.? Consumer stocks will make new highs after a medium-term adjustment. You can use the oscillation to bring down costs.
缠中说禅 2007/2/2 16:55:18
It's the weekend. Spend an hour finding yourself — if you can't find yourself, how can you not be pushed around by stocks? Turn stocks around, don't let stocks turn you around.
Signing off first. Music session on Sunday noon. Goodbye.
缠中说禅 2007/2/2 15:19:09
Today's movement was perfectly normal. As said yesterday, the 1-minute divergence wouldn't look the same as last time — if it were all the same, would it still be called price movement? Now, let those so-called technical analysts shout about neckline breakdowns and stop-loss cutting. The market is forever where the wise earn money from the foolish — if they don't cut losses, where does the money come from?
For those following this ID's theory, this kind of movement is the best — easier to make money than in an uptrend. The key is: exit at sell points, enter only when you spot buy points. Next week a 5-minute buy point will appear — catch it and a 10% profit is guaranteed.
The weekly hub is still forming, and this oscillation will continue — it's the perfect training ground for this ID's theory. Practice well — this training ground was built with real money.
As for the individual stocks this ID has mentioned, this ID trades them the same way according to the theory — absolutely not holding without doing anything. That's a fool's approach. Oscillation is what generates profit and brings down costs.