Teaching You to Trade Stocks 79: Auxiliary Operations for Fractals and Further Clarification of Some Issues
2007/9/10 22:37:13
Appendix:
2007-09-10 16:25:02 Dear Chan MM, since I started trying your mindful breathing, within less than a week, I caught a cold and started coughing, which made me quite miserable. Later the cough got better, but these past few days, bumps suddenly appeared all over my body like mosquito bites, red and itchy, and they haven't gone away for days. Could it be that underlying conditions are already being triggered this quickly? I actually spend very little time standing in meditation — I only follow your mindful breathing instructions while lying in bed at noon or in the evening, but I usually fall asleep within a few minutes of persisting. Could there really be results this fast? What should I do next? What should I pay attention to?
==
Everyone's karmic roots are different. These are all preparatory activities that essentially have nothing to do with meditation itself. It's just that modern people are too dirty, both psychologically and physiologically — essentially, modern people are all sick. So these preparatory activities expel some of the filth, clearing the way for what comes later. If you're having reactions and can't handle it psychologically, then pause for now and see a doctor if needed. Having latent illnesses triggered is not a bad thing. If you can handle it psychologically, then just let things be — what's a few sores? Push through them and you'll naturally recover. If you can't persist for even a few minutes, that proves your accumulated karma is extremely heavy, and you need to redouble your efforts. To dissolve accumulated karma, the best approach is to chant the Buddha's name — chanting the Heart Sutra also works. Otherwise, if you just pay lip service to "accumulated karma is inherently empty," then go ahead and take your time emptying it, and see whether it's actually empty or not when the time comes.
First of all, I've discovered that many people are still confused about some of the most basic issues, so I must address them again. Then we'll discuss the auxiliary operations for fractals.
Anyone entering the market shouldn't expect to find some omnipotent treasure to cling to and then get whatever they want. This ID's theory is only one factor among many. The degree to which a person utilizing this ID's theory grasps the theory is another factor. The capital scale and trading timeframe of the person utilizing this ID's theory is yet another factor. The combined force of all these factors together determines your ultimate results when operating with this ID's theory. Everything in the world arises from the convergence of various factors — nothing is the master, nothing is the sole determining force. This must be made absolutely clear.
The second factor varies from person to person and cannot be analyzed; the third factor — capital size and trading time — can be subjected to a degree of categorical analysis.
I. For those who are very busy and have essentially no time to trade, the best option is to buy funds. But this ID has zero confidence in funds, and can say with certainty that funds will inevitably run into major trouble in the foreseeable future — some funds will be liquidated, ultimately severely impacting the market, etc. These are all normal occurrences. Don't plenty of funds die in America every year? Why shouldn't funds die in China too? Securities companies can die, so why can't fund companies die?
However, for funds, one can do regular fixed-amount investments in index funds. This is essentially buying the stock called "China's capital market," and this ID still has confidence in that stock. This way, if the bull market ultimately rises to 30,000 or 40,000 points, at least you won't miss out on the index's gains.
Second, you must invest in growth stocks that have little correlation with the index. Because if you've already invested in index funds, investing in funds that are highly correlated with the index becomes meaningless. Growth stocks often deliver outstanding performance during bear markets or when the index performs poorly — the key is that these growth stocks have sufficient growth potential. The only uncertainty is whether the manager of the fund you buy has sufficient ability to find a stock portfolio with adequate growth potential.
If you're very busy, just use these two approaches to construct a fund portfolio — for example, 60% in index funds and 40% in high-growth stock funds — and don't bother picking individual stocks yourself. The approach is simple: regular fixed-amount investing, investing once a month. For ordinary retail investors, this is the best option — you'll at least capture the average of market fluctuations.
Buying funds essentially means entrusting yourself to others — whether you live or die depends on your luck. Index funds are slightly better though, since the requirements for their managers are relatively low.
II. For retail investors with ample time, if your trading channel is decent, then use the third-type buy point trading method that this ID has mentioned N times before. Here's the method once more:
-
Select a level that provides sufficient response, for example, the 30-minute or 5-minute level, or simply use the daily chart level — this way the number of targets is relatively smaller and less chaotic.
-
Only enter stocks that show a third-type buy point at that level.
-
After buying, once a new sub-level upward movement fails to make a new high or shows consolidation divergence, sell decisively. As long as the level is sufficient, you're guaranteed to profit. After exiting, the stock may develop a new trend after a secondary pullback, but even so, you've saved time, and time equals the opportunity to enter new stocks.
-
If the stock doesn't show the situation in point 3, then it has definitely entered a new round of hub upward shift at that level. You must hold until the upward shift movement shows divergence, then sell at least half. Then, after one sub-level decline (you can add back here, but if there are new stocks, there's no need), on one sub-level rise, if it doesn't make a new high or shows consolidation divergence, you must exit all positions. Note: there's a more aggressive approach — exit entirely once upward shift divergence appears. The prerequisite is that you're particularly confident in your divergence judgments, not a half-baked amateur. The advantage is extremely high time efficiency.
-
Try to only enter at the third-type buy point of the first hub. Because after the second hub, the probability of forming a larger-level hub increases dramatically.
-
With this method, you absolutely must not have emotional attachment to any stock. All stocks are just worthless paper — you're just using this effective method to turn paper into gold. After exiting, the stock may continue with new hub upward shifts after consolidation. Whether to re-enter depends on the position of the higher-level hub — if the continuation could potentially form a third buy/sell point above the higher-level hub, then re-entering is worthwhile; otherwise, forget it. There are beautiful flowers everywhere — go through all of them, and you'll naturally transform from a retail investor into a big retail investor.
III. Big retail investors with relatively large capital — at this point, using all your capital to chase third-type buy points is no longer practical. So you can perform bone-marrow-extraction-style operations on stocks with long-term fundamental value, such as reducing costs and increasing holdings through hub oscillations at various levels. The capital efficiency definitely won't be as high as the second type of retail investor, but different capital sizes naturally require different operating methods.
IV. Specialized hunters — after the training and operations from stage III, when capital has become fairly substantial, you can launch predatory attacks on selected targets. Some people ask, what's the benefit of killing off the market makers? This isn't about whether it's good or not — when capital gets large, and you're not market-making yourself, yet want to quickly improve capital efficiency, the only way is to eat big fish. Eating small fish barely fills the gaps between your teeth — what's the point?
V. Organizing large-scale campaigns — this requires a solid foundation from stage IV, otherwise it simply cannot be done. But with this approach, legal boundaries are sometimes blurred — for example, launching attacks on one or N sectors, what's the relationship between this and market manipulation? Of course, if you're conducting annihilation-style attacks on so-called big crocodiles previously lurking in one or N sectors, then many times, resolving the issue goes beyond just the market itself.
VI. Full-scale warfare — this involves too many aspects. No full-scale war can be resolved solely within the market itself, and moreover, full-scale warfare in capital markets is more often part of broader financial warfare. This is comprehensive, multi-dimensional warfare where the primary considerations are actually no longer about the market itself.
This ID's theory applies to games at every level. Of course, at higher levels, the technical factor becomes increasingly less important, because technical patterns are merely the result of combined forces — and if you have the superior ability to adjust various component forces, then any technical pattern can be manufactured. But note: any manufactured technical pattern, without exception, cannot violate the most fundamental conclusions of this ID's technical theory. Someone might raise the inane question: can't you just make it not diverge at the point of divergence and continue rising? This is nonsensical — no point is "supposed to" diverge. Divergence is the result of combined forces, and if the combined forces ultimately destroy what could have been divergence, that simply proves no divergence occurred at that point — this too is a result of combined forces.
Note: any force, even if able to adjust the result of combined forces itself, absolutely cannot adjust the result of the result of combined forces — unless this is a trade with absolutely no opponents, a one-person transaction.
Now let's distinguish between two diagrams:
......................4
....................../\...................8
...................../..\................../\
..................../....\..........6...../..\.
\0......2........../......\......../\..../....\
.\....../\......../........\....../..\../......\
..\..../..\....../..........\..../....\/........\.....10
...\../....\..../............\../.....7..........\..../\
...1\/......\../..............\/..................\../..\
.............\/................5...................\/....\
.............3......................................9.....\
...........................................................\
............................................................\11
0
.\.........................4
..\......................../\...................8
...\....................../..\................../\.....10
....\..................../....\..........6...../..\..../\
.....\.......2........../......\......../\..../....\../..\
......\....../\......../........\....../..\../......\/....\
.......\..../..\....../..........\..../....\/.......9......\
........\../....\..../............\../.....7................\
........1\/......\../..............\/........................\
..................\/................5.........................\
..................3............................................\
Actually, if you understand the previous lessons, neither of these diagrams should be difficult to distinguish. First, the premise is that there's no other trend preceding either of these — otherwise this kind of analysis is meaningless. If there were preceding trends, there would be many different possible variations.
These diagrams may look very complex, but actually, you just need to find their characteristic sequences. Since both diagrams have a first-type stroke breakthrough at points 3-4, the subsequent characteristic sequence is very clear: 3-4, 5-6, 7-8. Among these, the first two can undergo inclusion relationship processing, so they can be merged into 3-6 (referring to the interval). Therefore, 7-8 clearly forms a bottom fractal with 1-2 and 3-6. After the first-type stroke breakthrough, a standard characteristic sequence fractal extends — this obviously satisfies the standard for line segment destruction. The above analysis applies to both diagrams, so both have at least two line segments.
For the upper diagram, 8-9 clearly belongs to the first-type stroke breakthrough situation, and a characteristic sequence fractal also extends afterward, so the second line segment is also destroyed — making it three line segments in total.
For the lower diagram, since 9-10 has an inclusion relationship with 7-8, the second line segment can be considered as extending to 10. The subsequent 10-11 has only one stroke, so we need to see two more strokes to determine whether it satisfies the basic line segment destruction requirement of the first type continuing to extend into a characteristic sequence fractal. Therefore, this diagram is incomplete. If 9 falls below 7 while 10's position remains unchanged, then it obviously becomes three line segments.
The division of line segments is actually not difficult at all — the key is to proceed from the concepts.
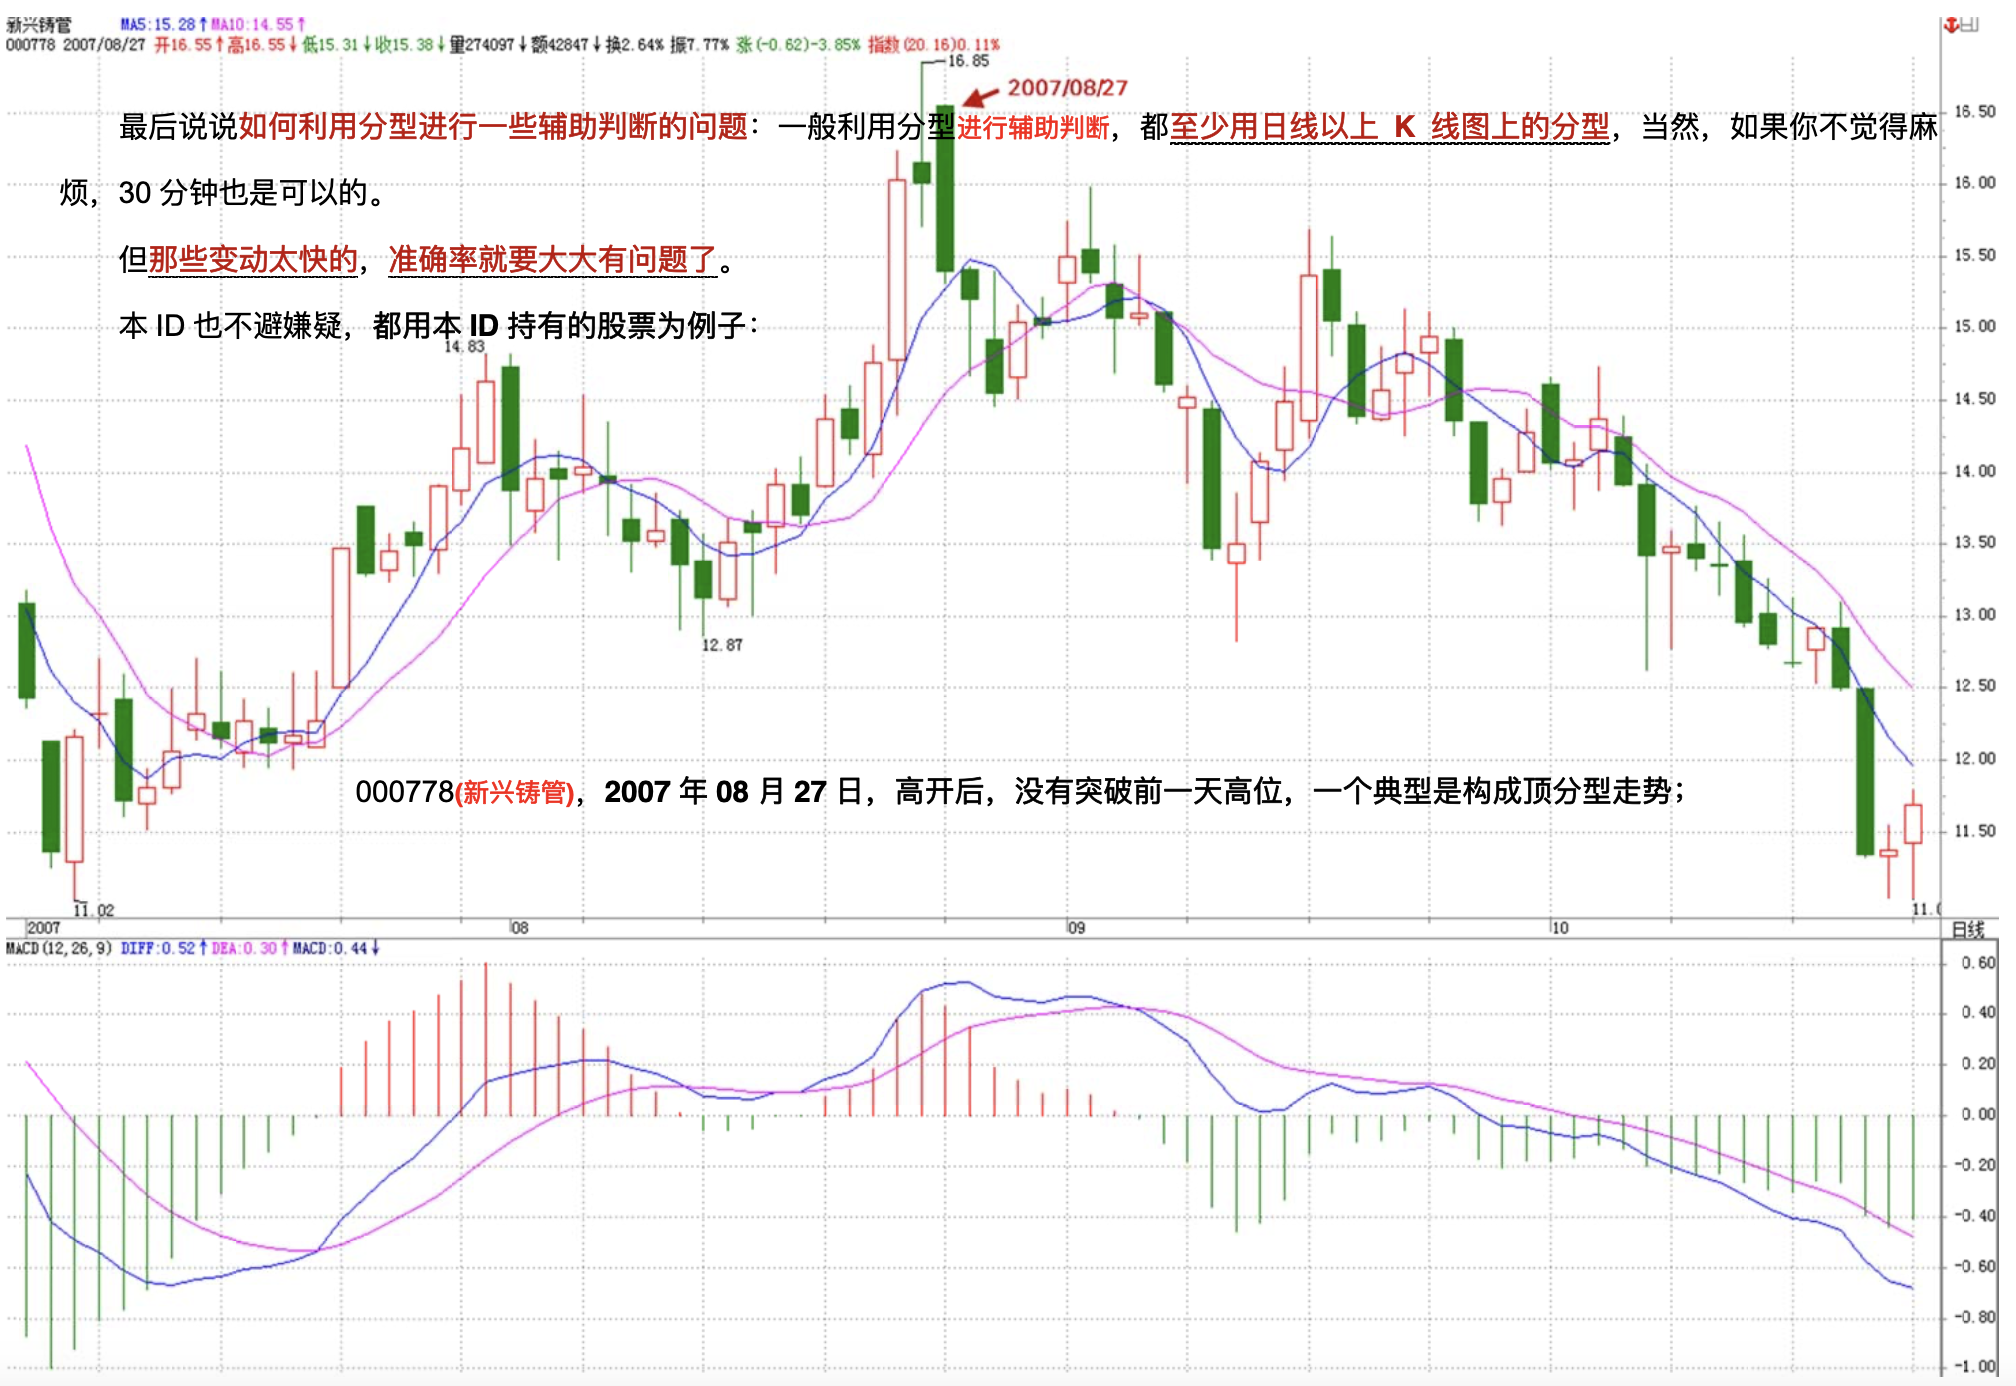
Finally, let's discuss how to use fractals for auxiliary judgment. Generally, you should use at least daily or higher-level K-line chart fractals. Of course, if you don't mind the trouble, 30-minute charts work too. But for those that change too rapidly, the accuracy becomes highly questionable.
This ID won't avoid suspicion either — let's use stocks that this ID holds as examples:
000778, August 27, 2007 — after opening high, it failed to break through the previous day's high, a textbook case of forming a top fractal pattern;
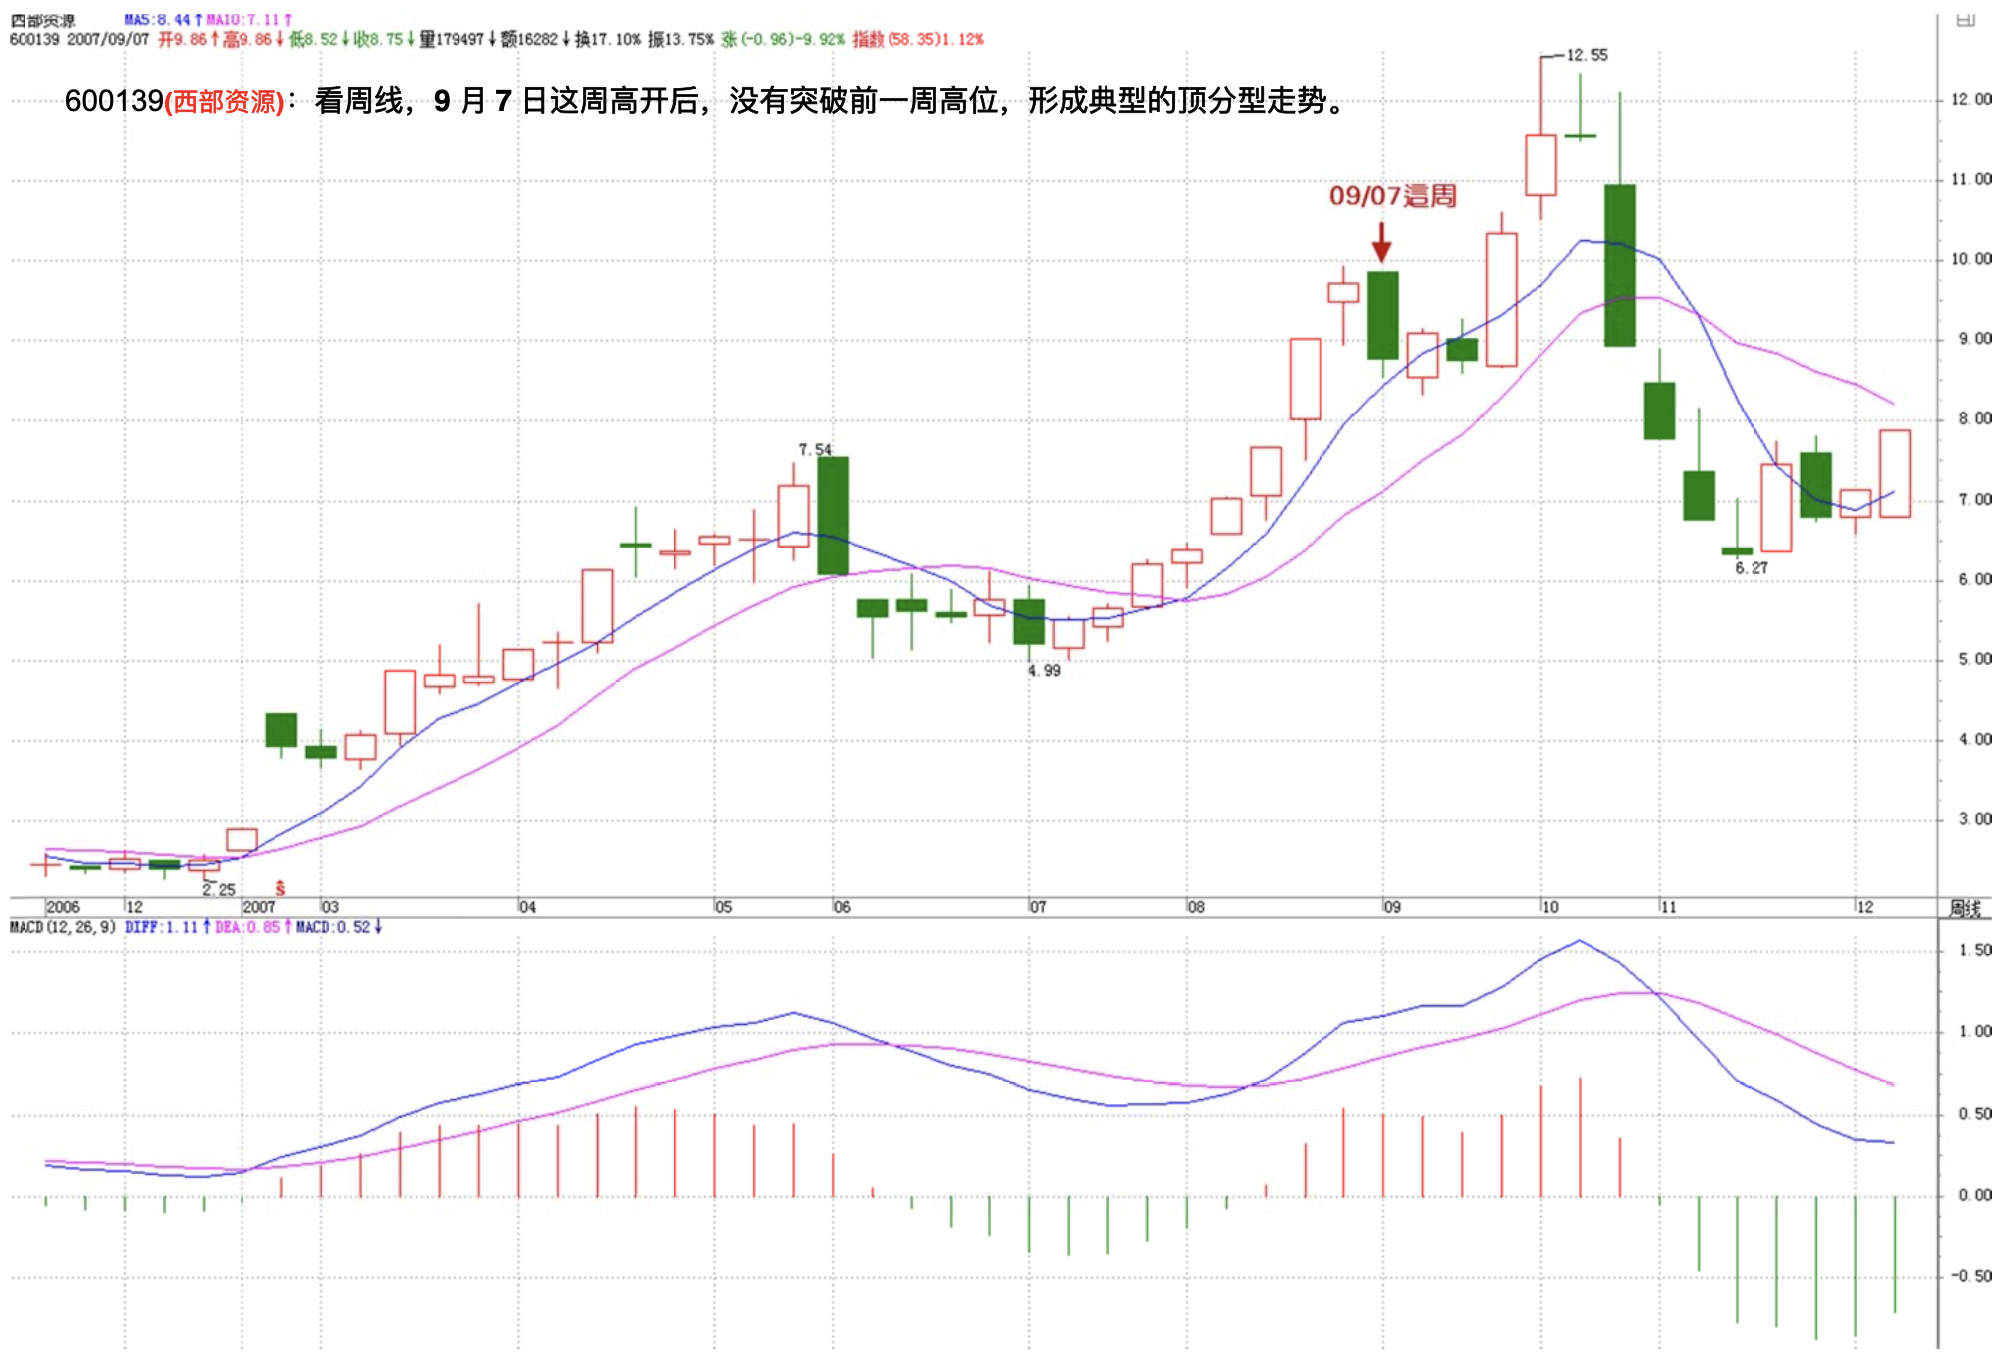
600139: Look at the weekly chart — the week of September 7 opened high but failed to break through the previous week's high, forming a textbook top fractal pattern.
600737: Look at the daily chart — this one is more complex, involving so-called inclusion relationships. September 4, 5, and 6 of 2007 show a textbook inclusion relationship, then on the 7th, it breaks the inclusion relationship but fails to create a new high above 14.28 yuan — a textbook top fractal structure.
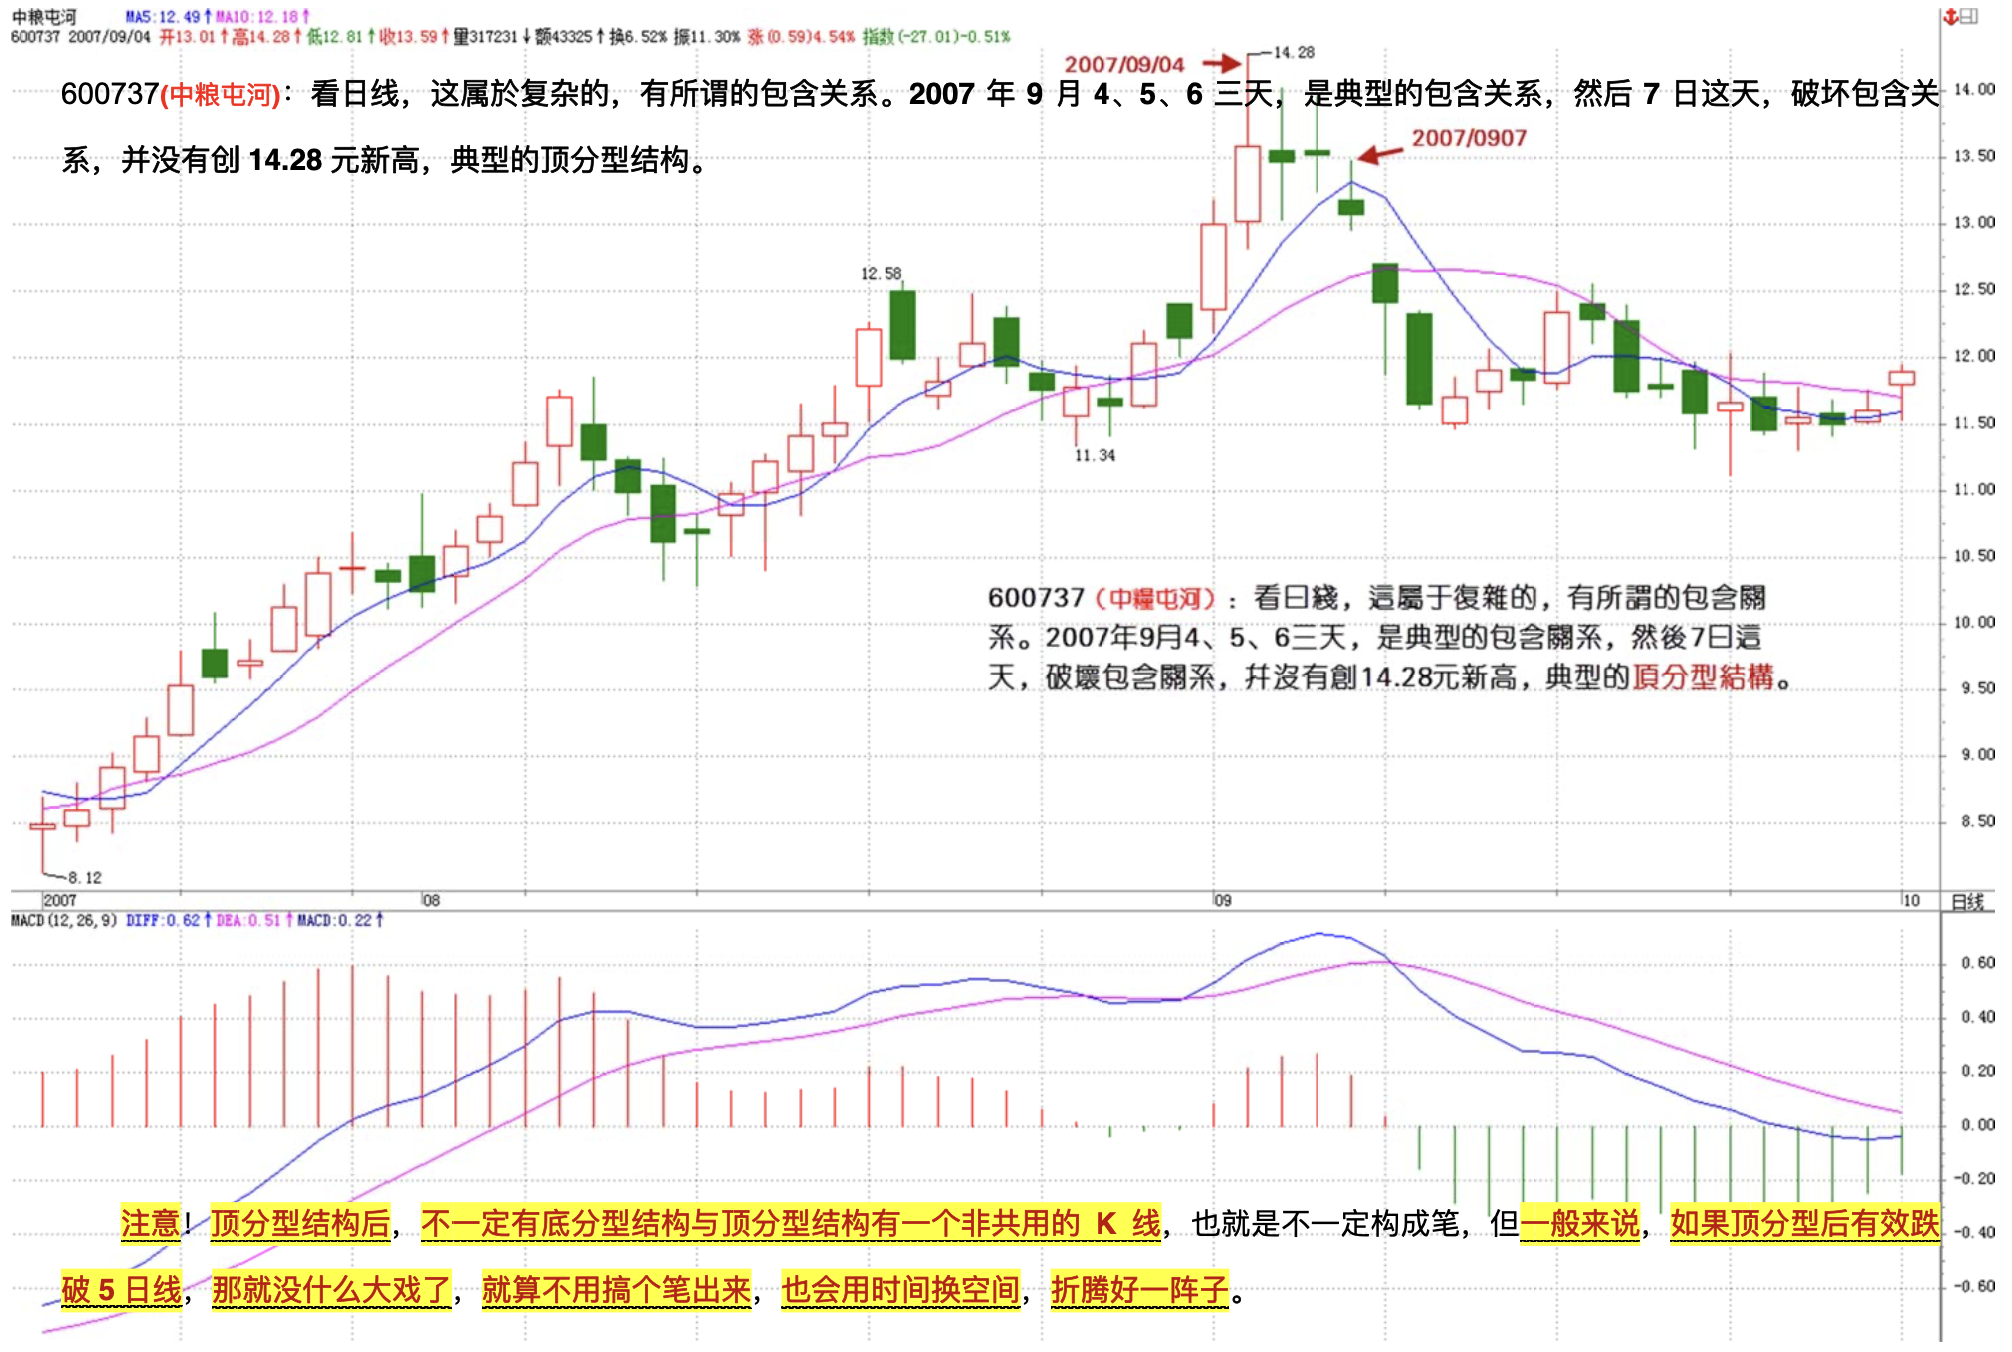
Note: after a top fractal structure forms, a bottom fractal structure that has a non-shared K-line with the top fractal doesn't necessarily follow — meaning it doesn't necessarily form a stroke. But generally speaking, if the price effectively breaks below the 5-day moving average after a top fractal, then there's not much action left — even if a full stroke doesn't form, the market will use time to exchange for space, oscillating for quite a while.
000802, daily chart, August 9, 2007 — forms a textbook top fractal structure. Afterward, no stroke forms, but the price oscillates several times around the 5-day moving average, causing several moving averages to kiss together, before excitement resumes.
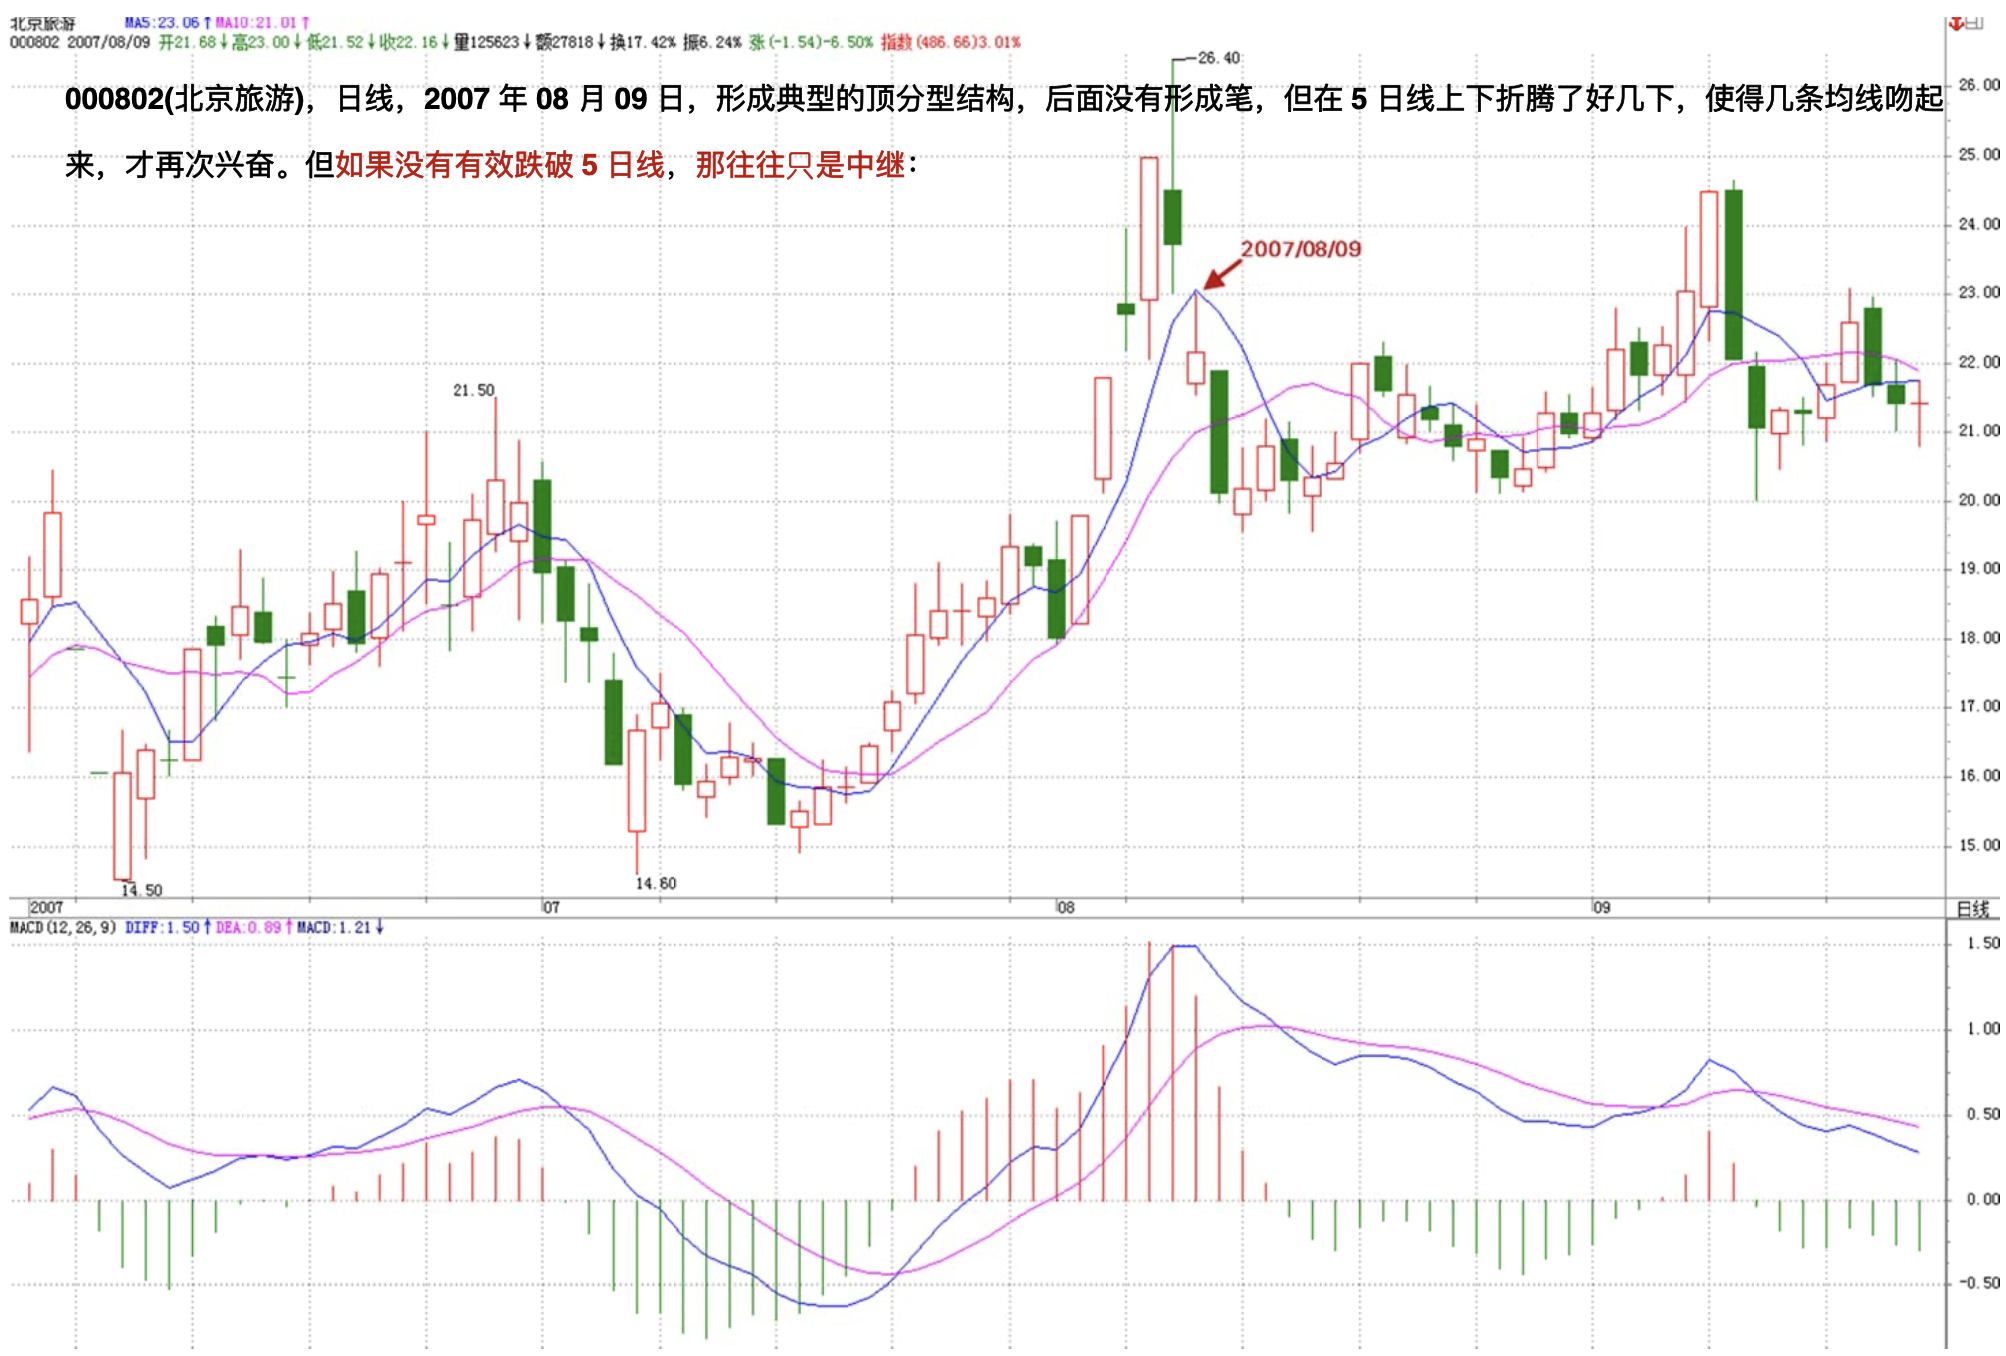
But if the price doesn't effectively break below the 5-day moving average, it's often just a continuation:
000938, September 4, 2007 forms a top fractal, then after a false breakdown of the 5-day moving average, continues attacking upward.
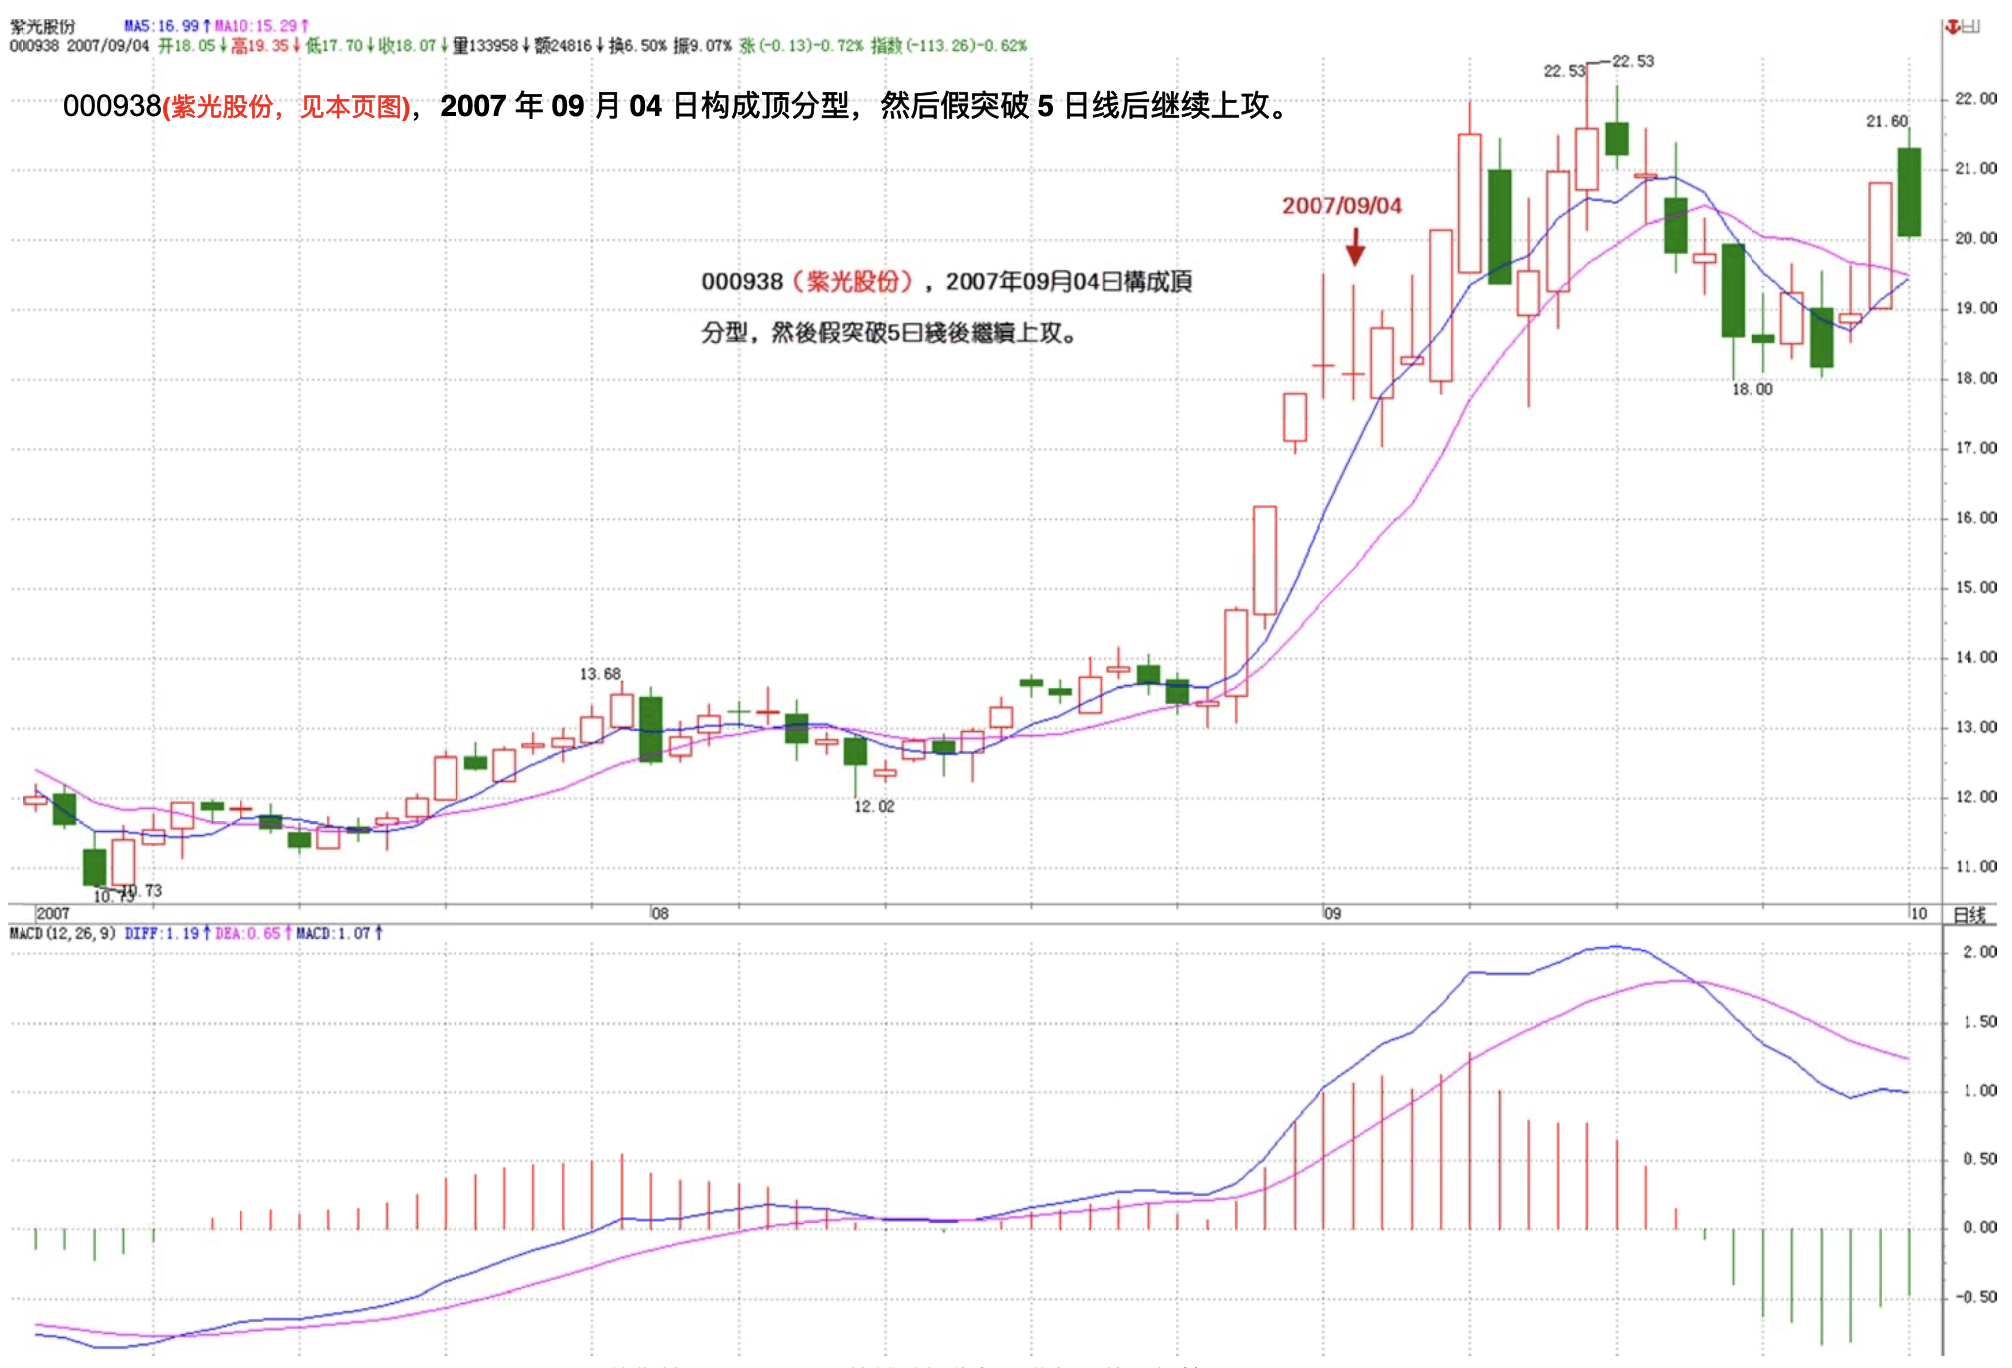
Note: when using top fractals for operations, you must coordinate with smaller-level charts. Essentially, fractals all emerge after a first or second buy/sell point is established at some smaller level. Speaking in terms of sell points: if after the second sell point, the sub-level decline doesn't form consolidation divergence, then the adjustment's magnitude is certainly large. If the time extends, a stroke forms — especially downward strokes on the daily chart, which all result from fairly long periods of significant adjustment — they will definitely effectively break the 5-day moving average. If the second sell point's sub-level decline does form consolidation divergence, then the adjustment at most evolves into a larger-level oscillation, its magnitude is limited, and generally the 5-day moving average won't be effectively broken.
Using the above properties, you essentially don't need to wait until the top fractal is fully formed before operating. For example, with 000938, on September 4, you don't need to wait until the close — when it surges up and you see a small-level sell point forming below the previous day's high, you can decisively sell. Then as it drops and forms the top fractal, wait for a break below the 5-day moving average and see if a small-level consolidation divergence appears. Once it appears, you buy back — hence the September 5 price action, which essentially captures a 10%+ short-term spread.
Note: the operational difficulties are:
First, you must coordinate with the small-level second buy/sell points. If you can't read the small level, and merely look at whether today's surge fails to break the previous day's high or today's decline fails to break the previous day's low, the operating results won't be great.
Second, you must leverage consolidation divergence effectively — this way you won't miss the buyback. Or in the case of non-consolidation divergence, you won't buy back too early. Generally speaking, for non-consolidation divergence situations, you must wait for divergence to appear before buying back. The buy point situation is simply the reverse.
Note: the correspondence between large-level fractals and small-level first/second buy/sell points is not absolute — having the former necessarily means the latter exists, but having the latter doesn't necessarily mean the former exists. So the former is merely an auxiliary tool.
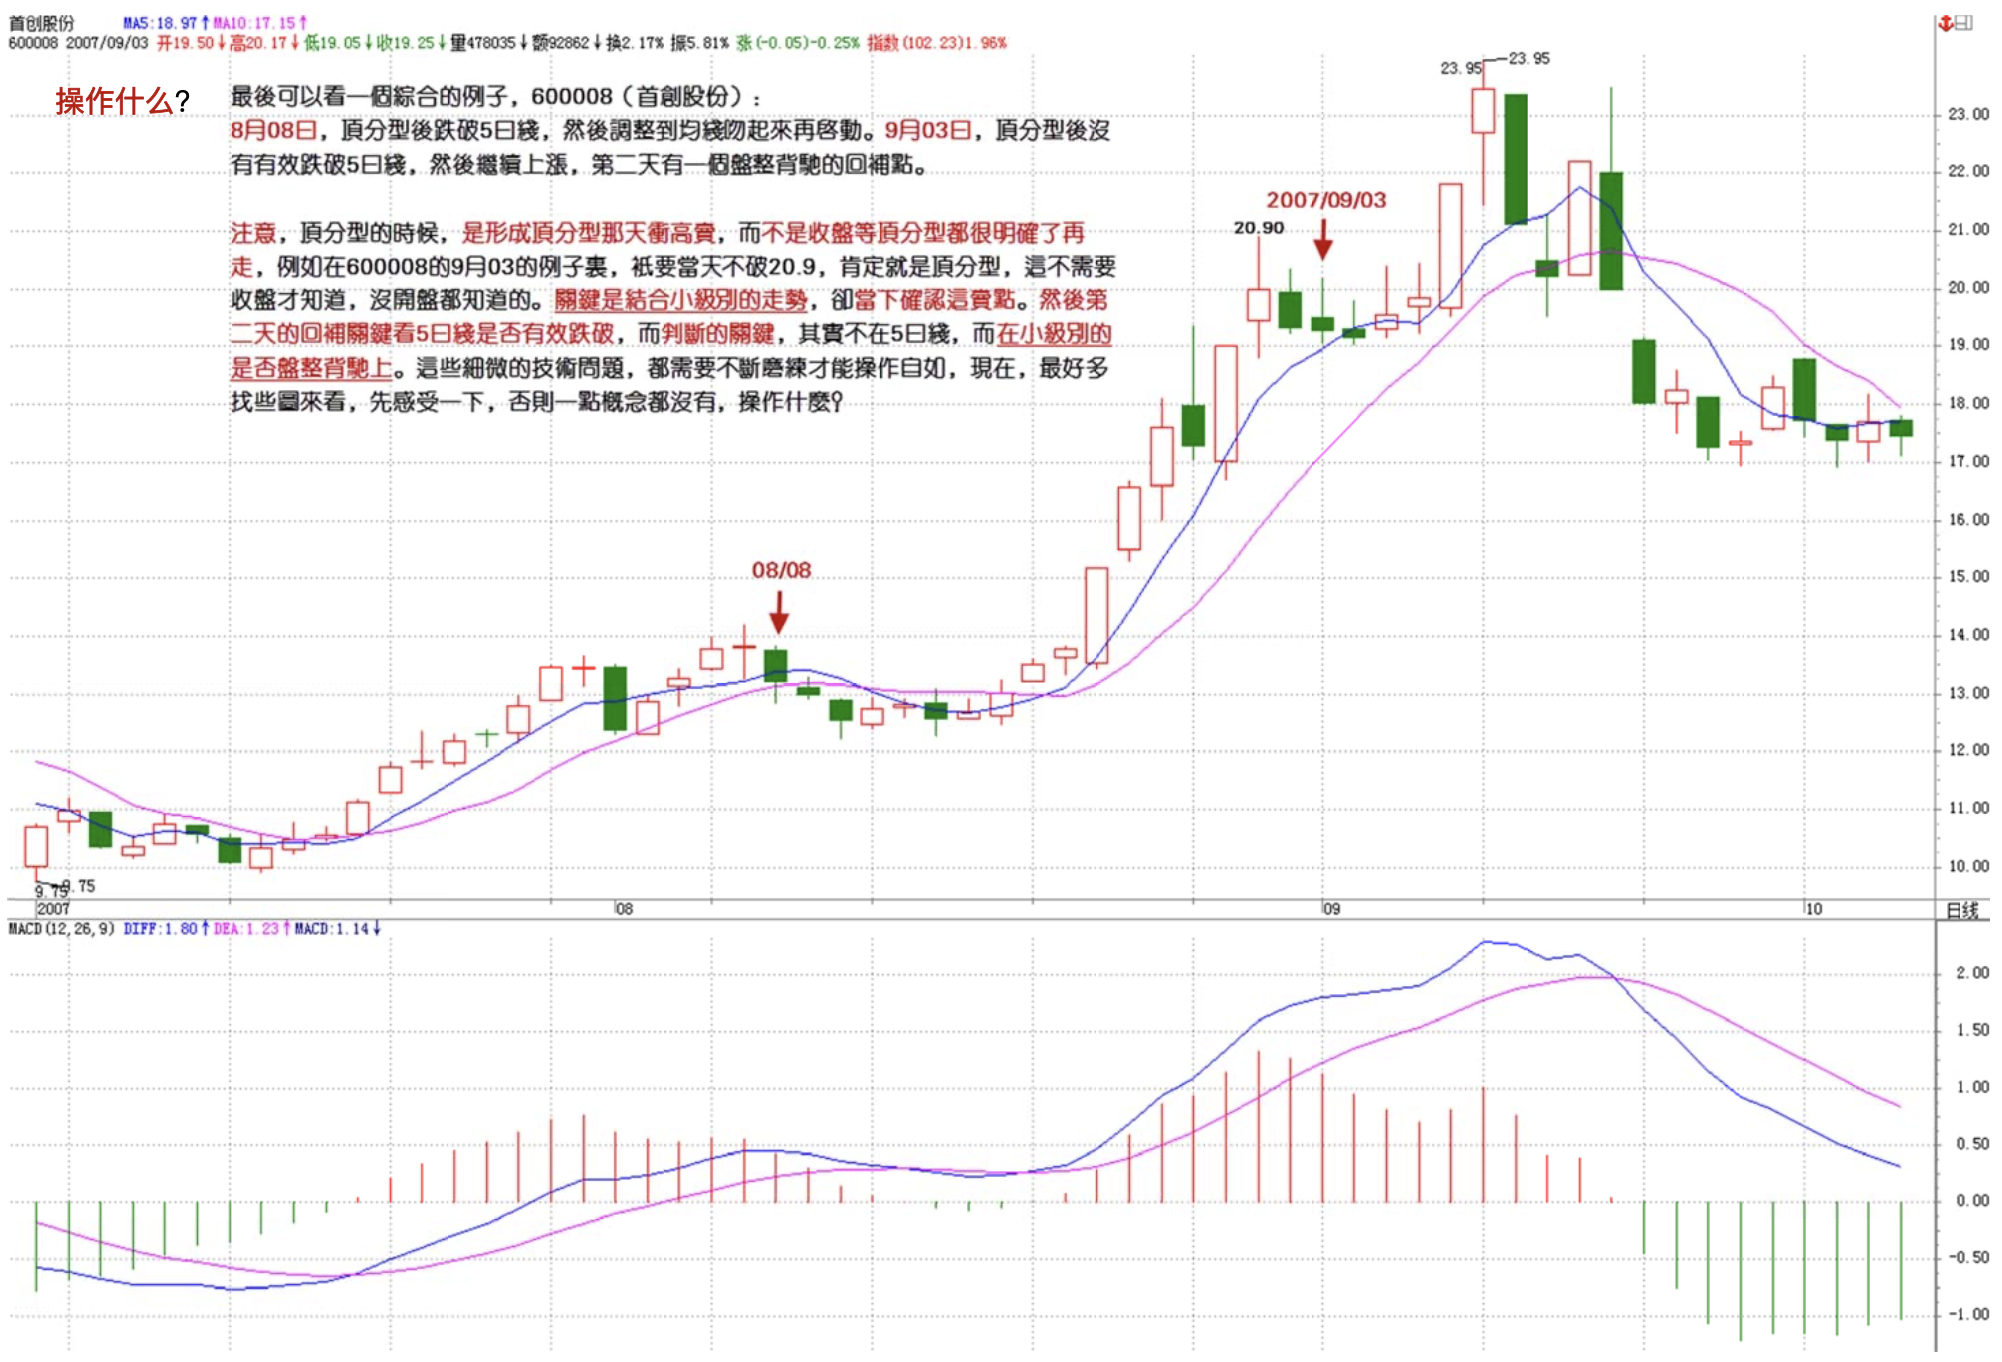
Finally, let's look at a comprehensive example, 600008:
August 8 — after the top fractal, price broke below the 5-day moving average, then adjusted until the moving averages kissed together before launching again. September 3 — after the top fractal, price didn't effectively break below the 5-day moving average, then continued rising, with a consolidation divergence buyback point the next day.
Note: at the time of the top fractal, you sell on the surge of the day the top fractal forms, not at the close when the top fractal is already clearly established. For example, in the September 3 case of 600008, as long as the price doesn't break 20.9 that day, it's definitely a top fractal — you don't need to wait for the close to know this; you know it even before the market opens. The key is to combine with the small-level trend to confirm this sell point in the present moment. Then for the next day's buyback, the key is whether the 5-day moving average is effectively broken, and the key to that judgment actually isn't the 5-day moving average itself, but whether small-level consolidation divergence occurs.
These subtle technical issues require constant refinement to operate freely. For now, the best approach is to find many charts to study and develop a feel for it — otherwise, without any concept at all, what can you operate on?
缠中说禅 2007/9/11 9:14:41
Burn Burn Magu Trade Stocks
2007-09-10 20:30:51
Let me explain — I'm not suggesting friends focus on China Shipbuilding, since it's already high-risk. Rather, it's other listed companies related to the "iron-blooded industry." I hope everyone can land on the golden nest. If there's more precise information, I'll continue sharing.
~~~~~
Thanks for Magu's reminder!
Let me go check what related industries there are!
-------------------
Other than warships it's aircraft — 000768 AVIC Xi'an
============================
Are you people idiots? 600677 already publicly announced a secondary offering for new weapon systems, and you've been studying my theory all this time — so I've been teaching you for nothing?
You followers need a scolding or there's no fixing you!