Teaching You to Trade Stocks 21: The Completeness of Chan Theory Buy/Sell Point Analysis
2007/1/9 15:03:58
The three types of buy/sell points have already been discussed. A very practical question is: besides these three types of buy/sell points, are there any other types? The answer is no. What must be emphasized here is that these three types of buy/sell points are all theoretically guaranteed, 100% safe buy/sell points. If one doesn't have a thorough understanding of the absolute safety of these three types of buy/sell points, then one absolutely cannot and absolutely does not have a thorough understanding of Chan Theory technical analysis. Market trading ultimately comes down to grasping buy/sell points. The completeness of buy/sell points is the completeness of the theory. Therefore, a comprehensive discussion of this issue is necessary.
So-called 100% safe buy/sell points mean that after these points, the market must reverse — there are no ambiguous or discernment-requiring situations to choose from. Market trading cannot be entirely built upon probability. The absolute certainty of the market is the only trustworthy harbor in trading. Some may object, saying there's nothing absolute in this world. Well, who guaranteed the absolute certainty that there's no absolute certainty? All absolute certainty is built upon "invariance," and the market itself is also built upon "invariance." "Invariance" is rooted in "variance," and "variance" is rooted in "invariance," but this doesn't diminish its brilliance and absoluteness. For related understanding, please read more of this ID's commentaries on "The Analerta." The stock market is not a purely theoretical matter. Although in theory this ID can reveal to everyone the completeness of buy/sell points, buy/sell points cannot execute trades by themselves. The final transaction is completed by people. The same tools may produce completely different results in different people's hands, and the market only looks at results. No amount of crying and shouting that your theory is complete and the best will help — it is people who wield the theory, not the theory that wields people. To make one's use of theory reach the perfection of the theory itself ultimately depends on one's own cultivation in the market, which is closely related to "The Analects." Self-cultivation, family regulation, state governance, and world peace — they equally apply to stock market trading.
From the series of analyses above regarding Chan Theory trend hubs, at any point in a trend, one necessarily faces two possibilities: continuation or reversal of the trend type. In other words, for example, for a definitive buy point, it must satisfy one of the following two situations: an upward continuation or a downward-to-upward reversal. For the continuation case, the only possibility is that it occurs during a rising process — otherwise there would be nothing to continue. For a buy point generated during an upward continuation, a hub must necessarily exist ahead of it. For the reversal case, the trend type being reversed can only be a decline or consolidation, and whether it's a decline or consolidation, a trend hub must necessarily exist before the buy point. Summarizing the above, regardless of what has come before, everything uniquely corresponds to a hub's existence followed by the continuation or reversal of the trend. This analysis is equally valid for sell points.
Therefore, all buy/sell points must necessarily correspond to a relationship with the nearest hub of that level. For buy points, those generated below the hub necessarily correspond to reversals, and those generated above the hub necessarily correspond to continuations. Hubs have three situations: continuation, expansion, and new generation. If it's hub continuation, then it's impossible for buy points to exist above the hub, because hub continuation necessarily requires that all trends above the hub reverse downward — at that time, only sell points are possible. For hub expansion or new generation, buy points will exist above the hub — these buy points are the third-type buy points. In other words, third-type buy points are generated by hub expansion or new generation. Hub expansion leads to a larger-level hub, while hub new generation forms an uptrend — these are the two situations that must appear after a third-type buy point. Obviously, the case of a larger-level hub is less attractive than one where an uptrend immediately appears, so in practice, how to avoid the first situation as much as possible becomes the biggest concern. But regardless of which situation, as long as the conditions for a third-type buy point are met, profits must follow — this is the crux of the matter.
For buy points formed below the hub, if that hub is within a rise, buy points below the hub cannot necessarily form. Buy points below the hub can only exist in declining and consolidating trend types. In other words, once an uptrend is confirmed, first and second-type buy points are no longer possible — only third-type buy points remain. For the consolidation case, hub expansion and new generation cannot necessarily guarantee that the buy point will produce an upward reversal, because the expansion and new generation could well develop downward. And for hub continuation, the hub can break at any time to end the continuation, and there's no necessary upward reversal either. So in consolidation, buy points below the hub don't necessarily appear either. Therefore, only below the hub after a decline is confirmed can buy points possibly appear. This is the first-type buy point.
The second-type buy point is closely connected to the first-type buy point. After a first-type buy point appears, only consolidation and upward trend types can follow. The low point of the second sub-level segment after the first buy point constitutes the second-type buy point. According to the principle that "trends must complete themselves," a third upward sub-level segment must necessarily appear thereafter, making this buy point absolutely safe too. The second-type buy point doesn't necessarily appear above or below the hub — it can appear at any position. If generated below the hub, the subsequent strength is doubtful, and the possibility of an expansionary hub is great. If generated within the hub, the chances of hub expansion and new generation are roughly even. If generated above the hub, the chances of hub new generation are great. But regardless of which situation, profit is certain.
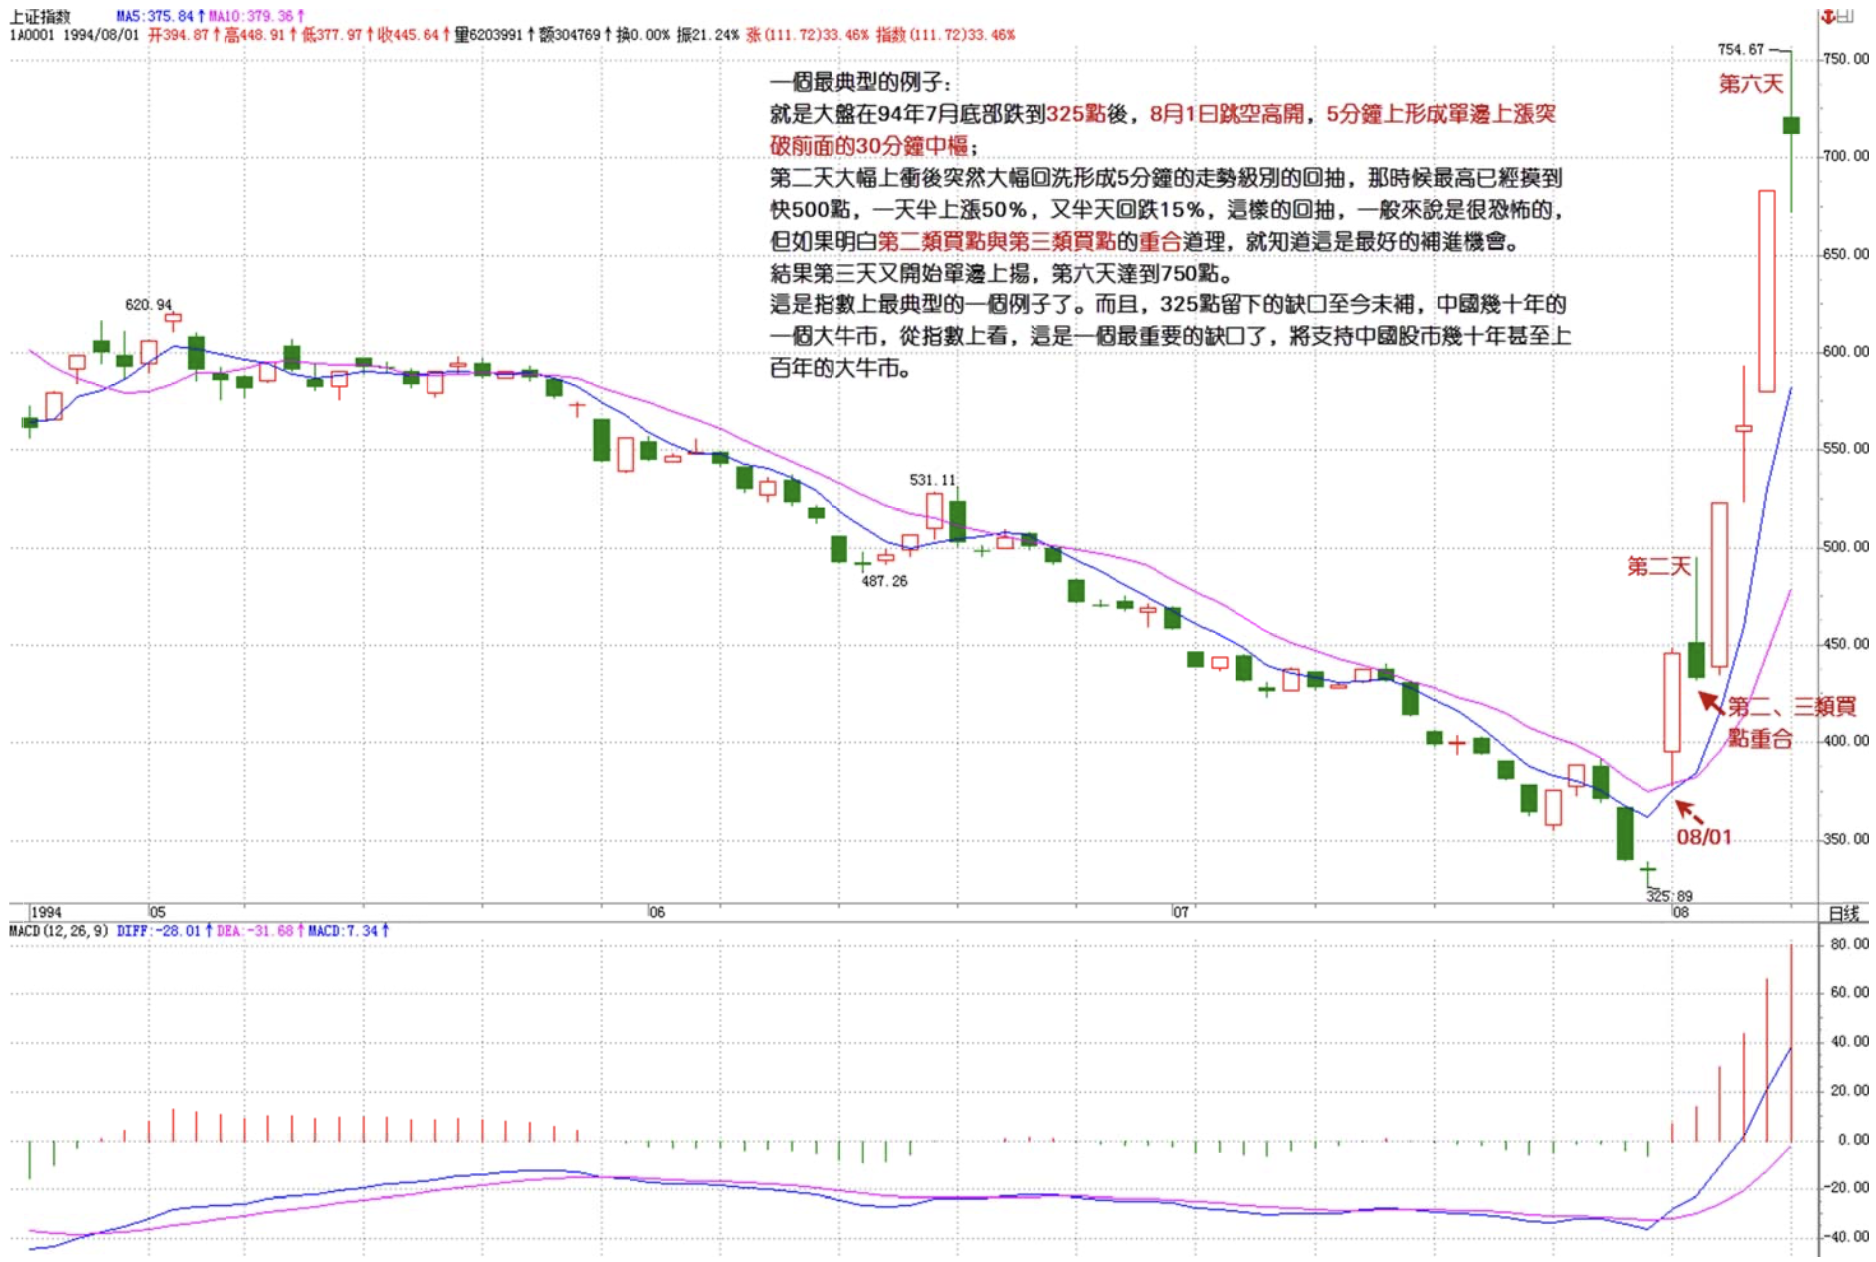
Obviously, first-type and second-type buy points appear sequentially and cannot overlap. First-type and third-type buy points — one below the hub, one above it — also cannot overlap. Only second-type and third-type buy points can possibly overlap. This situation occurs when: after a first-type buy point appears, a sub-level trend vigorously breaks straight through the last hub of the preceding decline, then a sub-level pullback above it doesn't touch that hub — at this point, the second-type and third-type buy points coincide. Only in this situation will the two overlap. Of course, in theory, there's no necessary reason to determine that coinciding second and third-type buy points won't merely form a larger-level hub expansion. But in practice, once this situation occurs, a major rise often follows. One of the most classic examples is the broad market bottoming out at 325 points at the end of July 1994. On August 1st it gapped up sharply, forming a unidirectional rise on the 5-minute chart that broke through the preceding 30-minute hub. The next day, after a massive surge, there was a sudden violent washout forming a 5-minute level pullback. By that point the high had already touched nearly 500 points — a 50% rise in a day and a half, then a 15% drop in half a day. Such a pullback would normally be terrifying, but understanding the principle of second and third-type buy point coincidence, you'd know this was the best opportunity to add positions. The result was a unidirectional surge again on the third day, reaching 750 points by the sixth day. This is the most classic example on the index. Moreover, the gap left at 325 has never been filled to this day — for China's decades-long mega bull market, from the index's perspective, this is one of the most important gaps, supporting China's stock market bull run for decades or even a hundred years.
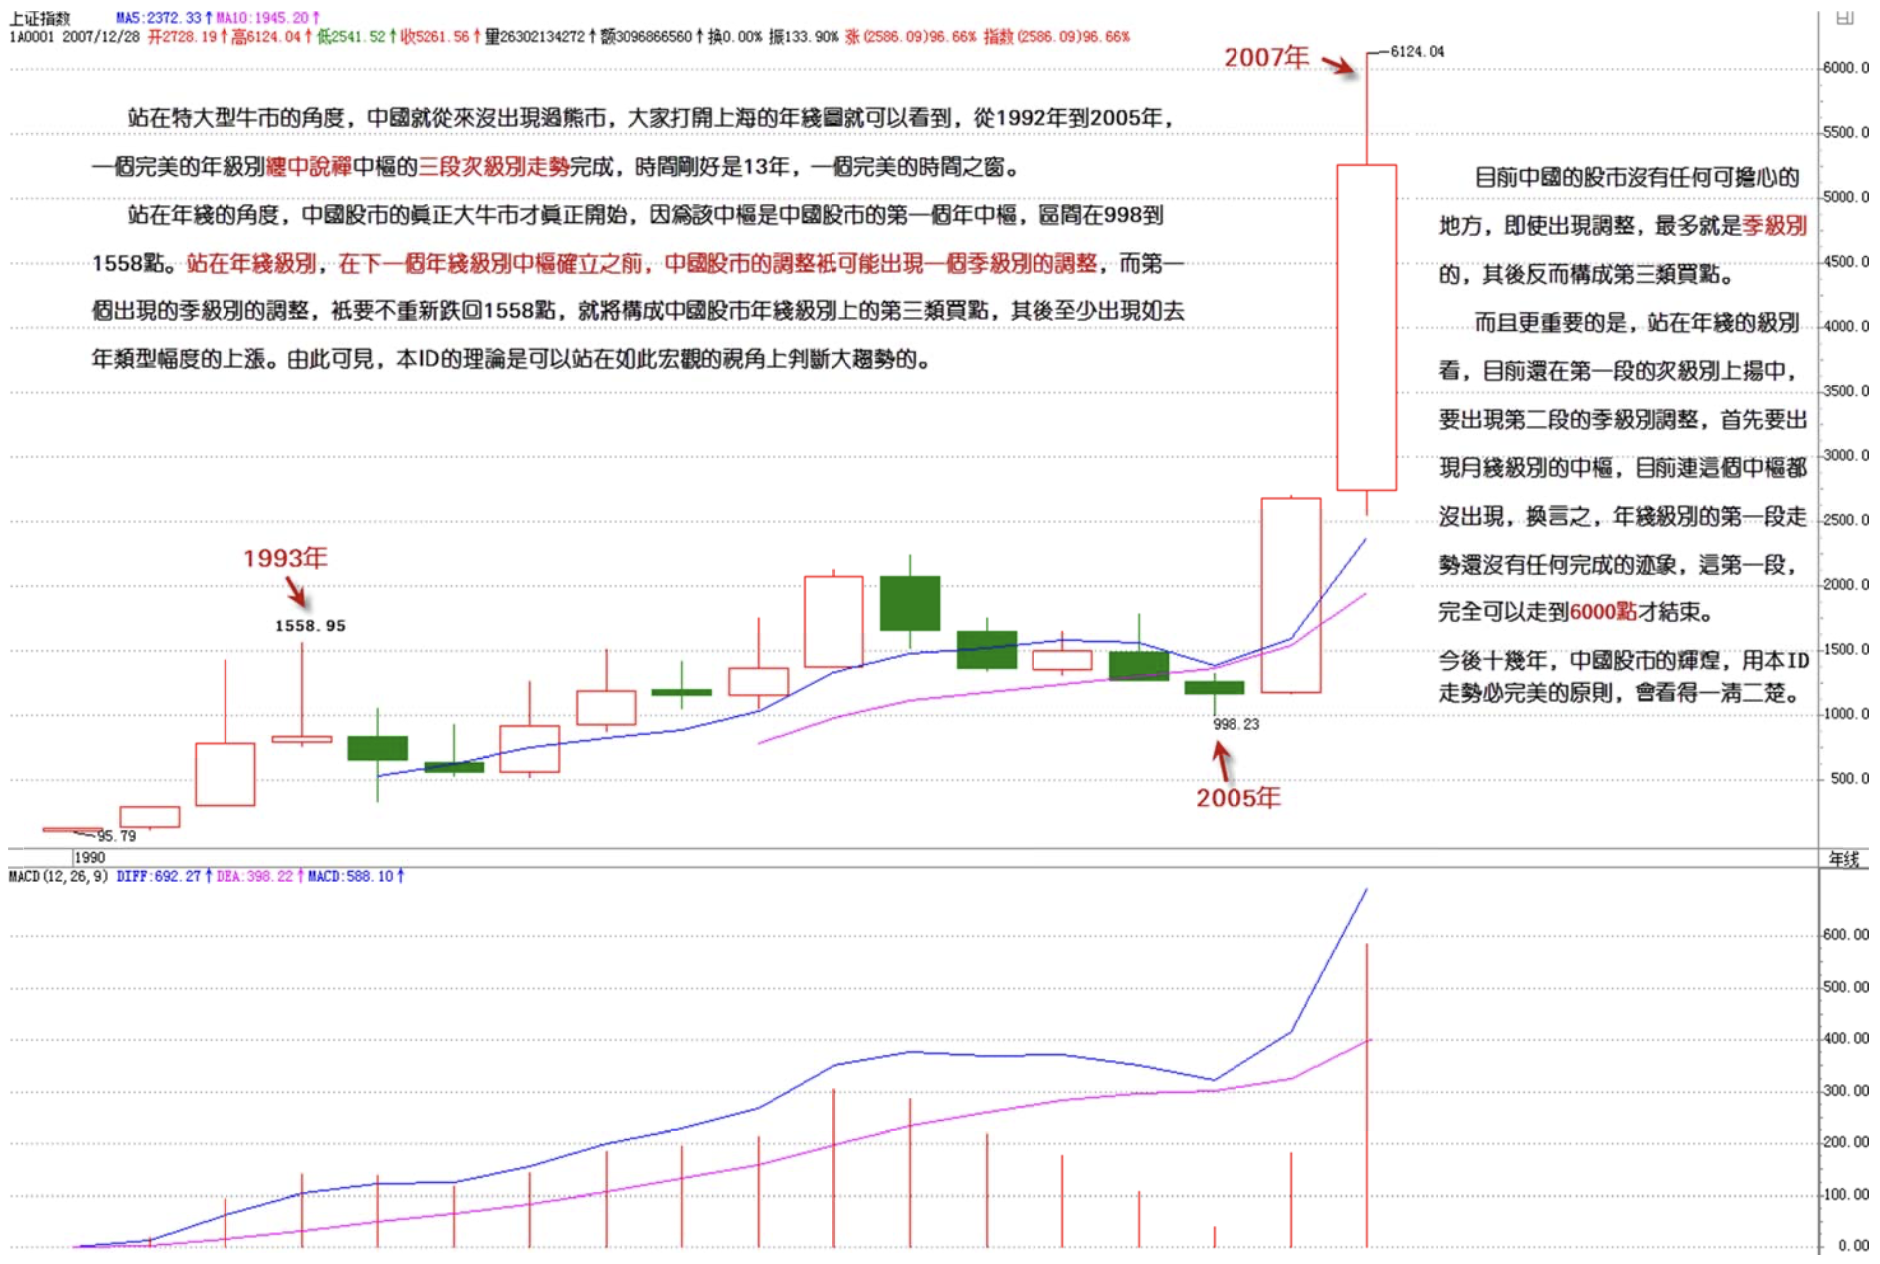
Let me add a note: from the perspective of a mega bull market, China has never actually experienced a bear market. Everyone, open the Shanghai annual candlestick chart and you'll see that from 1992 to 2005, a perfect annual-level Chan Theory hub's three sub-level segments completed, spanning exactly 13 years — a perfect time window. From the annual chart perspective, China's stock market's true mega bull market is just truly beginning, because that hub is the Chinese stock market's first annual hub, with a range of 998 to 1558 points. From the annual chart level, before the next annual-level hub is confirmed, adjustments in the Chinese stock market can only produce a quarterly-level correction. The first quarterly-level correction to appear, as long as it doesn't fall back to 1558 points, will constitute a third-type buy point on the annual chart level for the Chinese stock market. What follows would be at least an advance of the magnitude seen last year. From this, it's clear that this ID's theory can make judgments about major trends from such a macroscopic perspective. Currently, there's nothing to worry about in China's stock market. Even if an adjustment occurs, it would be at most quarterly-level, and what follows would actually constitute a third-type buy point. Moreover, and more importantly, from the annual chart level, we're still in the first sub-level upswing. For the second quarterly-level correction to occur, a monthly-level hub must first appear, and currently even this hub hasn't appeared. In other words, the first segment of the annual chart level hasn't shown any sign of completion. This first segment could very well run to 6000 points before ending. Over the next decade or so, the glory of China's stock market, using this ID's principle that trends must complete themselves, will be crystal clear. This principle treats the annual chart and the 1-minute chart equally — that's the power of Chan Theory technical analysis. This is called slaying all sizes, suitable for young and old alike.
The analysis for sell points is identical. Summarized, we have the Chan Theory Buy/Sell Point Completeness Theorem: The only buy/sell points in the market that necessarily produce profits are the first, second, and third types.
An identical analysis can prove the Chan Theory Rise/Fall Completeness Theorem: Any rise and fall in the market must necessarily begin and end from one of the three types of Chan Theory buy/sell points. In other words, market trends are entirely composed of such line segments, whose endpoints are one of the three types of Chan Theory buy/sell points at some level.
Thought Exercise: Any line segment must have endpoints that are a buy point and a sell point respectively. Please completely enumerate all possible combinations between the various types of buy and sell points. If a line segment's endpoints are same-level buy and sell points, which combination is absolutely impossible?
Replies
缠中说禅 2007/1/9 15:16:30
Even if it's a 419 fling, you need to get the foreplay and climax fully taken care of. In a bull market you must never be an early ejaculator.
Signing off, see you later.
缠中说禅 2007/1/9 21:09:07
[Anonymous] Leisurely
2007-01-09 16:29:45
Big sis, which of your previous articles discuss those 3 types of buy/sell points?
I've looked but can't find them — please tell me! A lot of people want to know too!
==
Anyone who's seriously read the previous articles shouldn't have this question. When facing the market, without undergoing a thorough personal transformation, it's impossible to beat the market. In the market, all luck can only be temporary, and the market will exact payback with interest.
缠中说禅 2007/1/9 21:10:58
wy1499
2007-01-09 19:25:49
Immersed
I encountered the same question about Weixing Co.'s movement. Chan MM previously mentioned Beijing North Star's rise from 11.7-12.6, where the same thing happened. On the 30-minute chart, whether judged by moving average momentum or the MACD indicator, divergence had already formed on the uptrend by 11:00 AM on November 13th. But afterwards it kept making new highs, proving this was actually just a relay. If I weren't looking at it in hindsight, I very likely would have sold on 11.13. I personally feel that grasping buy/sell points requires mastering other areas of knowledge as well. Chan MM has said that a true expert's skill lies in distinguishing between relays and reversals. Right now I frequently misjudge relays as reversals, especially on small-level charts. But combining with larger-level charts and reducing trading frequency does improve the success rate. Of course, the best approach is still waiting for Chan MM's upcoming content. Blogger, do you think my view is correct?
Also, the blogger previously mentioned time windows, using one month as the standard on daily and 30-minute charts. But how did it become 13 years on the annual chart for the broader market? Is there a mathematical relationship between the two?
===
There's more than one type of time window. This will be discussed later.
缠中说禅 2007/1/9 21:25:18
[Anonymous] 无知
2007-01-09 20:35:57
Miss Chan, my capital is quite small. I didn't buy China Life Insurance today — should I sell some stocks that aren't moving much to buy Life Insurance?
?
===
Didn't this ID have a dream about a pharmaceutical more than 10 days ago? That dream was prepared for all you small-capital folks. Buy it and just wait, continue studying The Analects, studying technical analysis, studying everything else. How come nobody understands?
This ID casually has a dream, you enter the dream, patiently wait to turn 1 into at least 2 or 3, and in the meantime just study hard and improve daily. Why must you run around every day?
Human greed is always laughable. Why must there be a dream every day? One dream lets you safely turn 1 into 2 or 3 — do you really need other dreams? Can those people who have a dream every day turn 1 into 2 or 3?
This ID's new batch of capital actually targeted 5 stocks. This pharmaceutical is already the safest — turning your 1 into 1.4 in 10 trading days. I won't say it's the absolute best, but it's certainly among the most impressive recently. This ID doesn't want to mention the other 4 — as long as one of them achieves the goal, there's no need to say so much.
Of course, this ID could reveal the other four. Two of them, like that pharmaceutical, are both in Shenzhen. This ID is rather lazy — there are too many stock codes to remember nowadays, so I pick ones with codes containing only two types of digits. The other two have codes consecutive with two of these three.
These 5 stocks will ultimately be like last year's liquor — that's absolutely certain. But for those of you with small capital, buying one is enough. If you have the pharmaceutical, store it well and be careful of moisture.
Everyone, be more devoted. Running around every day guarantees you won't make big money.
As for Life Insurance — if you're devoted, no problems at all. If you're not, you'll definitely suffer.
缠中说禅 2007/1/9 21:32:33
For those who performed poorly last year, the root cause is all mindset. Fix your mindset first. Stop hoping every day for pie to fall from the sky, and when pie really does fall from the sky, you can't catch it. How could you possibly make money like this?
缠中说禅 2007/1/9 21:37:00
[Anonymous] 学习
2007-01-09 21:26:44
Blogger, when forming a larger-level hub, is its range the sum of the two ranges?
====
For example, if the original was daily-level and now becomes weekly-level, then find three segments of sub-level (daily) trends on the weekly chart and use the hub formula to determine them. There's no question of summing two intervals.
缠中说禅 2007/1/9 21:41:07
[Anonymous] 舍小赢大
2007-01-09 21:32:50
Blogger's back from indulging — is my judgment of ICBC's divergence correct?
[Anonymous] 舍小赢大
2007-01-09 16:38:14
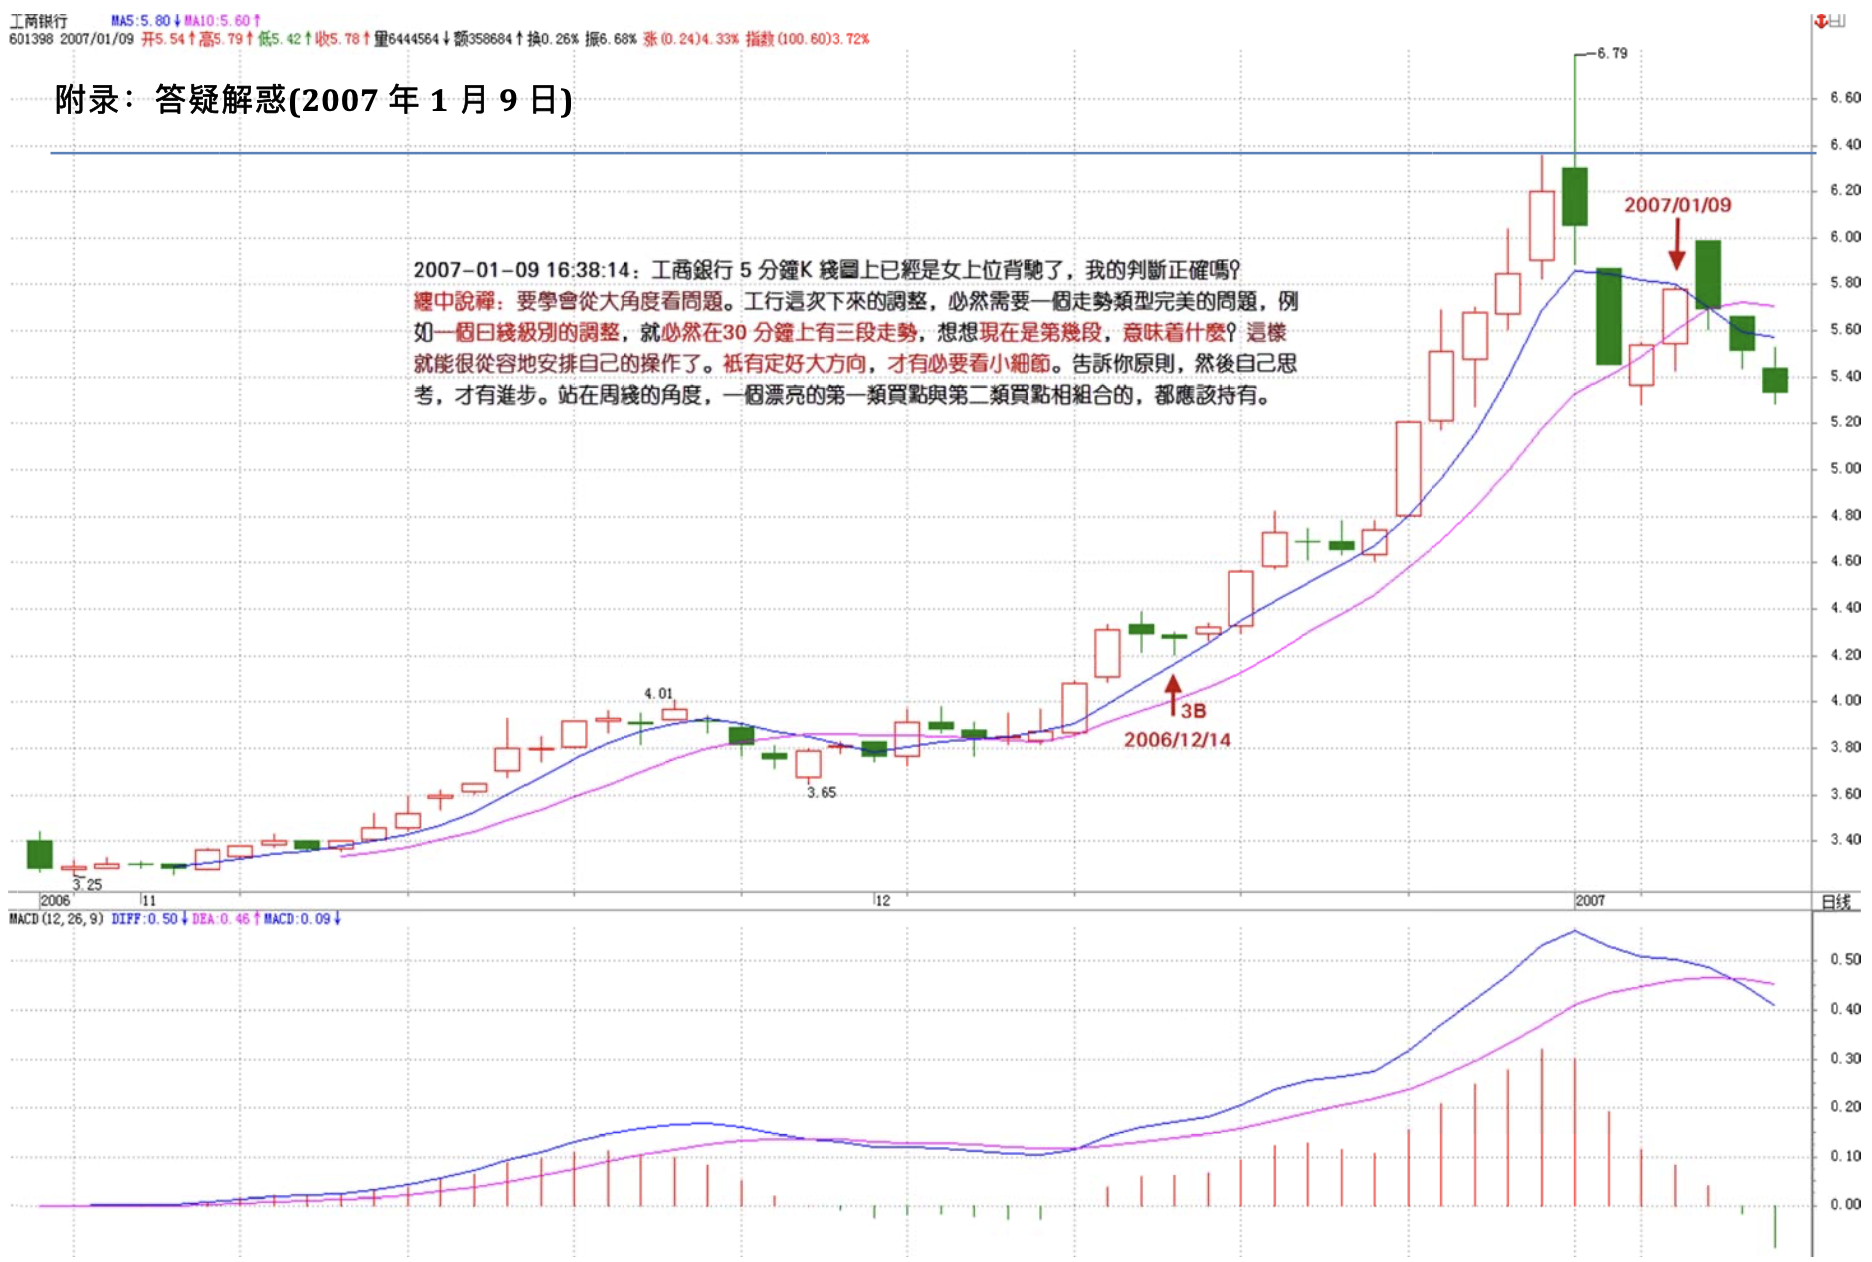
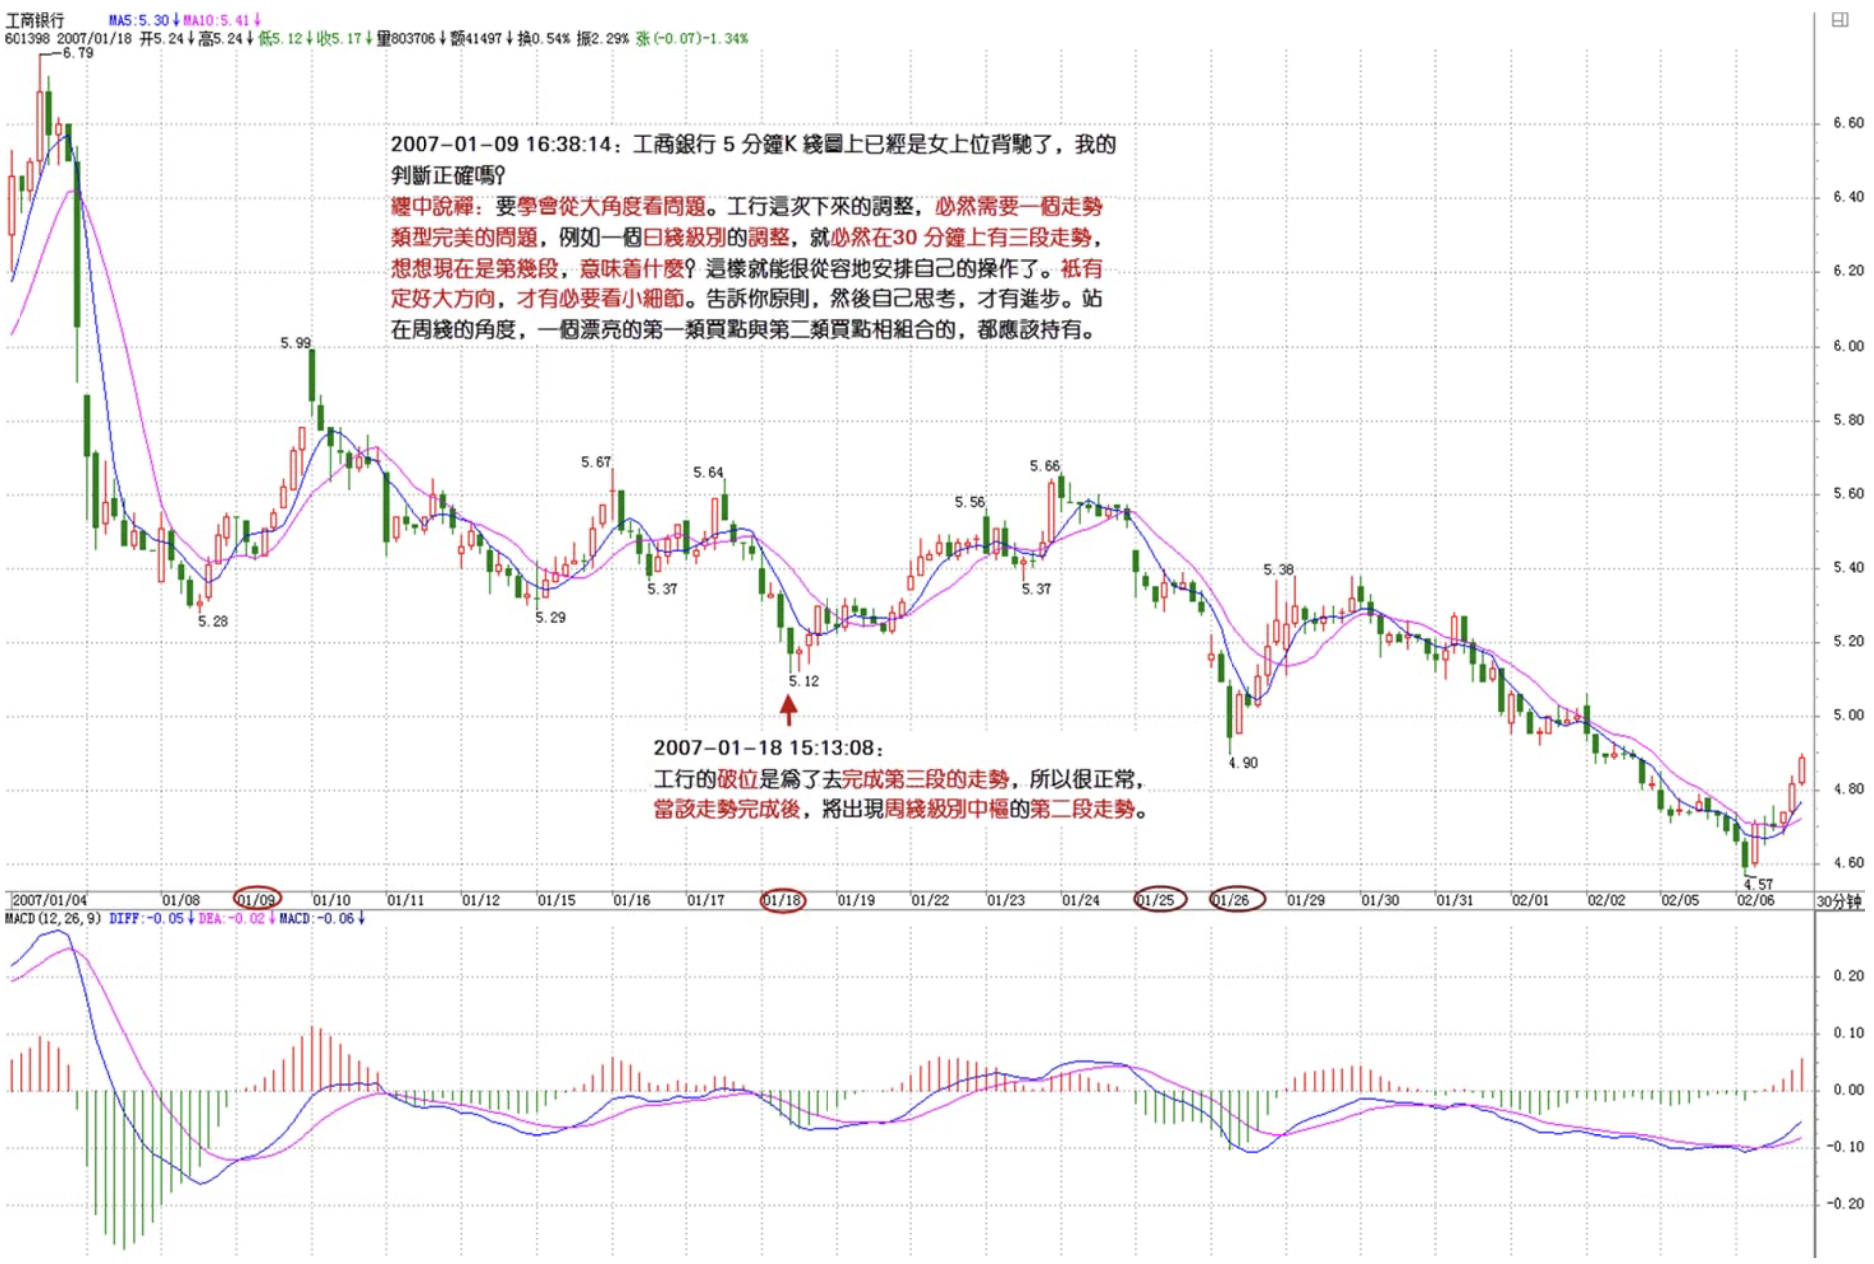
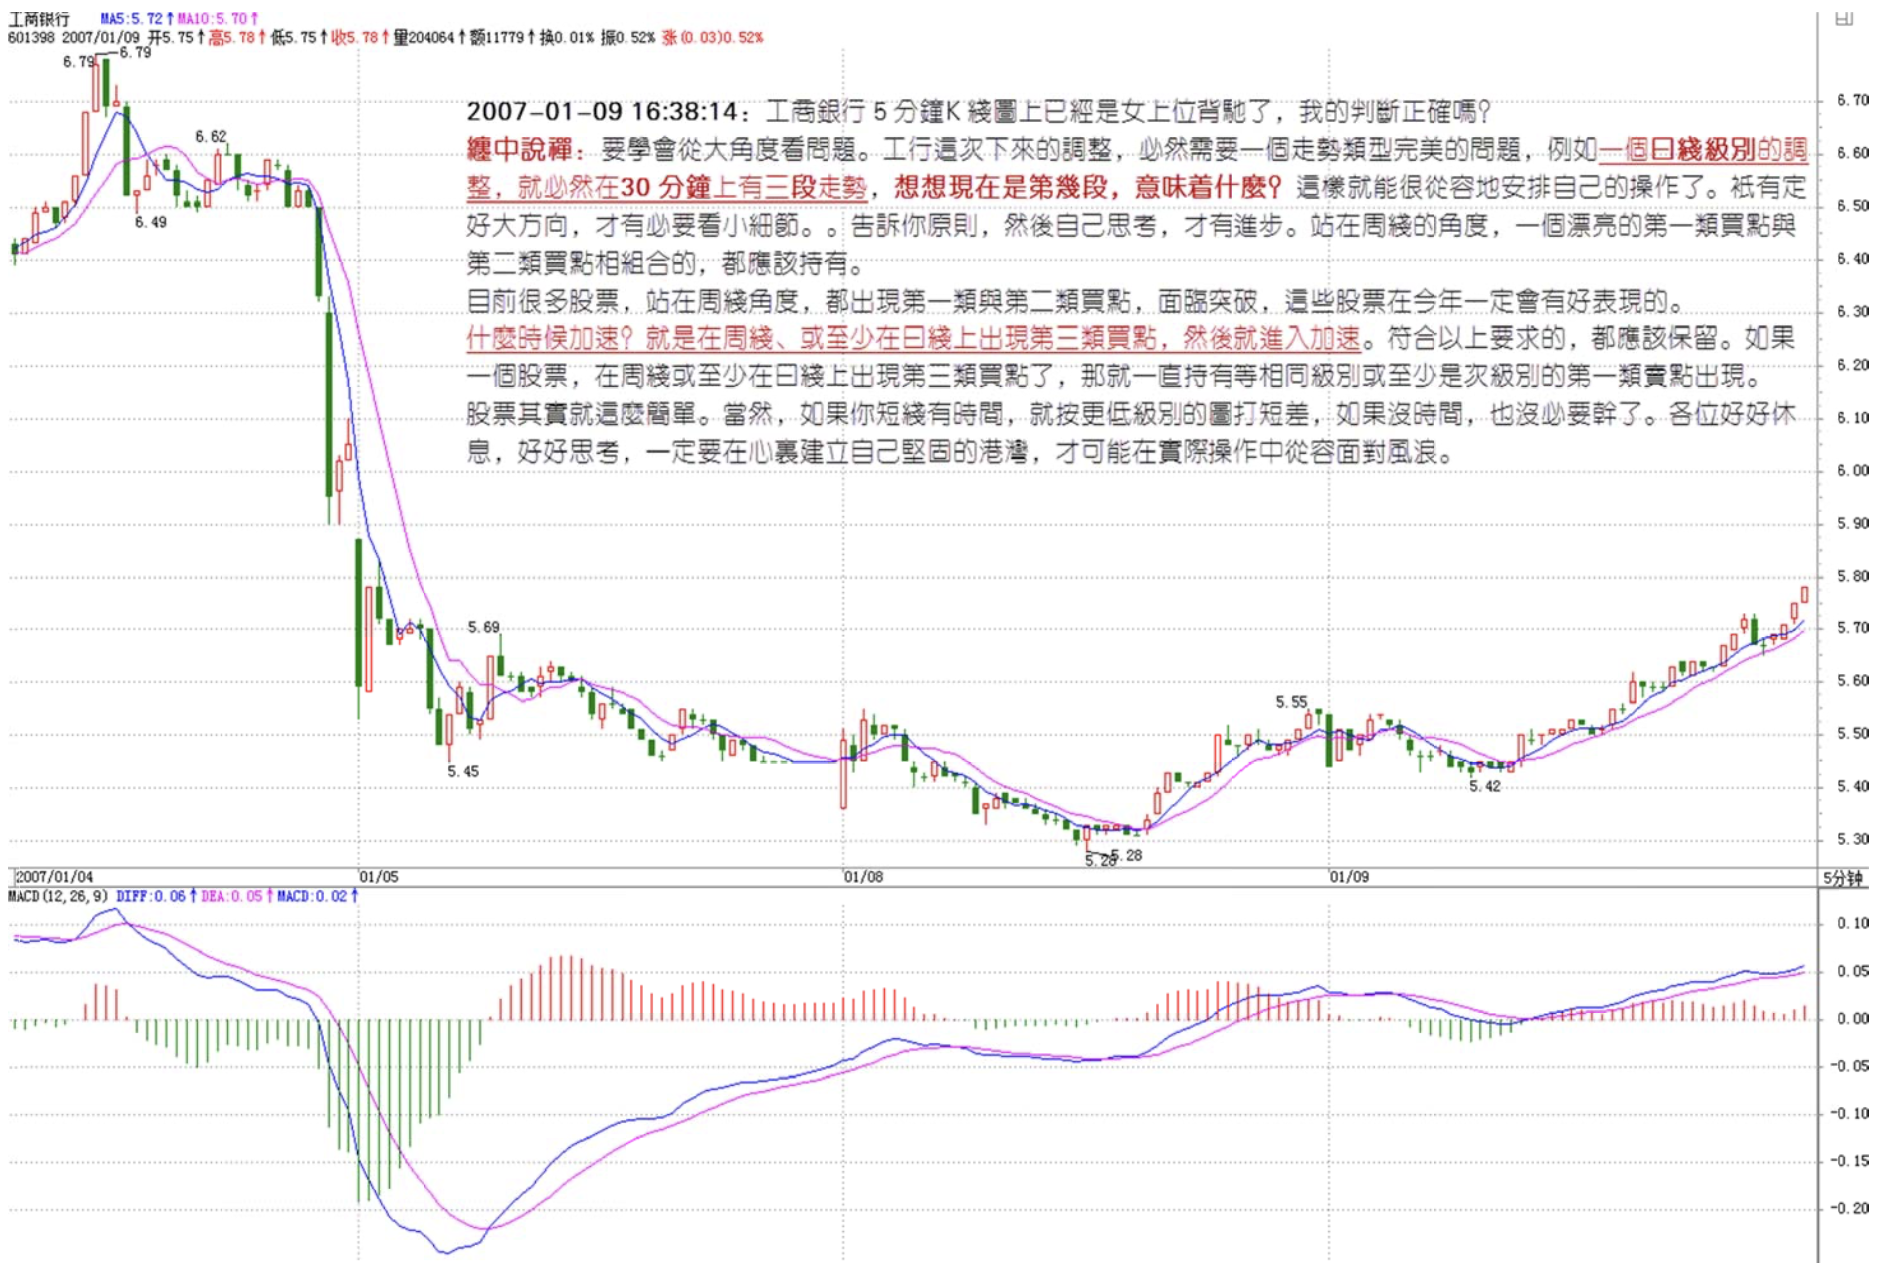
Chan MM, on the ICBC 5-minute K-chart, it's already showing girl-on-top divergence — is my judgment correct?
===
Learn to look at problems from a larger perspective. ICBC's current pullback necessarily requires a complete trend type — for example, a daily-level correction necessarily has three segments on the 30-minute chart. Think about which segment we're on now and what that implies. This way, you can very composedly arrange your operations. Only after determining the big direction is it necessary to look at small details.
缠中说禅 2007/1/9 21:47:01
[Anonymous] 无言
2007-01-09 21:39:47
Miss Chan, you're truly a kind soul! Boundless merit! Not only no tuition, but also providing meal tickets. Though I don't know which stock Miss Chan picked, ever since studying Miss Chan's theory, I've been making a steady 3% daily return. Thank you!
===
This ID's original idea was: since many of you don't have very large capital and can't settle down to study because you're always thinking about looking for jobs to eat, I'd provide a dose of medicine for everyone to eat while studying in peace. Now looking at it, I don't know how many people have understood this ID's intention.
If your wandering mind won't die, you can't learn real skills.
Sometimes, even cooking the medicine and feeding it to everyone might not work. The key is still the person themselves. This ID's theory is like that medicine — even if everyone knows and understands it, actual operational results still depend on your own mindset.
Let's take a count: who was able to buy that pharmaceutical around 6 yuan, still holds it now, and is peacefully studying?
缠中说禅 2007/1/9 21:57:27
[Anonymous] 不争而胜
2007-01-09 21:46:45
Blogger, you said that for capital of 300K, one shouldn't hold more than 3 stocks. Following your theory, I keep finding and collecting stocks — all profitable, but I want to be more focused. Could you help me weed some out?
600824, entered around 5.50 after rights offering;
000928, entered at 4.90;
000520,3.2
000429,4.7
000100,2.2
Thank you!!!
===
I'll tell you the principles, then think for yourself — that's how you improve. From the weekly chart perspective, those with a beautiful combination of first-type and second-type buy points should all be held.
Currently, many stocks, from the weekly chart perspective, are showing first and second-type buy points and facing breakouts. These stocks will definitely perform well this year. When will they accelerate? When a third-type buy point appears on the weekly chart, or at least on the daily chart — then comes the acceleration.
Those meeting the above criteria should all be kept.
If a stock has shown a third-type buy point on the weekly chart or at least on the daily chart, then hold it until a same-level or at least sub-level first-type sell point appears. Stocks are really that simple. Of course, if you have time for short-term trading, play short differences on lower-level charts. If you don't have time, there's no need either.
缠中说禅 2007/1/9 22:00:06
Too late, signing off. Everyone rest well, think carefully, and build your own fortress within yourselves — only then can you calmly face storms in actual trading.
Goodbye.
缠中说禅 2007/1/9 15:13:32
There's nothing much to say about the broad market. Life Insurance opening around 40 makes some short-term volatility normal — the main issue is insufficient turnover, too many reluctant sellers. The short-term key is to shake these people out. For the medium term, this stock has absolutely no problems. Look at where Moutai was priced when it listed and where it is now. China's greatest resource is people, and Life Insurance deals in people — without people, even the liquor goes to waste.
Everyone's key is holding your stocks. Like that certain pharmaceutical this ID mentioned while dreaming — in just 10 trading days, a 40% gain, and after a couple more days it'll be even more. But how many can hold on? Be more devoted — don't prematurely ejaculate before the foreplay even starts.
I have things this afternoon. Please leave your questions and I'll answer tonight.