Teaching You to Trade Stocks 108: What Is a Bottom? Viewing Medium-Term Trend Evolution from Monthly Charts
2008/8/29 9:15:01
What is a bottom? Here I give a precise definition, so there will be no more confusion. Bottoms are differentiated by level. From the perspective of precise trend types, the period from the appearance of a first-type buy point until the first time a third-type buy or sell point emerges from the hub triggered by that buy point can all be considered the bottom construction process. The only difference is that if a third-type sell point appears first, it means the bottom construction has failed. Conversely, a third-type buy point signifies the final completion of bottom construction and the launch of a new move. Of course, for tops, the definition is simply reversed.
Additionally, one can define the concept of a bottom from the fractal perspective, though it's rougher. For those who can't yet grasp precise trend type classification, this is a makeshift approach. Also, for general analysis purposes, this method works because it's sufficient for grasping the big picture.
From the fractal perspective, the bottom is the interval that constitutes the bottom fractal. Breaking below the lowest point of the fractal means the bottom construction has failed. Conversely, effectively holding above the upper edge of the fractal interval means the bottom construction has succeeded and at least one stroke of upward movement will unfold. Actually, none of this is new content, but systematically stating it here still has its benefits. Likewise, tops are simply the reverse.
Pay attention: with this definition established, you must understand clearly that you don't buy at the upper range of the bottom interval. Rather, the opposite — just like hub oscillation operations, you buy when the probe to the lower range fails. That is the best buy point. If you can't even understand this, then you've studied for nothing. Also, bottoms have levels. A bottom fractal on the daily chart naturally corresponds to a daily-level bottom in fractal terms.
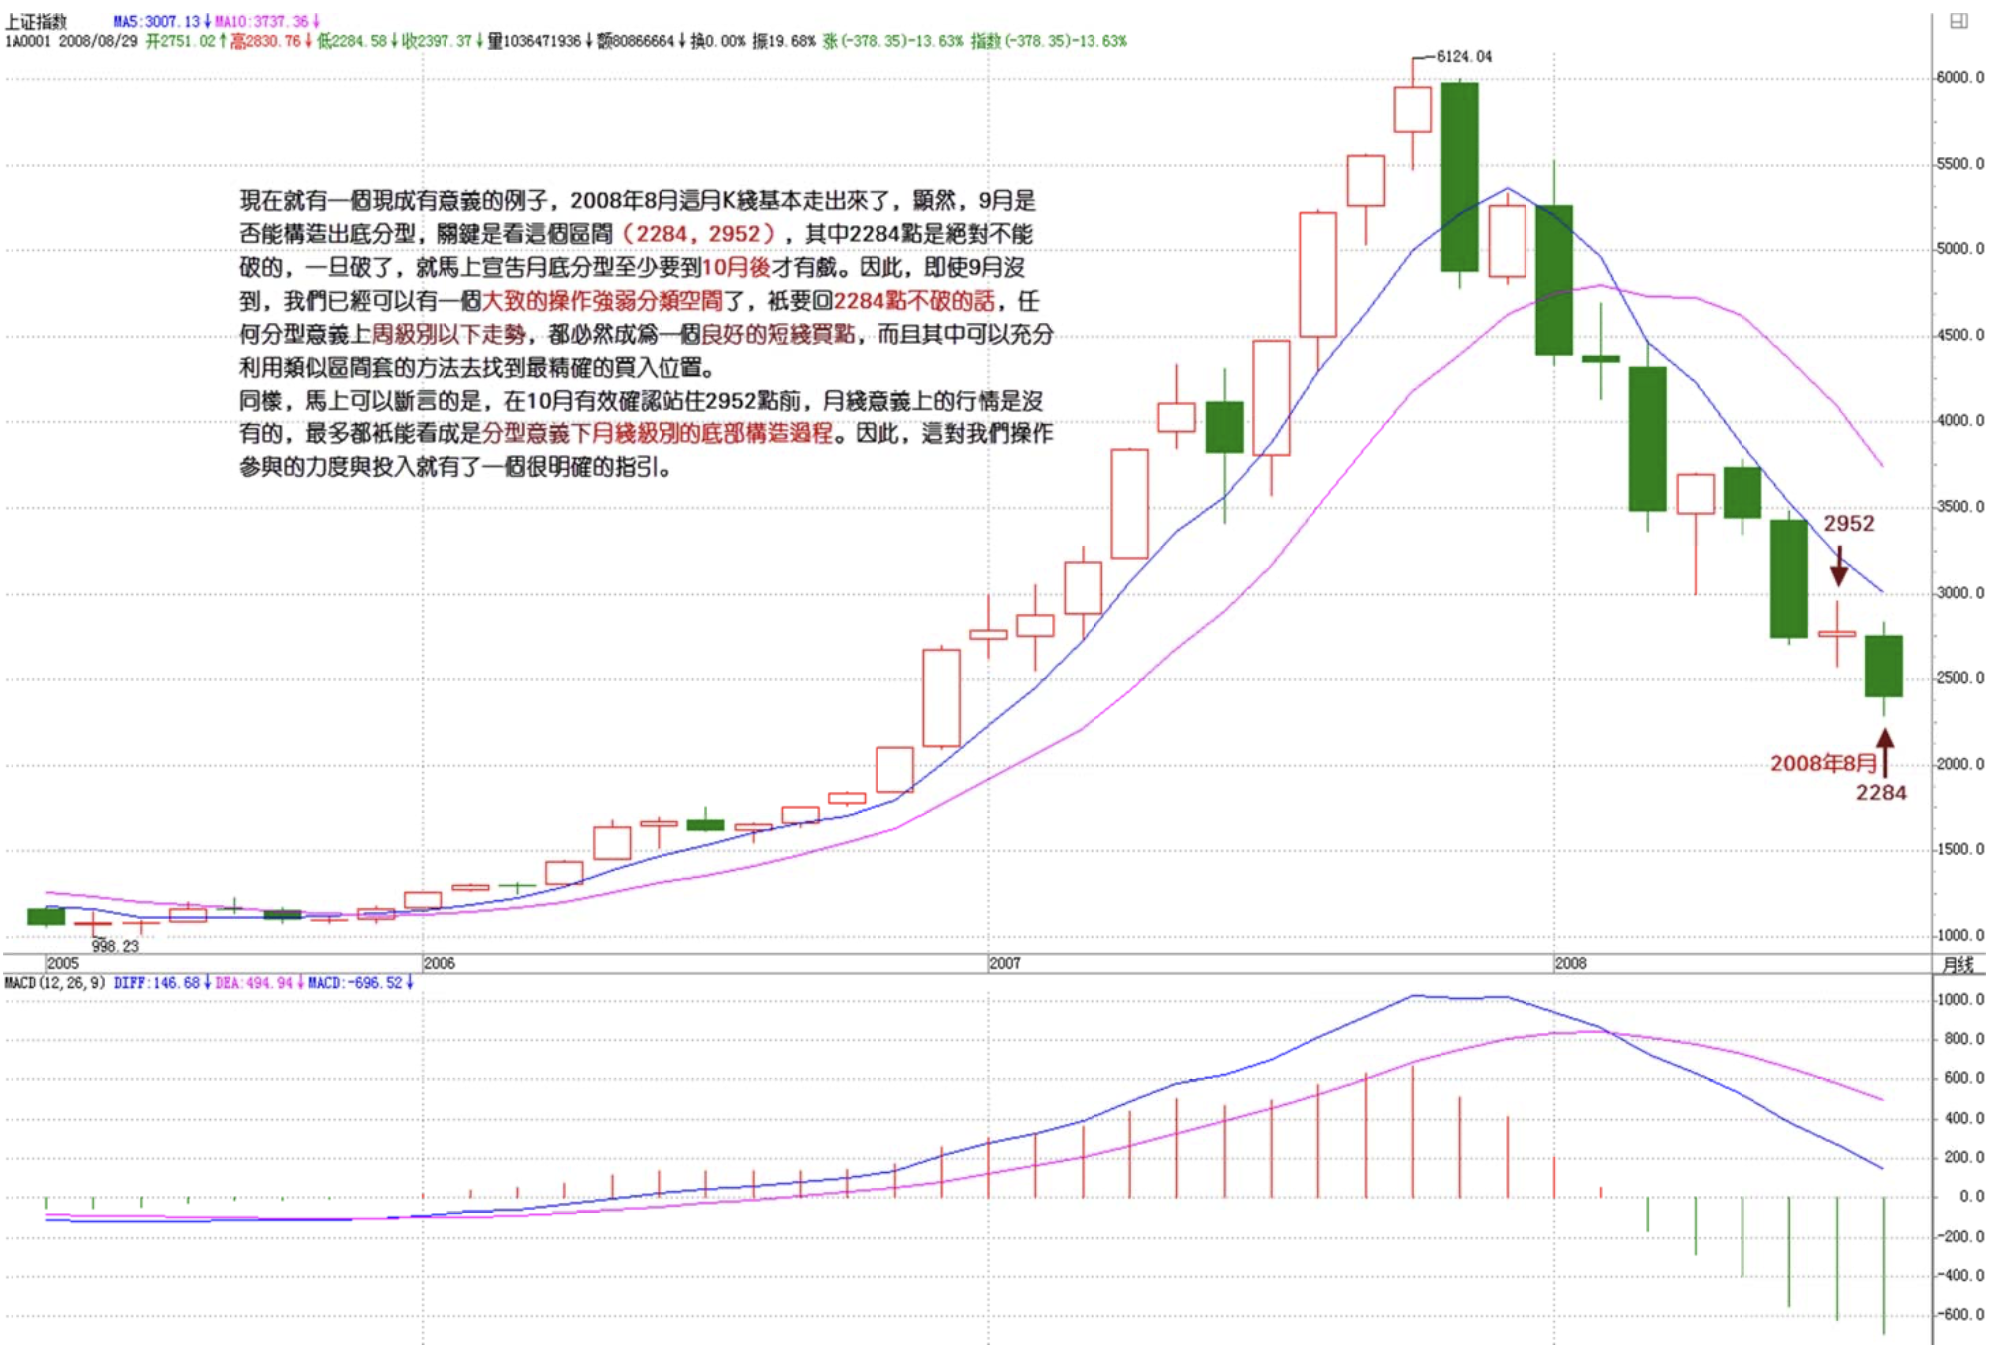
Now there's a readily meaningful example. The August 2008 monthly candlestick has essentially taken shape. Clearly, whether September can construct a bottom fractal depends on the interval (2284, 2952). Among these, 2284 points absolutely cannot be broken. Once broken, it immediately declares that the monthly bottom fractal will have to wait until at least after October. Therefore, even before September arrives, we can already have a rough operational strength classification space. Any trend below the weekly level in fractal terms where pullbacks to 2284 don't break must become a good short-term buy point, and one can fully utilize methods analogous to interval nesting to find the most precise entry positions.
Similarly, we can immediately assert that before 2952 points is effectively confirmed as held in October, there will be no monthly-level move. At most, everything can only be viewed as part of the bottom construction process at the monthly level in fractal terms. This gives us very clear guidance on the intensity and commitment of our operational participation.
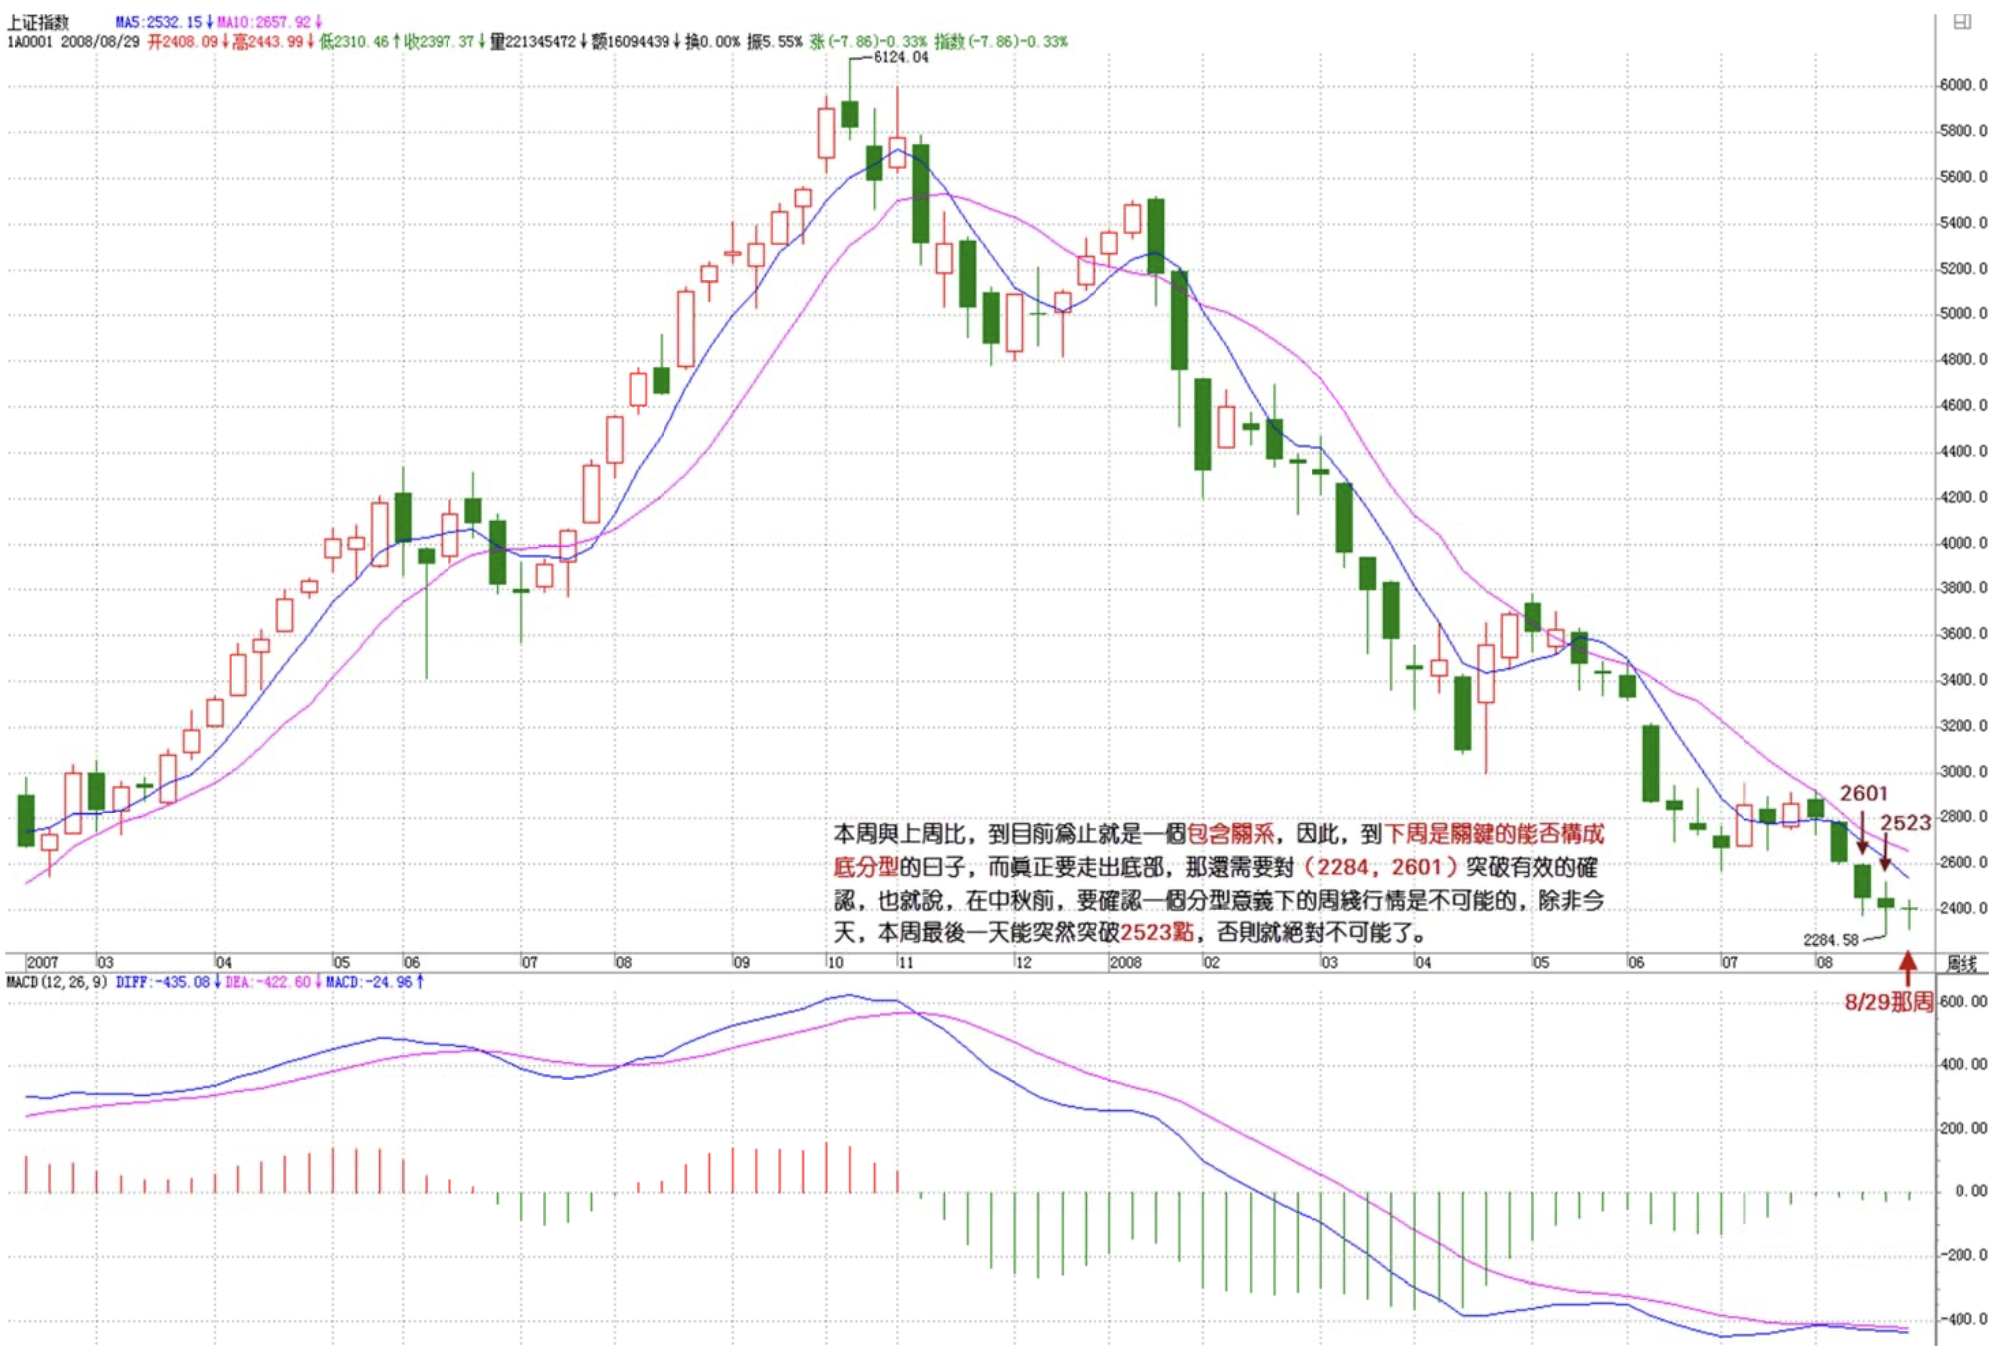
Of course, for ordinary investors, the monthly chart is too large a scale. So you can look at the weekly chart instead. For example, comparing this week with last week, so far it's an inclusion relationship. Therefore, next week is the critical period for whether a bottom fractal can form. But to truly walk out of the bottom, confirmation of an effective breakout of the (2284, 2601) range is still needed. That is to say, before the Mid-Autumn Festival, confirming a weekly-level move in fractal terms is impossible — unless today, the last trading day of this week, suddenly breaks through 2523 points. Otherwise, it is absolutely impossible.
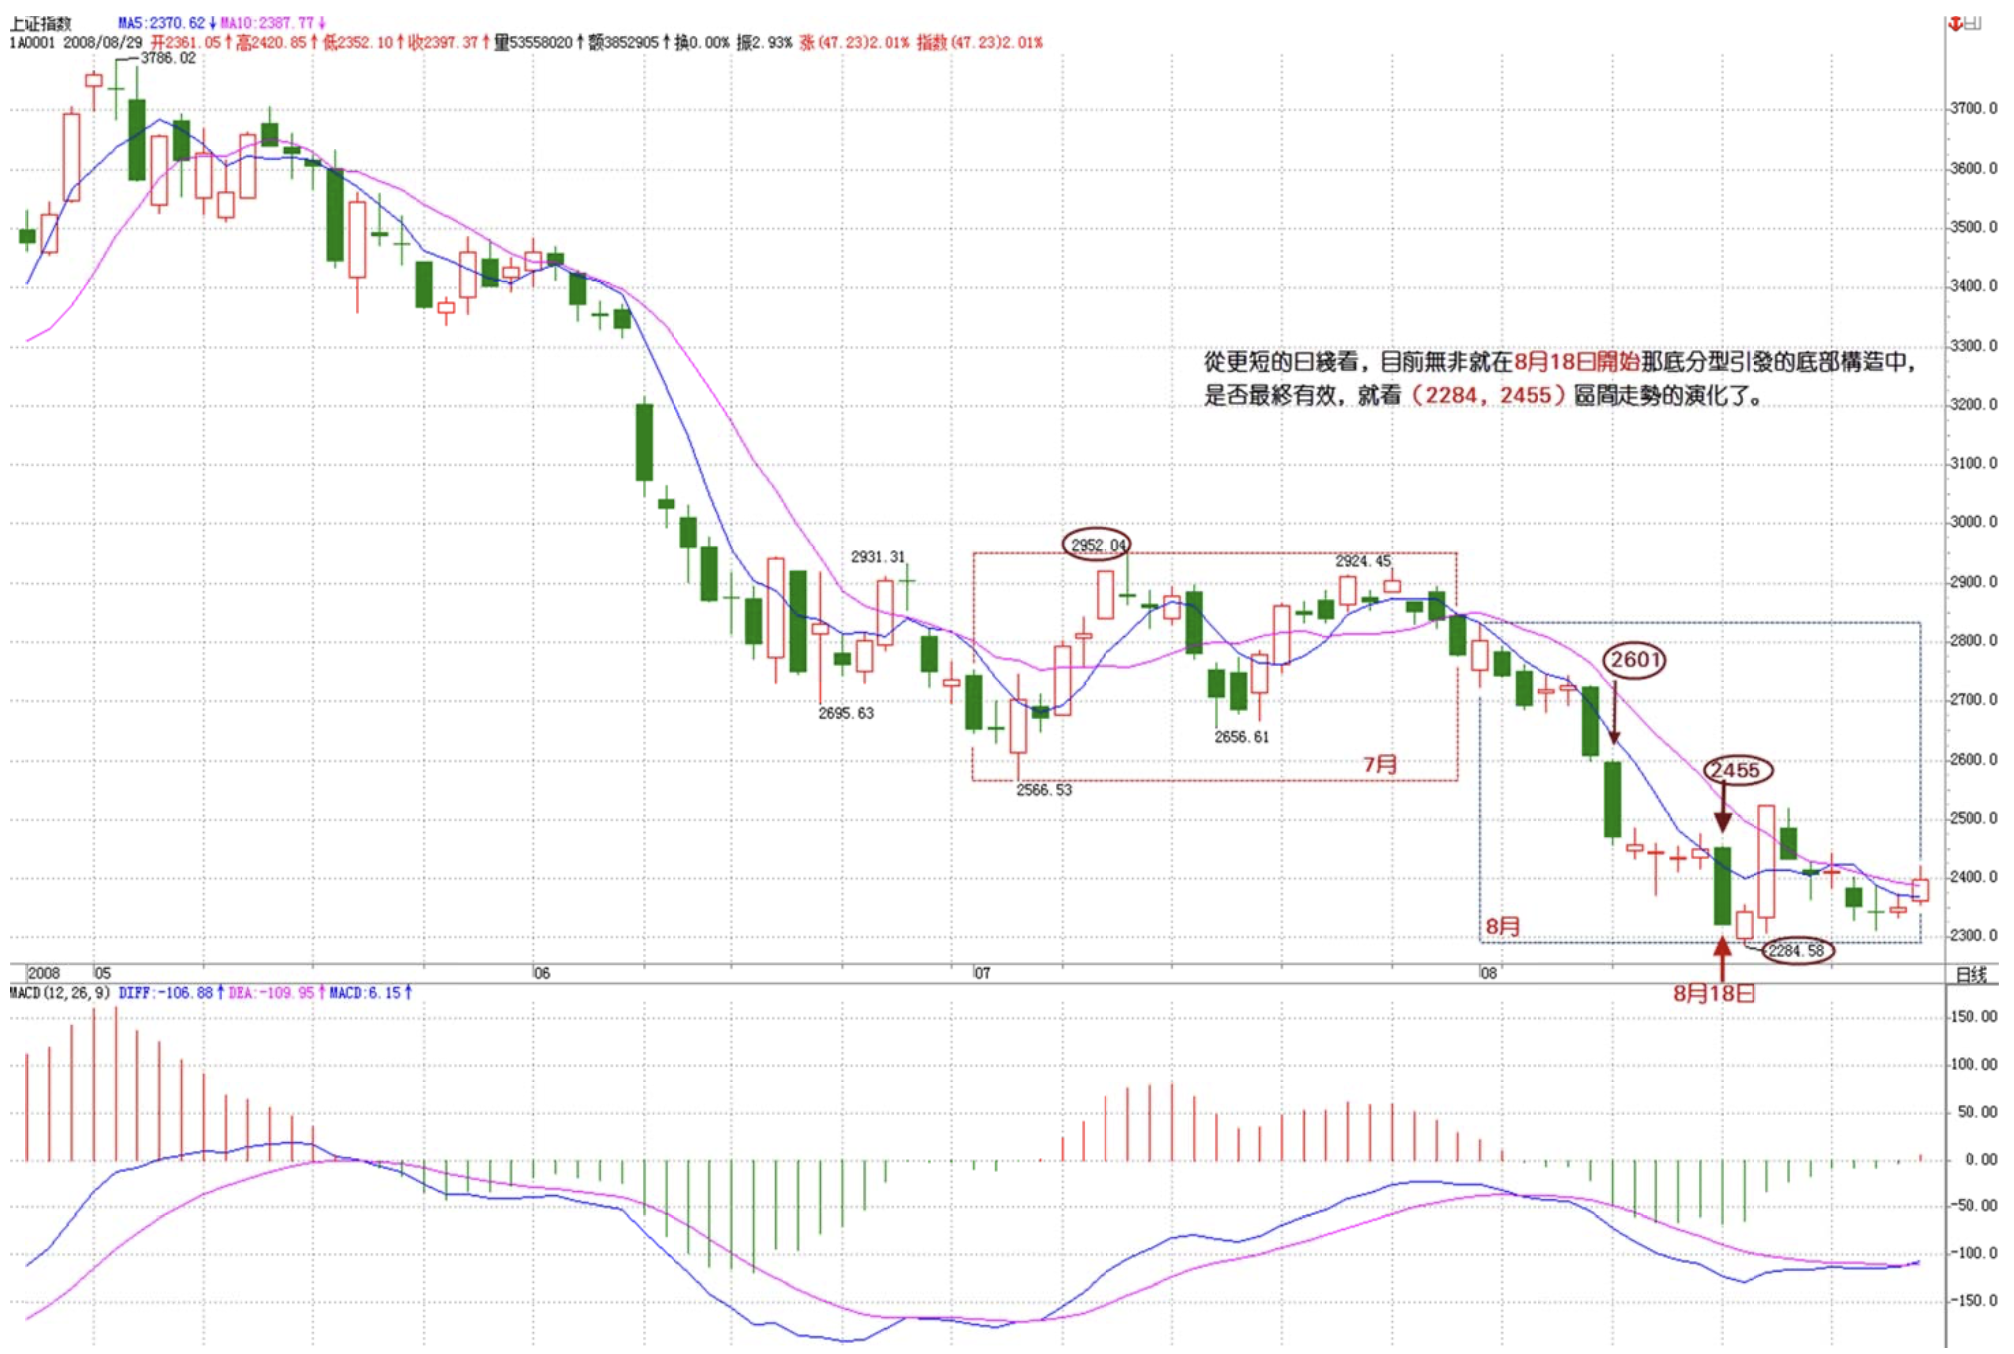
From the even shorter daily chart perspective, the current situation is simply within the bottom construction triggered by the bottom fractal starting August 18th. Whether it ultimately succeeds depends on the evolution of price action in the (2284, 2455) interval.
Trading is actually very simple. One basic principle is that any price action, no matter how it twists and turns, cannot escape this rhythm: bottom, top, and the connecting process between the two. Therefore, the operational rhythm at both ends is hub oscillation — except that at the bottom you should buy first then sell, and at the top you should sell first then buy, which is safer. As for the connecting part in the middle, that's holding. Of course, for bearish trends, sitting on a little stool (staying in cash) is the best form of holding — hold that position until the bottom construction is complete.
For those with skill, you don't need any little stool at all. According to your operational level, distinguish which of the three phases you're currently in, and then every day is a good day, every hour is a bloom. If you still can't make money, then you truly have water in your brain. All losses are caused by erroneous operations. Only through constant self-reflection will there be progress.