Teaching You to Trade Stocks 70: A Textbook-Style Trend Demonstration Analysis
2007/8/15 22:41:35
First of all, this afternoon was too rushed—after 37 I directly marked 39. I noticed it only after coming back in the evening and have already corrected it.
In previous lessons, this ID has repeatedly stated that the associative law is of vital importance. Among those here, few have seriously studied abstract algebra, so you don't quite understand the decisive significance of choosing operational rules for the object of study. For trends, the associative law is the most important rule connecting the relationships between trends. Without a deep understanding of this, how can you understand trends themselves?
Regardless of how you combine, this ID's theoretical principles for analyzing trends remain unchanged. You can think of it this way: this ID's theory is a set of theory with transformation invariance under the associative law for trends. Moreover, it can be rigorously proven that it is the only theory that maintains both decomposition transformation invariance and the associative law. If you have some basic knowledge of modern mathematics, you should be able to better appreciate the significance of this theory.
These past few days, as the trend developed in real time, this ID has been constantly shifting which hub to observe. The fundamental reason lies in the associative law—because of the associative law, we can decompose the trend in the most advantageous way for observation, making it easier to understand what the trend is actually doing.
For example, by today, one of the most obvious divisions has naturally emerged from the trend: segments 8-17 form a 5-minute hub. This hub is a new 5-minute hub that formed after the one coming up from the 4300-point 5-minute hub. When this hub first formed, we already pointed it out, and anyone who has studied this ID's theory can identify it in real time. Generally speaking, after this 5-minute hub forms, there are theoretically only three possible trend developments:
-
A third-type buy point appears upward, producing a 1-minute upward trend type, then forming a new 5-minute hub.
-
A third-type sell point appears downward, producing a 1-minute downward trend type, forming a new 5-minute hub.
-
Hub extension, or after a third-type buy/sell point appears, expansion into a larger-level 30-minute hub.
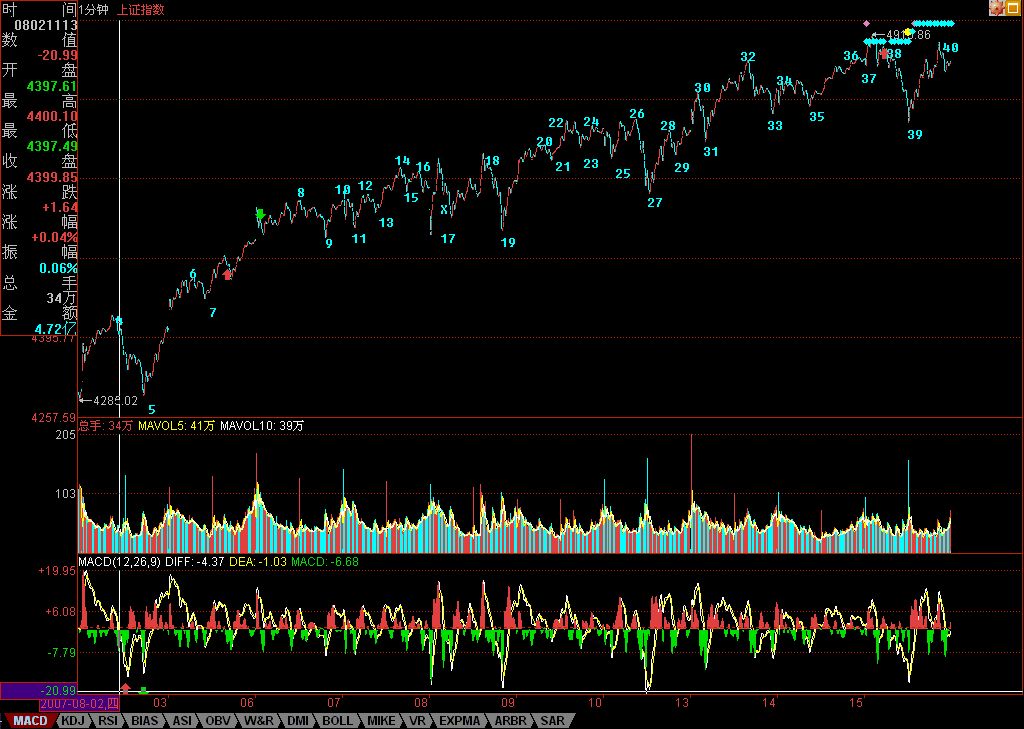
Obviously, as the market develops, there's no need to predict what the trend will choose—the trend chooses naturally, and you only need to observe. Now, the trend has naturally chosen the first option. Why? Because segments 17-38 constitute a perfect 1-minute uptrend. Currently, around the last 1-minute hub (32-35) of this 1-minute uptrend, the embryo of a new 5-minute hub is expanding.
This 5-minute hub will eventually at least be completed. As for whether it continues to expand into a larger 30-minute hub, or a third-type buy point of the new 5-minute hub appears for the uptrend to continue, forming yet another new 5-minute hub—there's no need to predict. Just treat it the same way as the 8-17 five-minute hub, that's all.
So, if you're operating on the 30-minute level, these 5-minute hub movements, oscillations, and so on need not concern you at all—just understand them, no operation needed. If you're operating on the 5-minute level, then wait for the 5-minute uptrend to show divergence before exiting. If you're operating on the 1-minute level, then you should have exited first thing this morning—why? Because the 1-minute uptrend showed divergence. According to this ID's theory, the price must subsequently pull back into the last 1-minute hub, thereby at least forming a new 5-minute hub. Then you can buy back based on the 5-minute oscillation trend.
Note that according to the principle of multiple decomposition, for the new 5-minute hub, we temporarily start counting from the last 1-minute hub. Subsequent operations are based on this for now, until the trend produces its most natural choice, at which point we can continue with a more reasonable division. According to this temporary division, it doesn't affect any operations—the 5-minute hub should be operated however it should be operated, that's all.
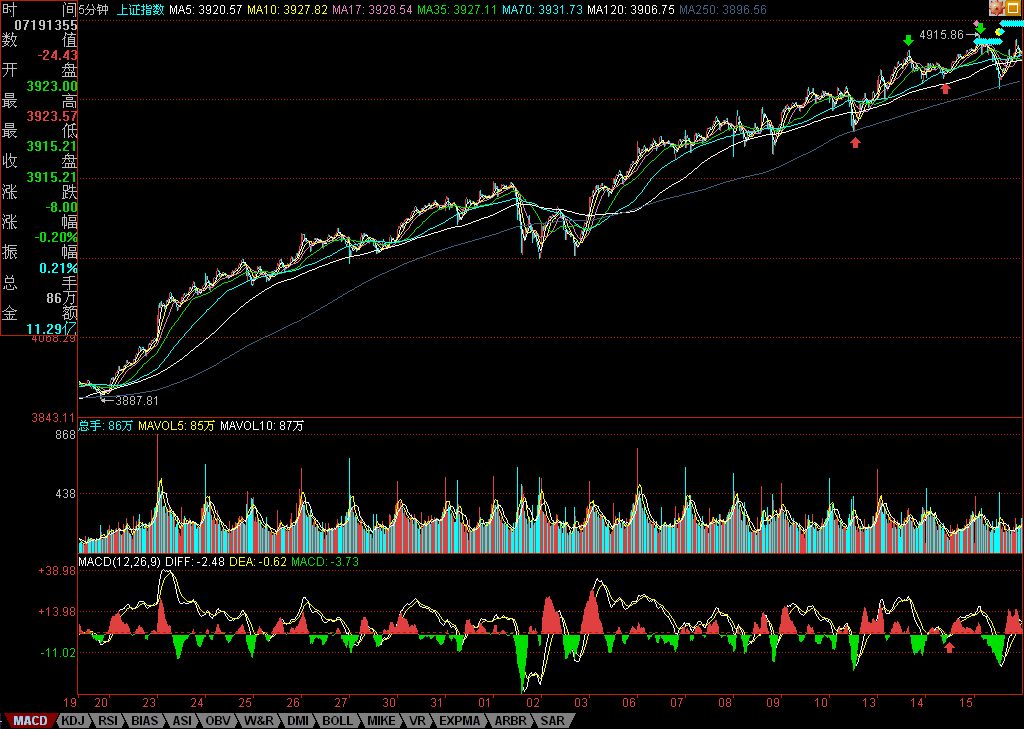
In today's divergence judgment, the key is knowing which two segments to compare. Obviously, compare segments 27-32 and 35-38. In the actual comparison, looking at the 1-minute chart and adding up the corresponding MACD values for those two segments is too cumbersome, so you can look at the 5-minute chart instead. Here, the 5-minute chart is provided. On the chart, the two corresponding comparison segments are already marked, and the red arrow below the MACD corresponds to the pullback moment, which corresponds to when the last 1-minute hub was forming. The comparison between the two preceding segments is extremely textbook—please study it carefully.
Actually, as long as the basic concepts are clear, this kind of analysis is not difficult to do in real time. Here I must point something out: the position marked 38 on the 1-minute chart is indicated with a red arrow, and obviously, that's not the highest position. Why? Nobody said that the end position of a segment must be the highest or lowest point. The key is to have at least three strokes, because from 37 to the highest position, there aren't three strokes, so you can't consider the line segment as complete. But at the 1-minute level, segment 37-38 does end at the highest position—why? The existence of line segments is to standardize the chart. Just as when looking at 1-minute trend type overlaps within a 5-minute hub, the entire fluctuation range of the trend type is considered together—the principle is the same.
1-minute chart
5-minute chart