Teaching You to Trade Stocks 62: Fractals, Strokes, and Line Segments
2007/6/30 9:49:51
Idling in a hotel room waiting for the debauchery to start at 10, half an hour—finding a boy toy for some action would be a bit tight on time. Better to write a main post for you all, do a lesson, and use up some of your weekend debauchery time.
I took a look and saw a netizen named Stone Monkey who wrote a post explaining what line segments are. His understanding is decent but not rigorous enough. In fact, this ID's line segments can be defined with the utmost precision. This ID's theory is essentially a set of geometric theory—its validity is like geometry itself. Of course, this ID's theory has moments of failure and imprecision, but the prerequisite for that is geometric foundations failing and becoming imprecise. If you don't understand this point, you don't understand this ID's theory. Here, let me bring forward content that was meant for later lessons.
The definitions and diagrams below apply to K-line charts of any timeframe. First look at figures 1 and 2 in the diagram. The small line segments represent K-lines (candlesticks). Here we don't distinguish between bullish and bearish candles—we only look at the highs and lows of the K-lines.
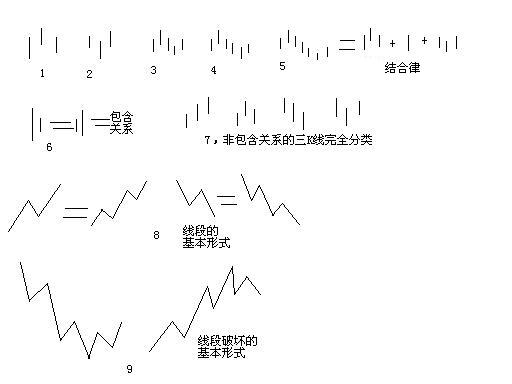
Like figure 1, where the second K-line's high is the highest among the highs of three adjacent K-lines, and its low is also the highest among the lows of three adjacent K-lines—this ID gives this a definition called top fractal. Figure 2 is called a bottom fractal: the second K-line's low is the lowest among the lows of three adjacent K-lines, and its high is also the lowest among the highs of three adjacent K-lines. If you can't understand the definition, just look at the diagram and you'll get it. If even something this visual is beyond you, go join Kong the Man's company.
The highest point of a top fractal is called that fractal's top, and the lowest point of a bottom fractal is called that fractal's bottom. Since the low of a top fractal and the high of a bottom fractal have no significance, the top of a top fractal and the bottom of a bottom fractal can simply be called the top and the bottom respectively. In other words, when we say "top" and "bottom" from now on, we're referring to the top of a top fractal and the bottom of a bottom fractal, respectively.
Two adjacent tops and bottoms constitute a stroke (bi). A stroke means that all other fluctuations between a top and a bottom can be ignored and not counted. But note—it must be adjacent tops and bottoms; if there are several in between, it doesn't count. And a so-called line segment consists of at least three strokes. But there's a subtle distinction to clarify here: because the associative law must be followed, in a case like figure 3, where the top and bottom must share a K-line, this violates the associative law, so it doesn't count as a stroke. And figure 4 has just a top and bottom with no other K-lines in between—generally speaking, this also shouldn't count as a stroke. Figure 5 is the most basic form of a stroke: there's still one K-line between the top and bottom. In practical analysis, the minimum requirement for counting something as a stroke is that there must be at least one K-line between the top and bottom.
Of course, in real charts, some complex relationships arise. Adjacent K-lines can exhibit what's shown in figure 6—an inclusion relationship, where one K-line's high and low are entirely within the range of another K-line. In such cases, it can be handled as follows: when moving upward, take the highest point of the two K-lines as the high, and the higher of the two K-lines' lows as the low, thus merging the two K-lines into a new K-line. Conversely, when moving downward, take the lowest point of the two K-lines as the low, and the lower of the two K-lines' highs as the high, thereby merging the two K-lines into a new K-line. After this processing, all K-line charts can be transformed into charts without inclusion relationships.
Figure 7 then gives a complete classification of all possible combinations of three adjacent K-lines in charts that have been processed to have no inclusion relationships. Among these, 2 and 4 are top fractals and bottom fractals respectively, 1 can be called a rising K-line, and 3 can be called a falling K-line. So, an upward stroke, by the associative law, must be: bottom fractal + rising K-line(s) + top fractal. A downward stroke is: top fractal + falling K-line(s) + bottom fractal. Note that the rising and falling K-lines here don't have to be exactly 3—they can be any number, as long as they maintain the definition. Of course, simply, they can also be 1 or 2, as long as it doesn't violate the associative law and definitions.
As for figure 8, it's the most basic form of a line segment, and figure 9 shows line segment destruction—one form of combining two line segments. Some people might say this looks like Elliott Wave Theory. What's surprising about that? This ID's theory can rigorously derive all conclusions of Elliott Wave Theory, and moreover can point out all its deficiencies. Elliott Wave Theory has absolutely no comparability with this ID's theory. Not just Elliott Wave, all theories about the stock market that relate to chart patterns—this ID's theory can rigorously derive them, because this ID's theory is the most foundational theory about price chart patterns. Nobody can escape it.
Can't waste any more words—the car is here below, debauchery begins. You all go be decadent too.