Teaching You to Trade Stocks 47: One-Night Stand Market Analysis
2007/4/20 8:51:58
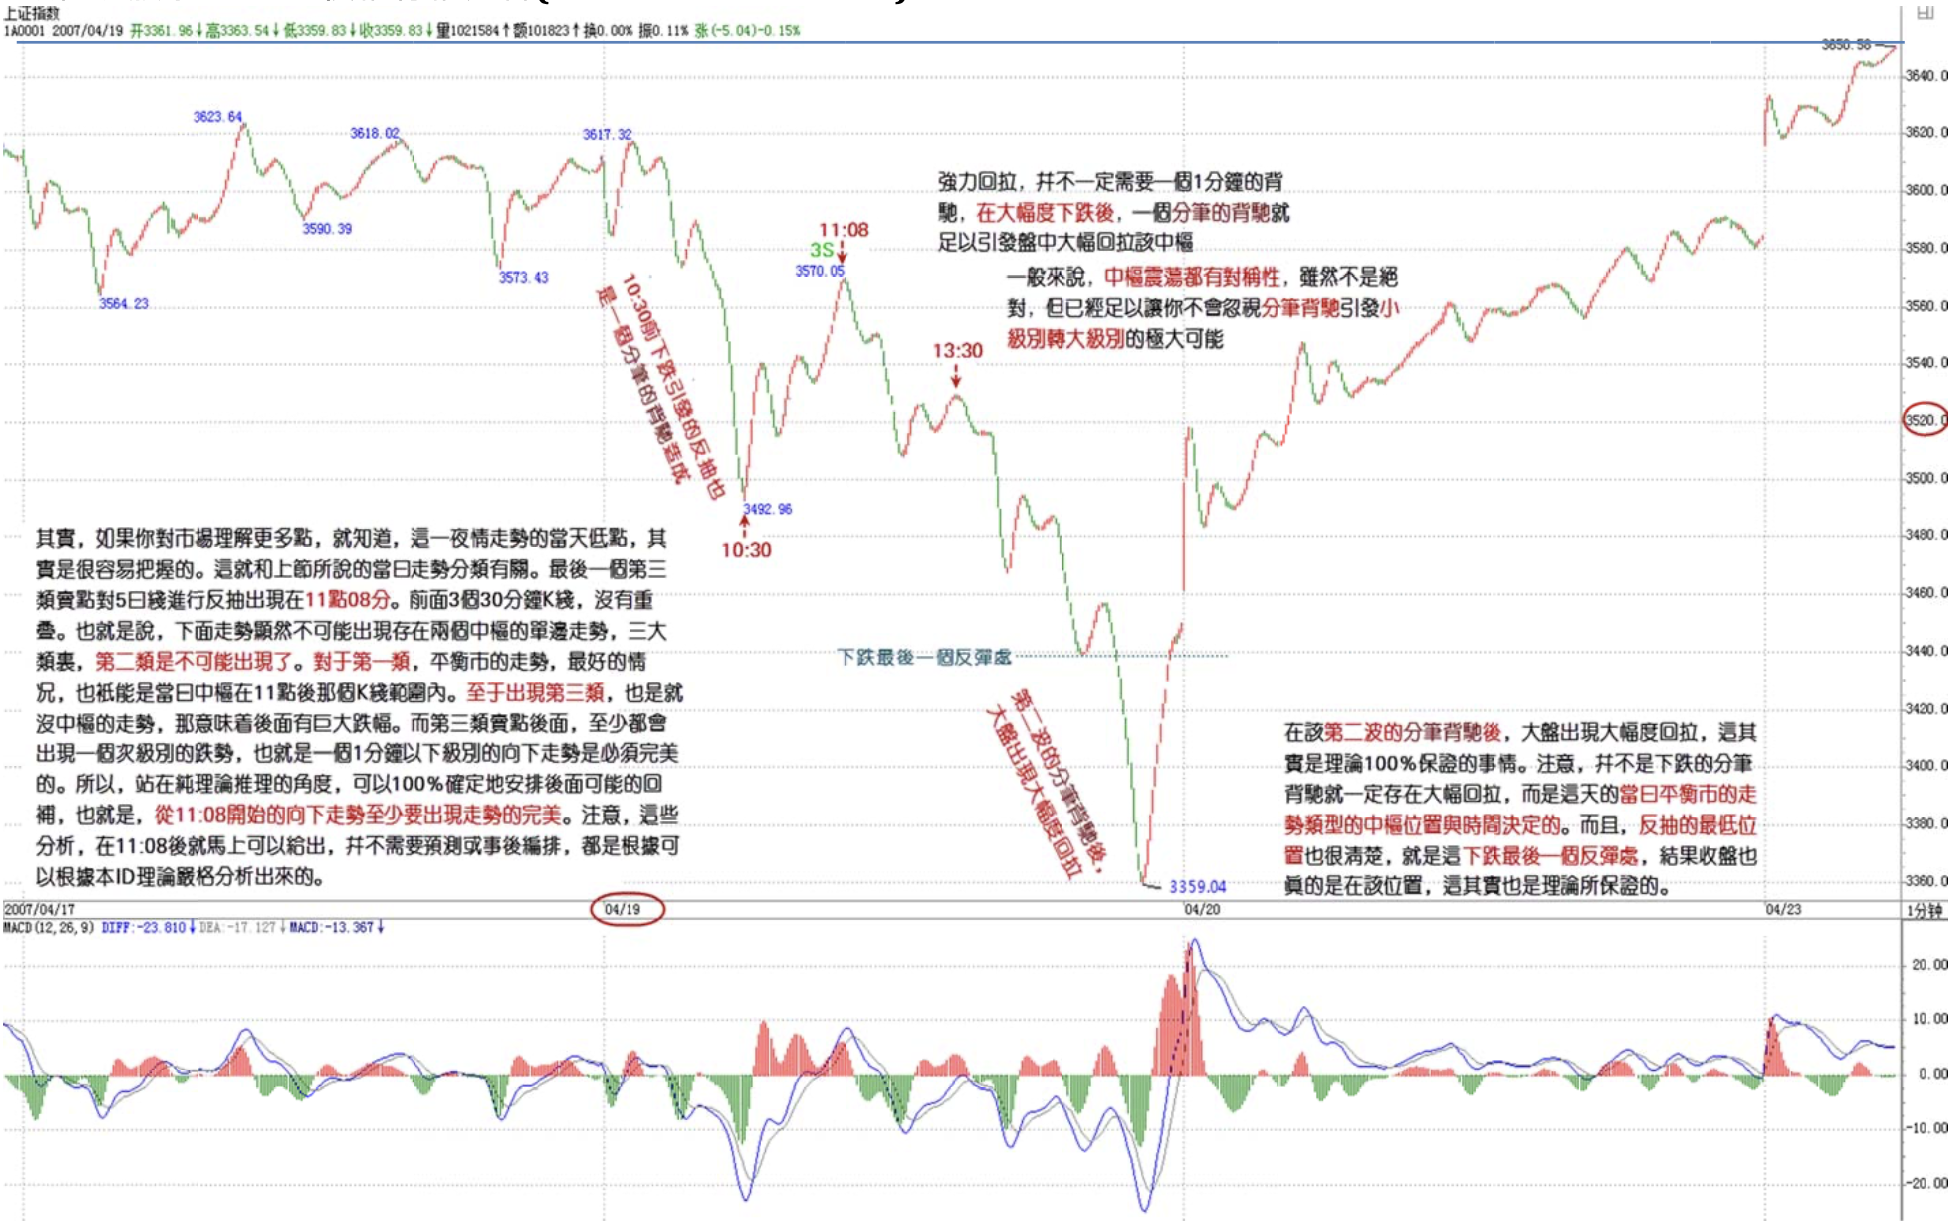
A very obvious principle: the more you understand the market, the more precisely you can grasp movements. For example, in yesterday's (2007/04/19) one-night stand market of 2007, after breaking below the 5-day moving average, there was a retest that at exactly 11:08 constituted a third-type sell point against the previous day's hub — this was the last, theoretically guaranteed escape opportunity. After that point, everything that followed had nothing to do with this ID's theory. In a decline, every sell other than at the very last position is correct, but that has nothing to do with this ID's theory — it's essentially gambling, betting that it's not the last position. Of course, gambling is also a method, but that kind of grasp is not within the scope of this ID's discussion.
Someone might ask: even if it breaks below the 5-day moving average, couldn't it quickly pull back up? Indeed, that possibility exists, but whether the market selects that possibility is a present-moment matter. If it quickly pulls back up, there will naturally be a buy point that conforms to this ID's theory. Just let the market make its own selection. Since you've already sold, wait patiently. Of course, this relates to the precision of analysis. Some people analyze insufficiently and will buy back too early — that's normal. Those with better technique should naturally enjoy more precise buy points. But rhythm is important. From the perspective of small-level operations, even if you buy back too early, it's still better than not having exited and just watching helplessly. If you bought back too early, summarize the experience later and improve your technical precision.
However, it must be emphasized that everything above applies to smaller capital operating at smaller levels. If you're operating at the daily level, these oscillations need not be entertained at all. If truly operating at the daily level, you should have held from the 1,000s all the way to now, because a daily-level sell point hasn't appeared — wait until it does. For large capital operating at the weekly level, that's even more irrelevant. Additionally, this uses the index as a representative to explain a methodology; individual stocks are analyzed identically on their own charts.
Actually, if you understand the market a bit more, you'd know that the intraday low of this one-night stand movement was actually quite easy to grasp. This relates to the daily movement classification discussed in the previous lesson. The last third-type sell point's retest of the 5-day moving average occurred at 11:08. The first 3 thirty-minute K-lines had no overlap. This means the movement obviously couldn't produce a two-hub unilateral trend — the second of the three major categories was eliminated. For the first category, a balanced market, the best scenario would still only have the day's hub within the K-line range after 11:00. As for the third category — no hub at all — that would mean enormous subsequent decline. After the third-type sell point, at minimum there must be a completed sub-level downward movement, meaning a downward movement below the 1-minute level must be completed. So from a purely theoretical reasoning standpoint, one can 100% definitively plan for possible buyback — starting from 11:08, the downward movement must at least show completion. Note, this analysis could be given immediately after 11:08, requiring no prediction or post-hoc arrangement — it can all be rigorously analyzed based on this ID's theory.
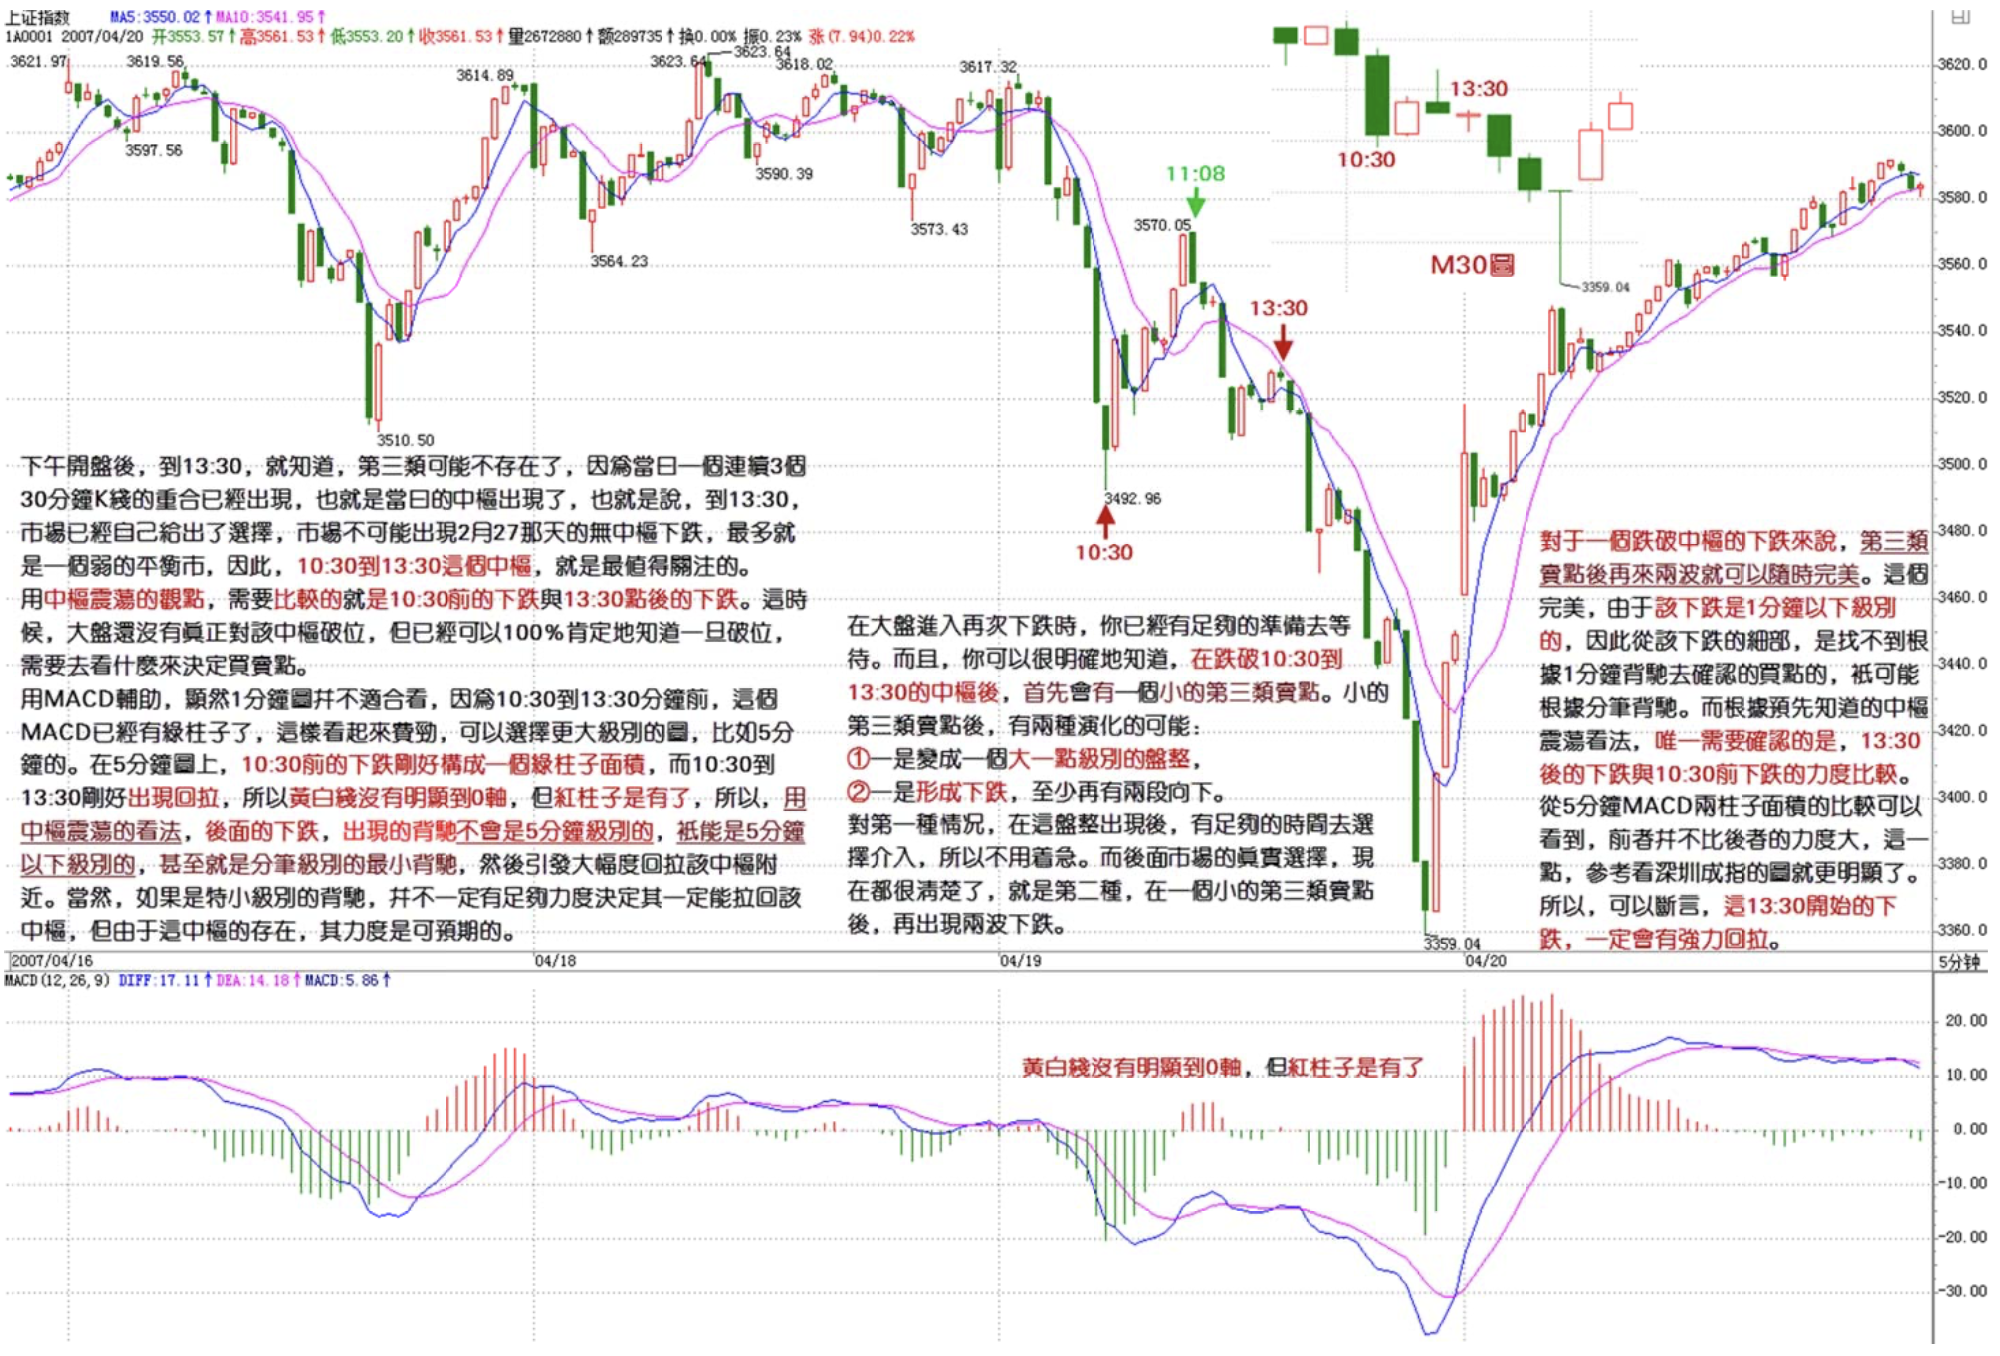
After the afternoon open, by 13:30, you know the third category probably doesn't exist, because an overlap of 3 consecutive thirty-minute K-lines for the day had already appeared — the day's hub had formed. That is, by 13:30, the market had given its own selection: the market couldn't produce a hubless decline like February 27th. At most it would be a weak balanced market. Therefore, the hub from 10:30 to 13:30 was the most critical focus. Using hub oscillation analysis, what needed to be compared was the decline before 10:30 versus the decline after 13:30. At this point, the market hadn't truly broken below this hub, but you could already know with 100% certainty what to look at once a breakdown occurred, to determine buy and sell points. Using MACD as an aid, the 1-minute chart obviously wasn't suitable because there were already green histogram bars before 10:30 to 13:30, making it cumbersome. A larger timeframe could be selected — the 5-minute chart. On the 5-minute chart, the decline before 10:30 formed exactly one green histogram area, while 10:30 to 13:30 produced a pullback, so the MACD lines didn't clearly reach the zero axis, but red histograms did appear. So using hub oscillation analysis, any subsequent divergence wouldn't be at the 5-minute level — it could only be at a level below 5-minute, possibly even tick-level minimal divergence, then triggering a strong pullback toward the hub. Of course, if it's a very minor-level divergence, it wouldn't necessarily have enough force to guarantee a full pullback to the hub, but given this hub's existence, the force is predictable.
The above analysis could be given 100% definitively before the market truly continued breaking down after 13:30 — it's all pure logical reasoning, completely unrelated to any prediction. Suppose you already exited at the 11:08 third-type sell point and you're a small-level operator, then what you need is to buy back. With the above analysis, you can wait patiently and compare the force on the 5-minute chart. Moreover, you should know that a strong pullback doesn't necessarily require a 1-minute divergence — after a major decline, even a tick-level divergence can be sufficient to trigger a significant intraday pullback to the hub level. Especially since the rebound triggered by the pre-10:30 decline was also caused by a tick-level divergence, and generally hub oscillations have symmetry. Although not absolute, this is enough to ensure you won't overlook the very high probability of tick-level divergence escalating into a larger-level reversal. (Tick-level divergence can generally be aided by the length of the 1-minute MACD histogram bars.)
When the market entered its next decline, you already had sufficient preparation to wait. Moreover, you could clearly know that after breaking below the 10:30–13:30 hub, there would first be a small third-type sell point. After the small third-type sell point, there are two possible evolutions: one is becoming a slightly larger consolidation, and the other is forming a decline with at least two more downward segments. For the first scenario, after this consolidation appears, there's plenty of time to choose entry, so no rush. And the market's actual choice, now clear to everyone, was the second: after a small third-type sell point, two more waves of decline.
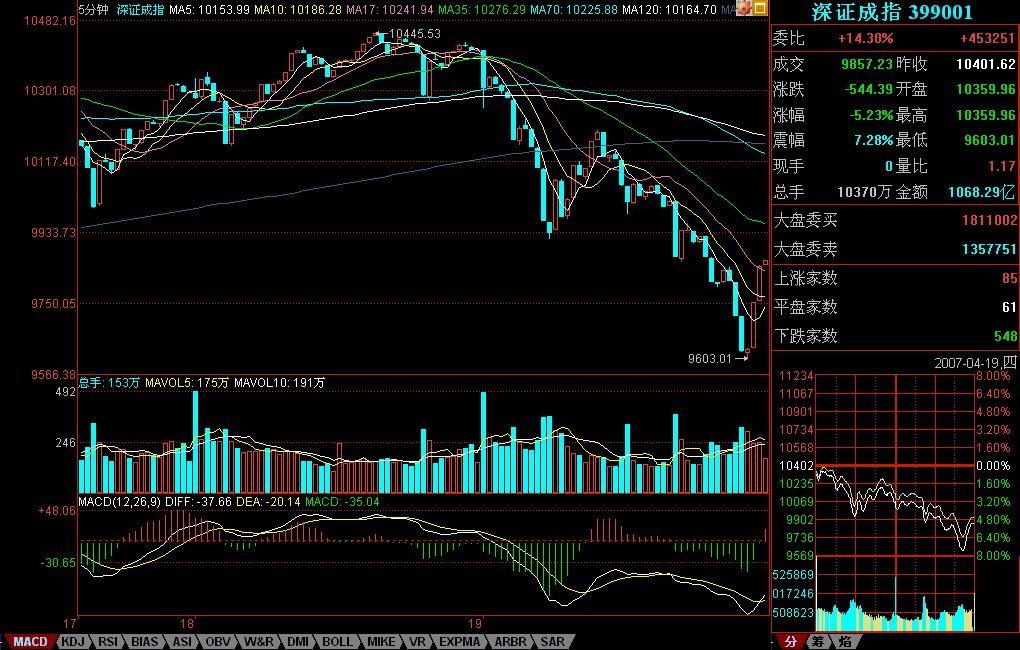
For a decline that breaks below a hub, after the third-type sell point and two more waves, it can become complete at any time. Because this decline is below the 1-minute level, from its details, you cannot find a buy point confirmed by 1-minute divergence — you can only use tick-level divergence. And based on the pre-established hub oscillation analysis, the only thing needing confirmation was the force comparison between the decline after 13:30 and the decline before 10:30. From the comparison of the 5-minute MACD histogram areas, the former wasn't greater in force than the latter. This is even more evident when referencing the Shenzhen Component Index chart (see image below). So one can conclude that the decline starting from 13:30 would definitely produce a strong pullback.
In the actual movement, after the tick-level divergence in that second wave (look at the 14:43 MACD histogram bar on the 1-minute chart — that K-line is also a so-called morning star), the market produced a massive pullback. This was actually something 100% guaranteed by theory. Note, it's not that tick-level divergence in any decline necessarily produces a massive pullback — rather, it's the day's balanced-market hub position and timing that determined this. Moreover, the minimum rebound target was also very clear — the last bounce point in the decline — and the close did indeed end at that position. This too was guaranteed by theory.
Of course, if you know a bit more, the determination of that final position can be very precise. First, the Bollinger Band middle track on the daily chart and the 20-day moving average were both at 3351 points. By conventional technical analysis, this is a strong support position, and the actual low was 3358 points. Additionally, the lower track of the descending channel on the 1-minute chart was also at that position. With several factors aligning, the rebound at that position was completely within grasp.
The subsequent movement was simple. The key was that hub. Since tick-level divergence only guarantees a retest to the last bounce point of the decline, and the close had already reached there, and tick-level divergence doesn't 100% support a full pullback into the hub, theoretically there still absolutely existed the possibility of another decline producing a larger-level divergence before pulling back. Of course, it could also go straight up — this must be selected by the market. But regardless, that hub was the critical benchmark before a new hub formed. And the position of April 20th's intraday hub would determine the possible evolution of future movements.
The above is an analytical template. All this analysis can be conducted in real-time — it involves no prediction whatsoever. Every step of the market's present-moment movement provides corresponding analytical choices. For those familiar with this ID's theory, it actually takes only 1 second to analyze the current situation clearly and then take the most correct action. However, it must be emphasized that this is only to illustrate how to analyze — it is not encouraging everyone to do this kind of ultra-short-term trading. Of course, if you can even complete analysis this precise in real-time and use it to guide your operations, then operations at larger levels would be even less of a problem. With T+0, for small capital, this would have absolute practical significance. Of course, under T+1, even if you bought at 3358, there's still the risk of not being able to exit the next day. With T+0, that risk wouldn't exist, because for ultra-short-term operations, you can exit at the pullback to the last bounce position, then look at the market's next selection to choose the next buy point. Once again: this is only to explain the theory, not to say everyone should operate at such small levels. The analysis at larger levels is identical. Remember this.
Of course, if you have a deeper understanding of daily movement auxiliary judgment, then using intraday hedging and similar methods to reduce costs is also achievable. But this can only continue in the next lesson. When you have time, study the movements of individual stocks whose rhythms differ from the market's, and feel how the market — as an external factor — can only affect stocks when the stock's own internal causes are present. For example, the market's decline might actually construct second- or third-type buy points for certain stocks, while stocks in strong upward hub-extension movements might simply ignore the market altogether. Also look at stocks that declined with the market — they originally already had sell points, and the market merely amplified the magnitude of movement from sell point toward buy point, but wouldn't change the internal logical structure of sell and buy points. Understanding this will deepen your comprehension of this ID's theory.
I have a meeting right after today's close, so the closing analysis can only be written at 9:30 PM tonight. Sorry.
Appendix: Squeezing in a few lines. I have two engagements tonight and won't be back by 9:30.
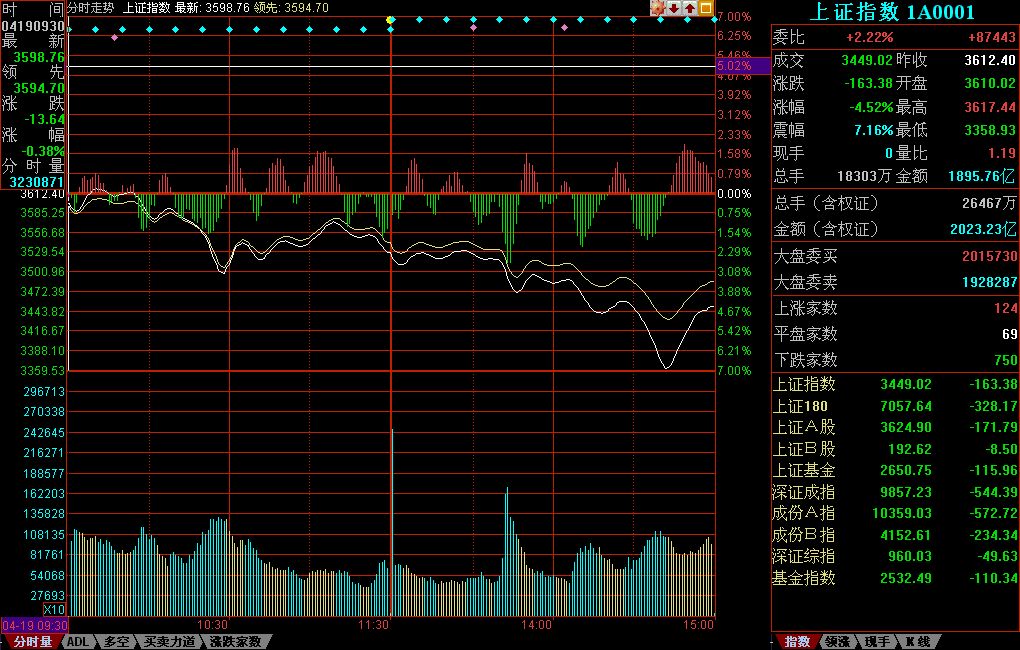
Today's market movement was perfectly normal. Today was virtually a hubless upward movement. As I said yesterday, as long as it re-stabilizes above 3520 today, the original trend continues. The first hour today confirmed this. If this kind of movement still scares you, that's a mindset problem. Walking around like a frightened bird all day — how do you participate in the market?
Of course, to give slightly longer-term people some peace of mind, watch the 5-week moving average. As long as that line isn't broken, slightly longer-term people can basically not watch the market. For short-term though, the re-stabilization above the 5-day moving average still needs to be confirmed — that's next week's main task. If it can't stabilize, then continued oscillation. For short-term, just watch the 5-day moving average.
Of course, if your technique is better, you can continue using hub oscillation methods to analyze market movements. I'm about to go into a meeting, so I won't say more. Please study this article thoroughly — the method is the same.
Have a wonderful indulgent weekend.
Replies
缠中说禅 2007/4/20 15:25:57
Squeezing in a few lines. I have two engagements tonight and won't be back by 9:30.
Today's market movement was perfectly normal. Today was virtually a hubless upward movement. As I said yesterday, as long as it re-stabilizes above 3520 today, the original trend continues. The first hour today confirmed this. If this kind of movement still scares you, that's a mindset problem. Walking around like a frightened bird all day — how do you participate in the market?
Of course, to give slightly longer-term people some peace of mind, watch the 5-week moving average. As long as that line isn't broken, slightly longer-term people can basically not watch the market. For short-term though, the re-stabilization above the 5-day moving average still needs to be confirmed — that's next week's main task. If it can't stabilize, then continued oscillation. For short-term, just watch the 5-day moving average.
Of course, if your technique is better, you can continue using hub oscillation methods to analyze market movements. I'm about to go into a meeting, so I won't say more. Please study this article thoroughly — the method is the same.
Have a wonderful indulgent weekend.
Heading out. Goodbye.
缠中说禅 2007/4/20 8:53:33
I have a meeting right after today's close, so the closing analysis can only be written at 9:30 PM tonight. Sorry.
Heading out. Goodbye.