Teaching You to Trade Stocks 20: Chan Theory Trend Hub Level Expansion and the Third Type of Buy/Sell Points
2007/1/5 15:23:22
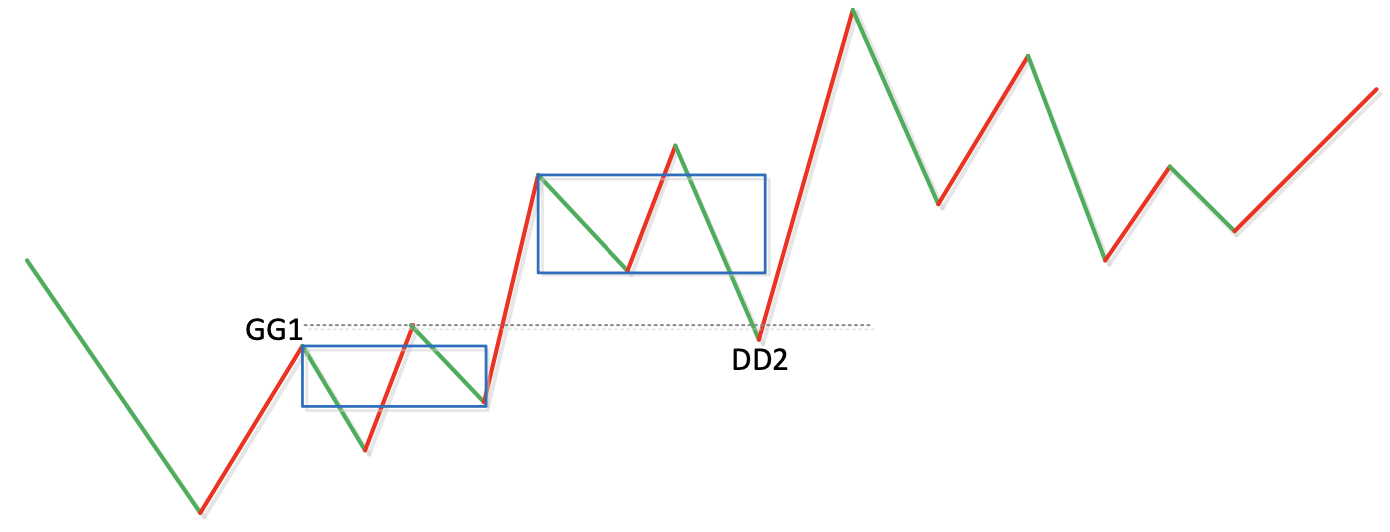
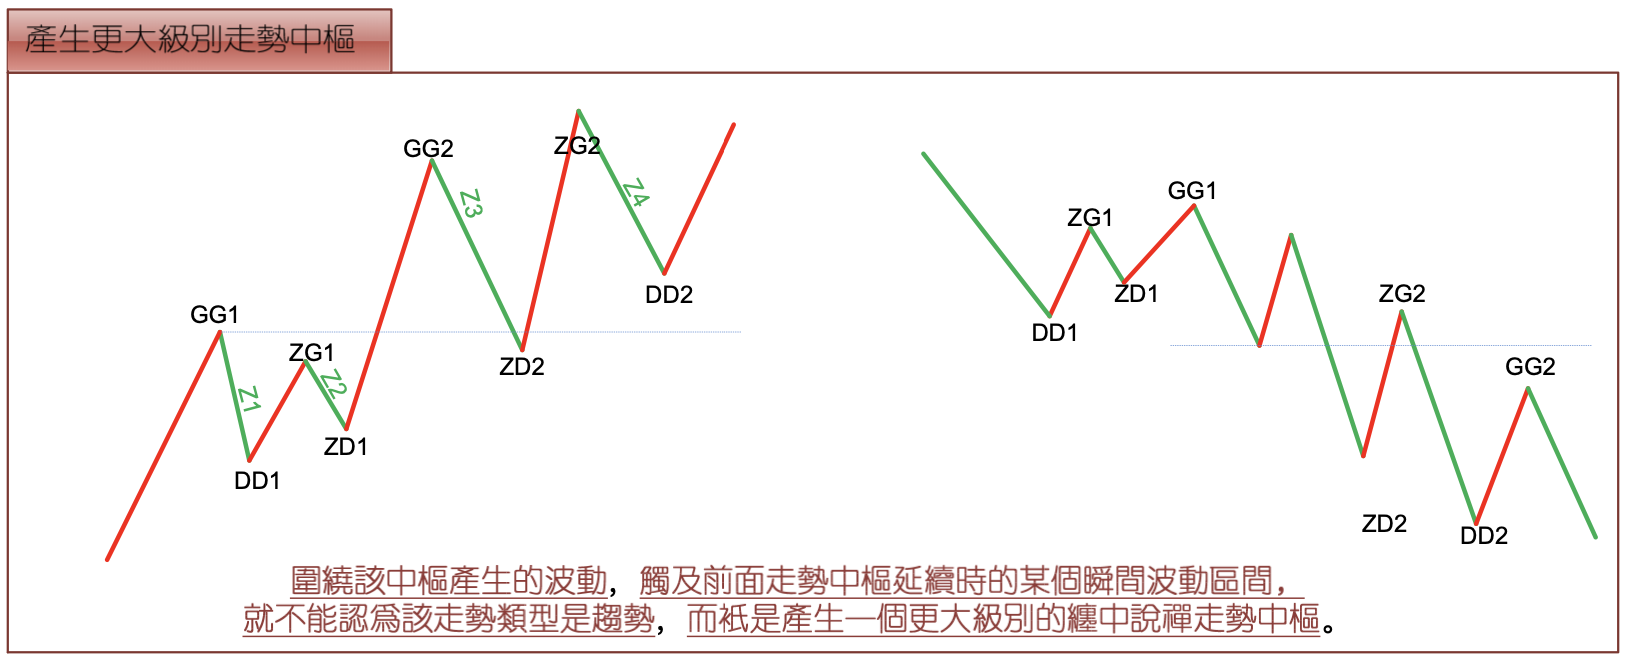
It has been clearly stated previously that a Chan Theory trend hub is determined by the overlapping portion of the first three consecutive sub-level trend types. The subsequent trend has two possible situations: 1. Extension of that trend hub. 2. Generation of a new same-level trend hub. In a trend, same-level front and rear Chan Theory trend hubs cannot have any overlap whatsoever — this includes any overlap between any momentary fluctuations generated around the trend hubs. Therefore, if the overlapping interval of three consecutive sub-level trend types does not overlap with the preceding trend hub, but fluctuations generated around that hub touch some momentary fluctuation zone during the extension of the preceding trend hub, then this cannot be considered a trend — it only produces a larger-level Chan Theory trend hub.
Here, two situations must be strictly distinguished. First: the trend hub and its extension. In this case, all front and rear sub-level fluctuations generated around the trend hub must have at least one that touches the hub's zone. Otherwise, a new overlapping portion of three consecutive sub-level trend types would necessarily emerge that departs from the original trend hub, contradicting the hub's continuation. Second: before a trend hub is completed, its fluctuations touch some momentary fluctuation zone of the previous trend hub or its extension, thereby producing a larger-level trend hub.
A simple example can distinguish the above situations. For instance, if a stock goes straight to the daily limit immediately at the open, that can only be counted as an extension of a hub at the 1-minute level. No matter how long this extension lasts, it cannot possibly produce a larger-level trend hub. If the stock continues to open at the limit the next day, then it forms a trend at the 1-minute level. This trend can extend indefinitely, but as long as it only forms 1-minute level hubs, no matter how many consecutive limit-up days there are, it's insufficient to form even a 5-minute hub — unless there are moments when the limit is opened during this period. There's also a special case with so-called manipulated stocks: if a market maker has a particular quirk and trades only once per day at the same price every day, this also only forms a 1-minute hub, and larger-level hubs cannot form.
In other words, hub extension and the continuous generation of new hubs with their respective surrounding fluctuations not overlapping to form a trend — in these two situations, it is absolutely impossible to form a larger-level trend hub. To form a larger-level trend hub, one must necessarily adopt the third method: the fluctuations generated after a new same-level trend hub overlap with some fluctuation zone around the previous hub. From this, an important theorem can be immediately derived:
Chan Theory Trend Level Continuation Theorem 1: Before a larger-level Chan Theory trend hub is generated, that level's trend type will continue. That is, it can only be a continuation of consolidation or trend that possesses only that level's Chan Theory trend hub.
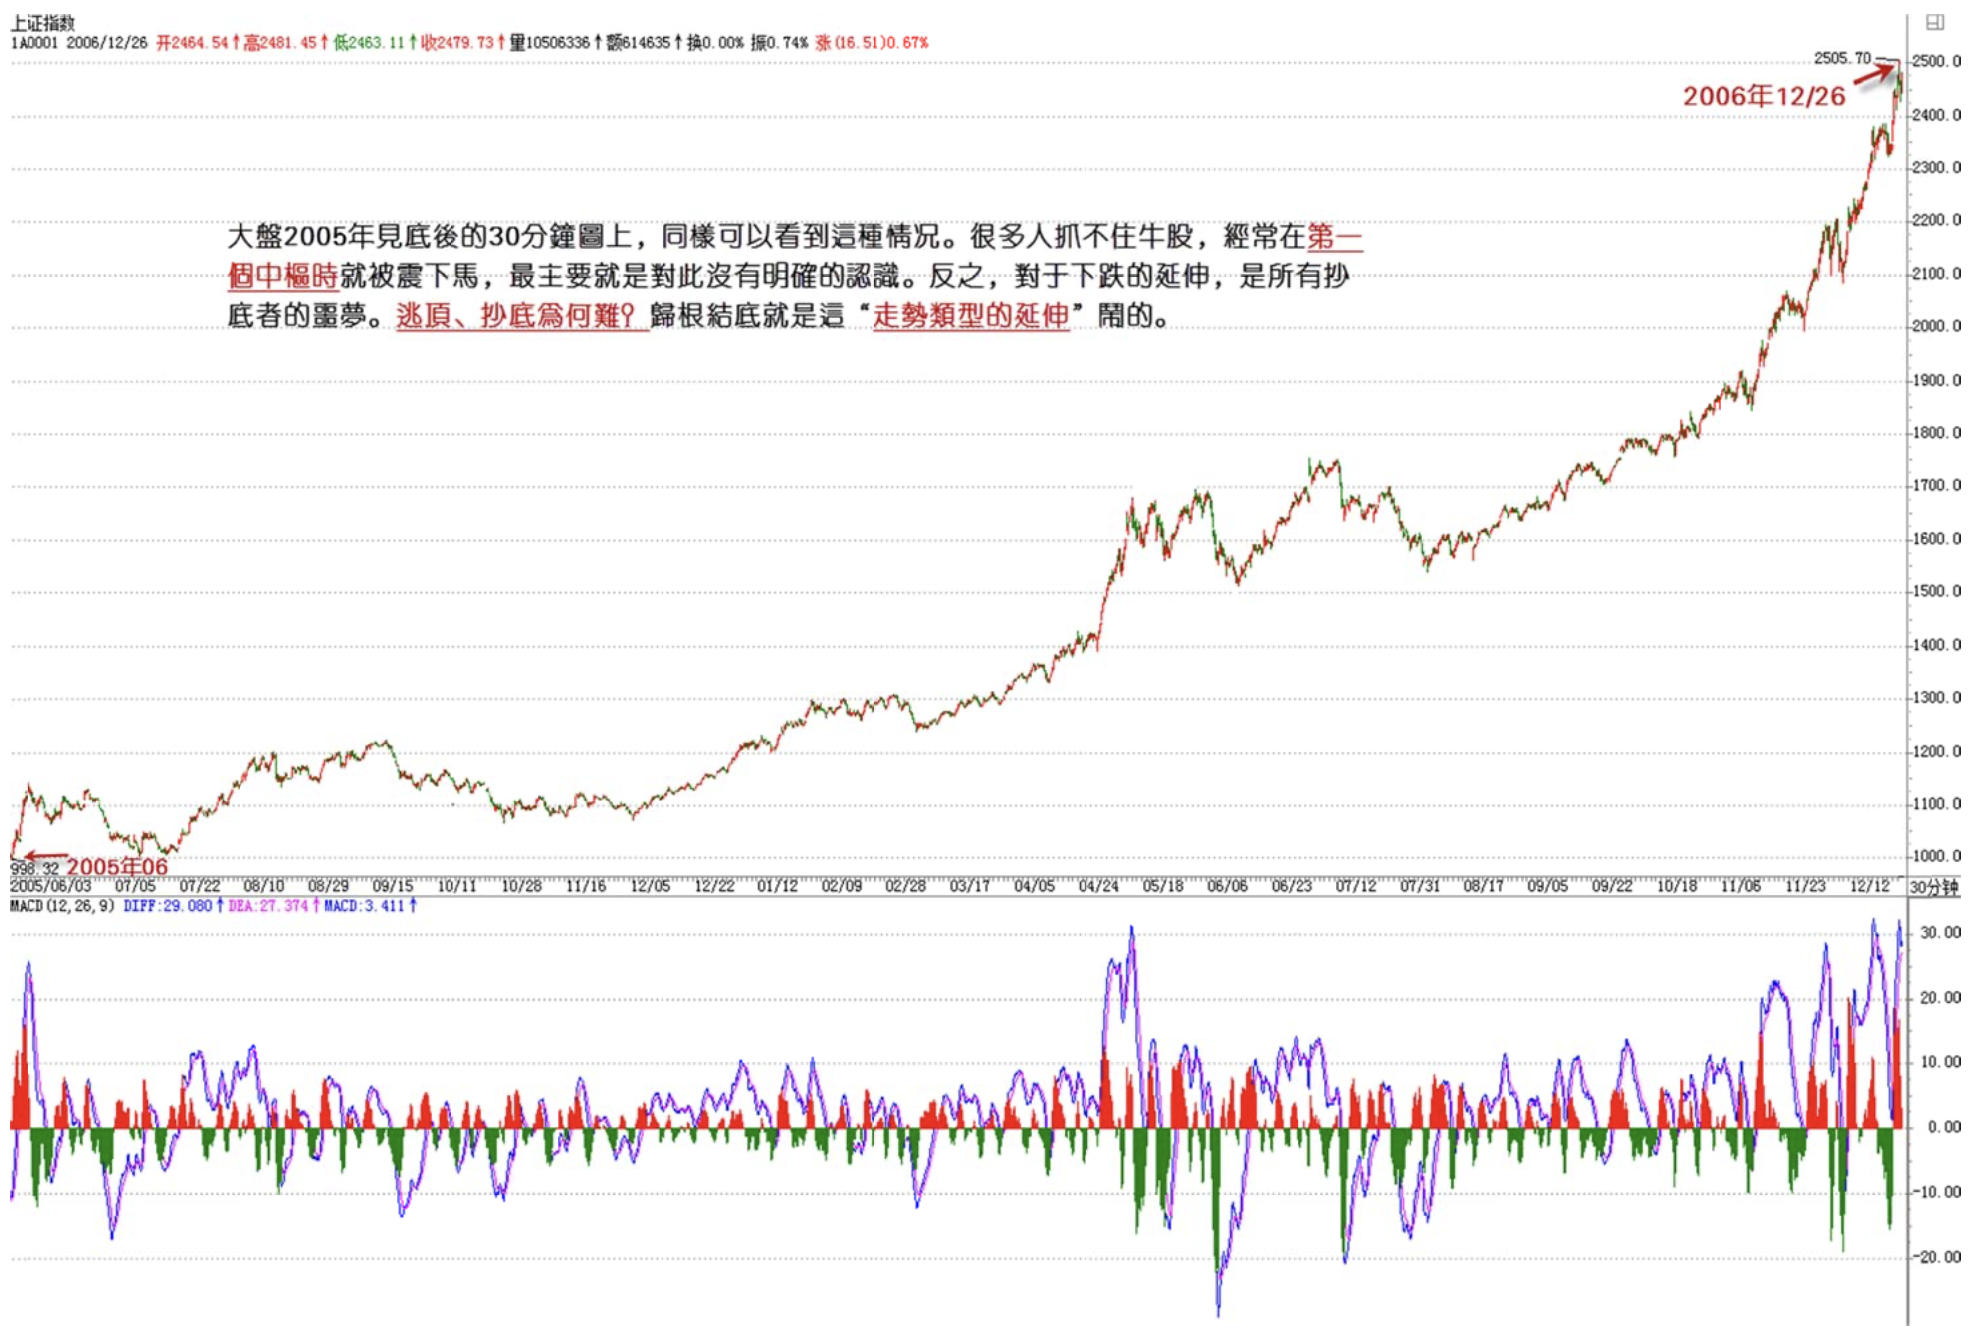
Looking at last year's index movement, one can see the importance of this theorem. Many people keep saying, "How can it still be rising after gaining so much?" Understanding this theorem, you'll know that for this market to fall, the current trend that has at most only produced daily-level trend hubs cannot possibly end before a weekly-level trend hub appears. Moreover, from the trend starting in August last year, not even a daily trend hub has formed — at most only 30-minute ones. To end this kind of trend, a daily hub must first form. Understanding this theorem, you won't scare yourself every day. From Theorem 1, a more important theorem can very simply be proven, giving a more precise, advance delineation of trend change:
Chan Theory Trend Level Continuation Theorem 2: A larger-level Chan Theory trend hub is generated if and only if the fluctuation zones generated around two consecutive same-level Chan Theory trend hubs overlap.
A metaphor here will aid understanding: a Chan Theory trend hub is like a star, and together with the planets orbiting that star, they form a stellar system. For two same-level stellar systems to form a larger-level system, at minimum their outer planets must first interact — that's what Theorem 2 is about.
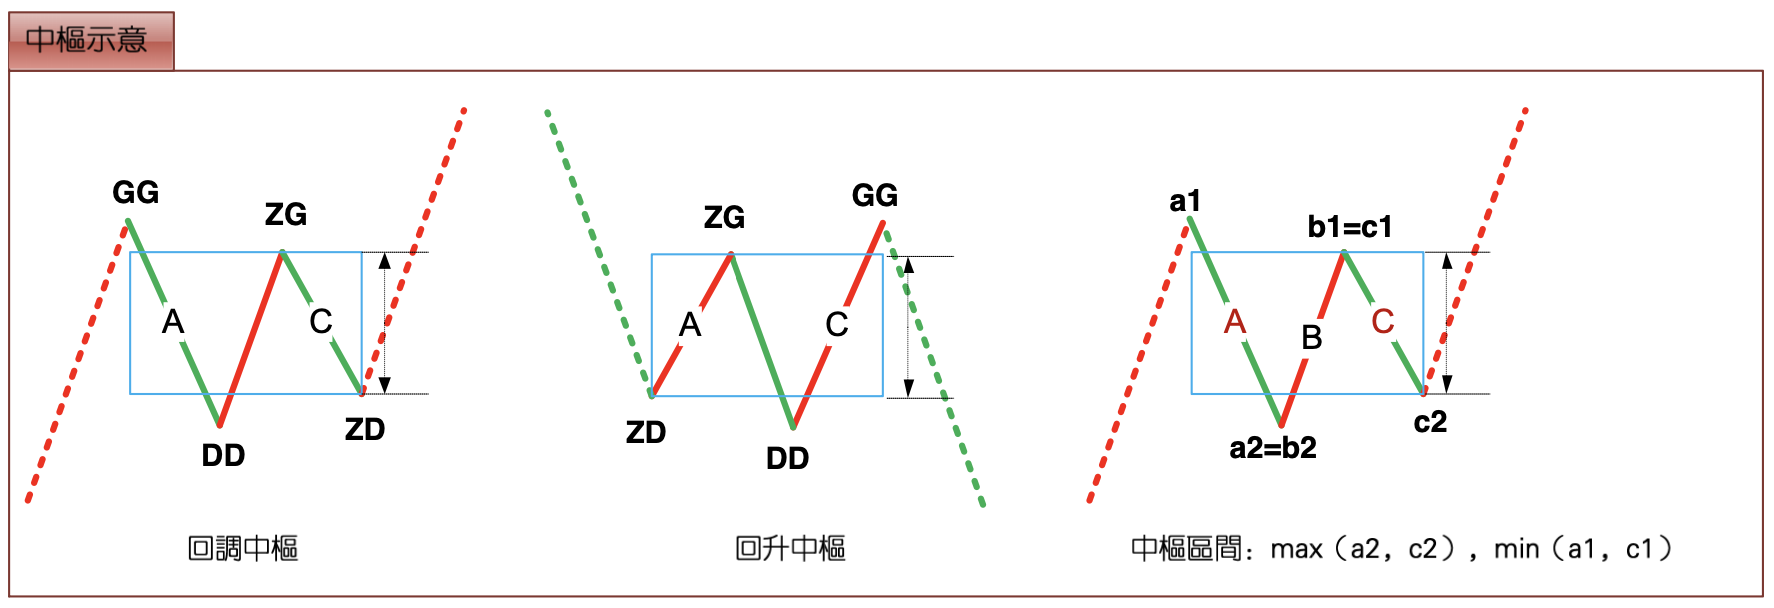
With the above theorems, the hub problem can be discussed very precisely: According to the mathematical expression for a trend hub: A, B, C, with their respective high and low points being a1\a2, b1\b2, c1\c2, the hub's zone is [max(a2,b2,c2), min(a1,b1,c1)]. Hub formation is nothing more than two kinds: one formed through a rally, and one formed through a pullback. For the first type, a1=b1, b2=c2; for the second type, a2=b2, b1=c1. But regardless of which case, the hub formula can be simplified to [max(a2,c2), min(a1,c1)]. Obviously, segments A and C have directions consistent with the hub's formation direction. From this it can be seen that in the formation and extension of a hub, it is determined by the overlapping intervals of the sub-level trend types whose direction is consistent with the hub's formation direction. For example, a hub formed through rallying is determined by the overlapping intervals of upward sub-level trend types, and vice versa. For convenience, hereafter all these sub-level trend types consistent with the hub's direction will be called Z-segments, recorded in chronological order within the hub as Zn, etc., with their respective high and low points recorded as gn and dn. Define four indicators: GG=max(gn), G=min(gn), D=max(dn), DD=min(dn), where n traverses all Zn in the hub. Specifically, further define ZG=min(g1, g2), ZD=max(d1, d2). Obviously, [ZD, ZG] is the zone of the Chan Theory trend hub, from which the following theorem emerges:
Chan Theory Trend Hub Central Theorem 1: The extension of a trend hub is equivalent to any interval [dn, gn] overlapping with [ZD, ZG]. In other words, if there exists a Zn such that dn>ZG or gn<ZD, then a higher-level trend hub or trend and its continuation must necessarily emerge.
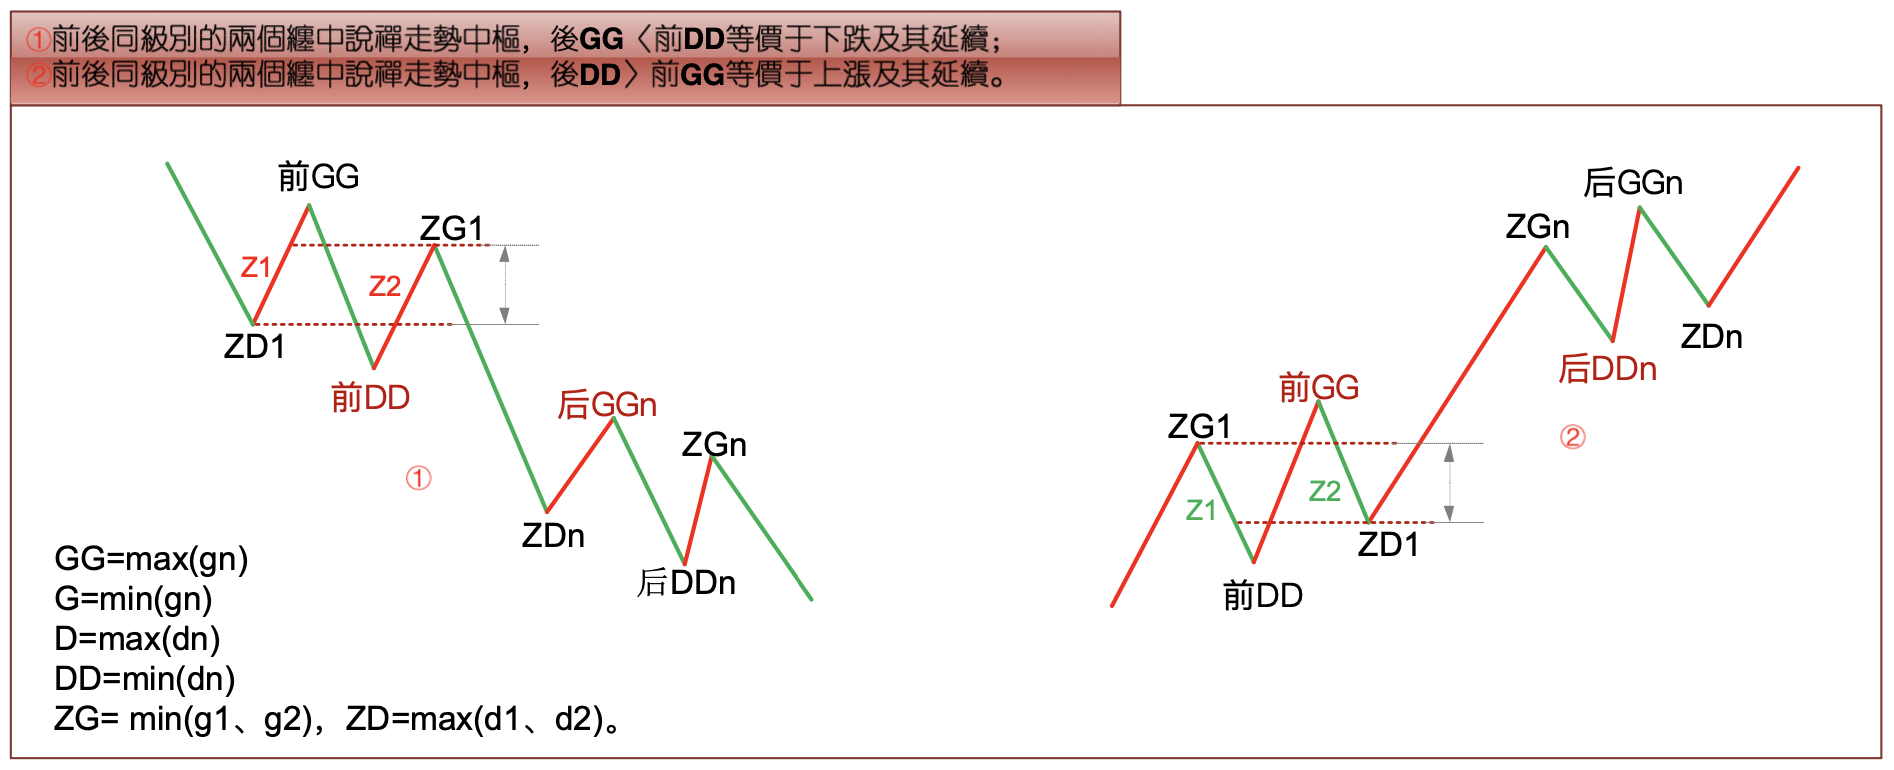
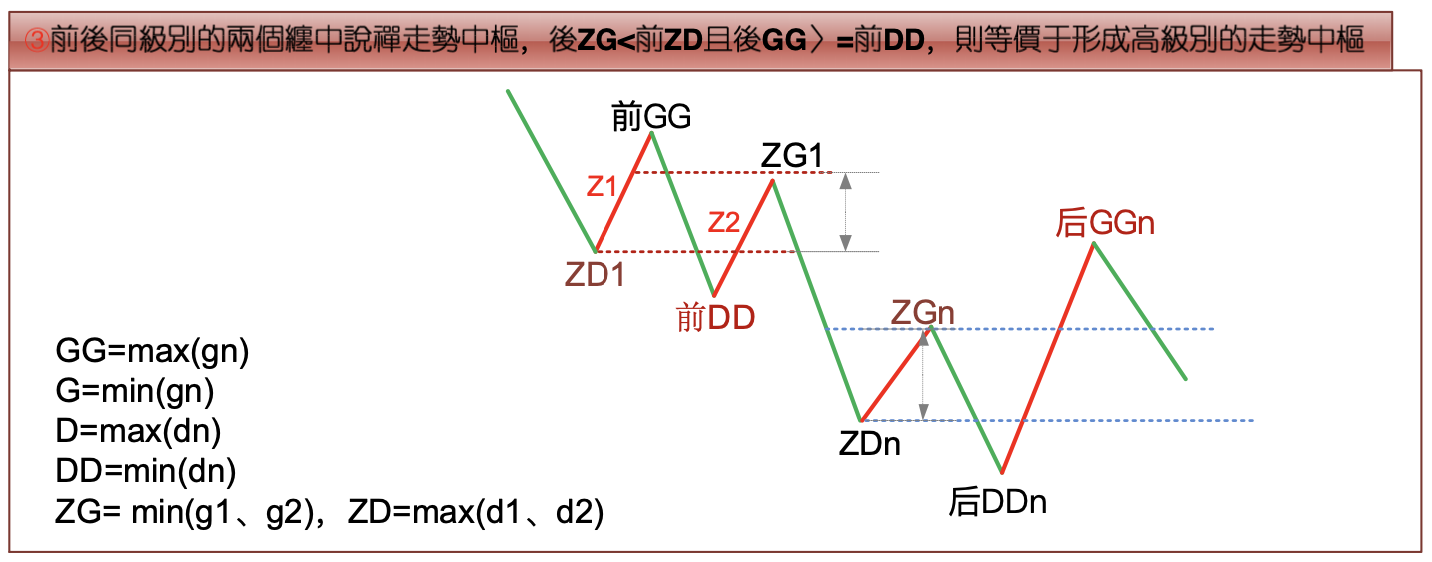
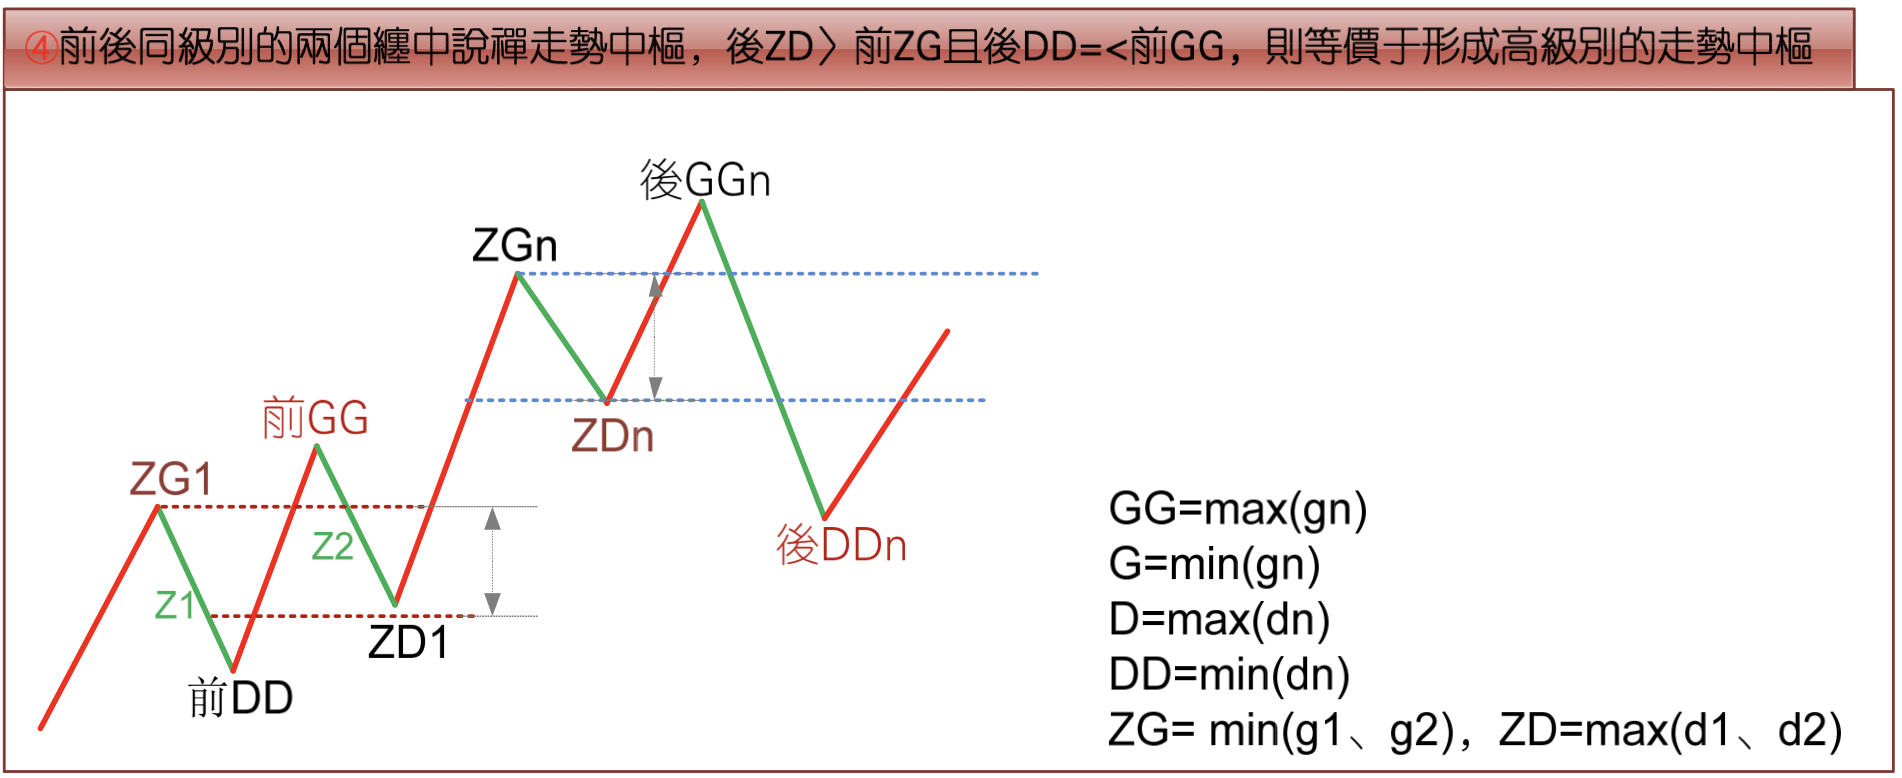
Chan Theory Trend Hub Central Theorem 2: For two same-level Chan Theory trend hubs front and rear: rear GG < front DD is equivalent to a downtrend and its continuation; rear DD > front GG is equivalent to an uptrend and its continuation. Rear ZG < front ZD and rear GG >= front DD, or rear ZD > front ZG and rear DD =< front GG, is equivalent to the formation of a higher-level trend hub.
From Theorem 1, the Third Type Buy/Sell Point Theorem can be derived: When a sub-level trend type departs upward from a Chan Theory trend hub, and then a sub-level trend type pulls back to test, with its low point not breaking below ZG, this constitutes a third-type buy point. When a sub-level trend type departs downward from a Chan Theory trend hub, and then a sub-level trend type rallies back, with its high point not breaking above ZD, this constitutes a third-type sell point.
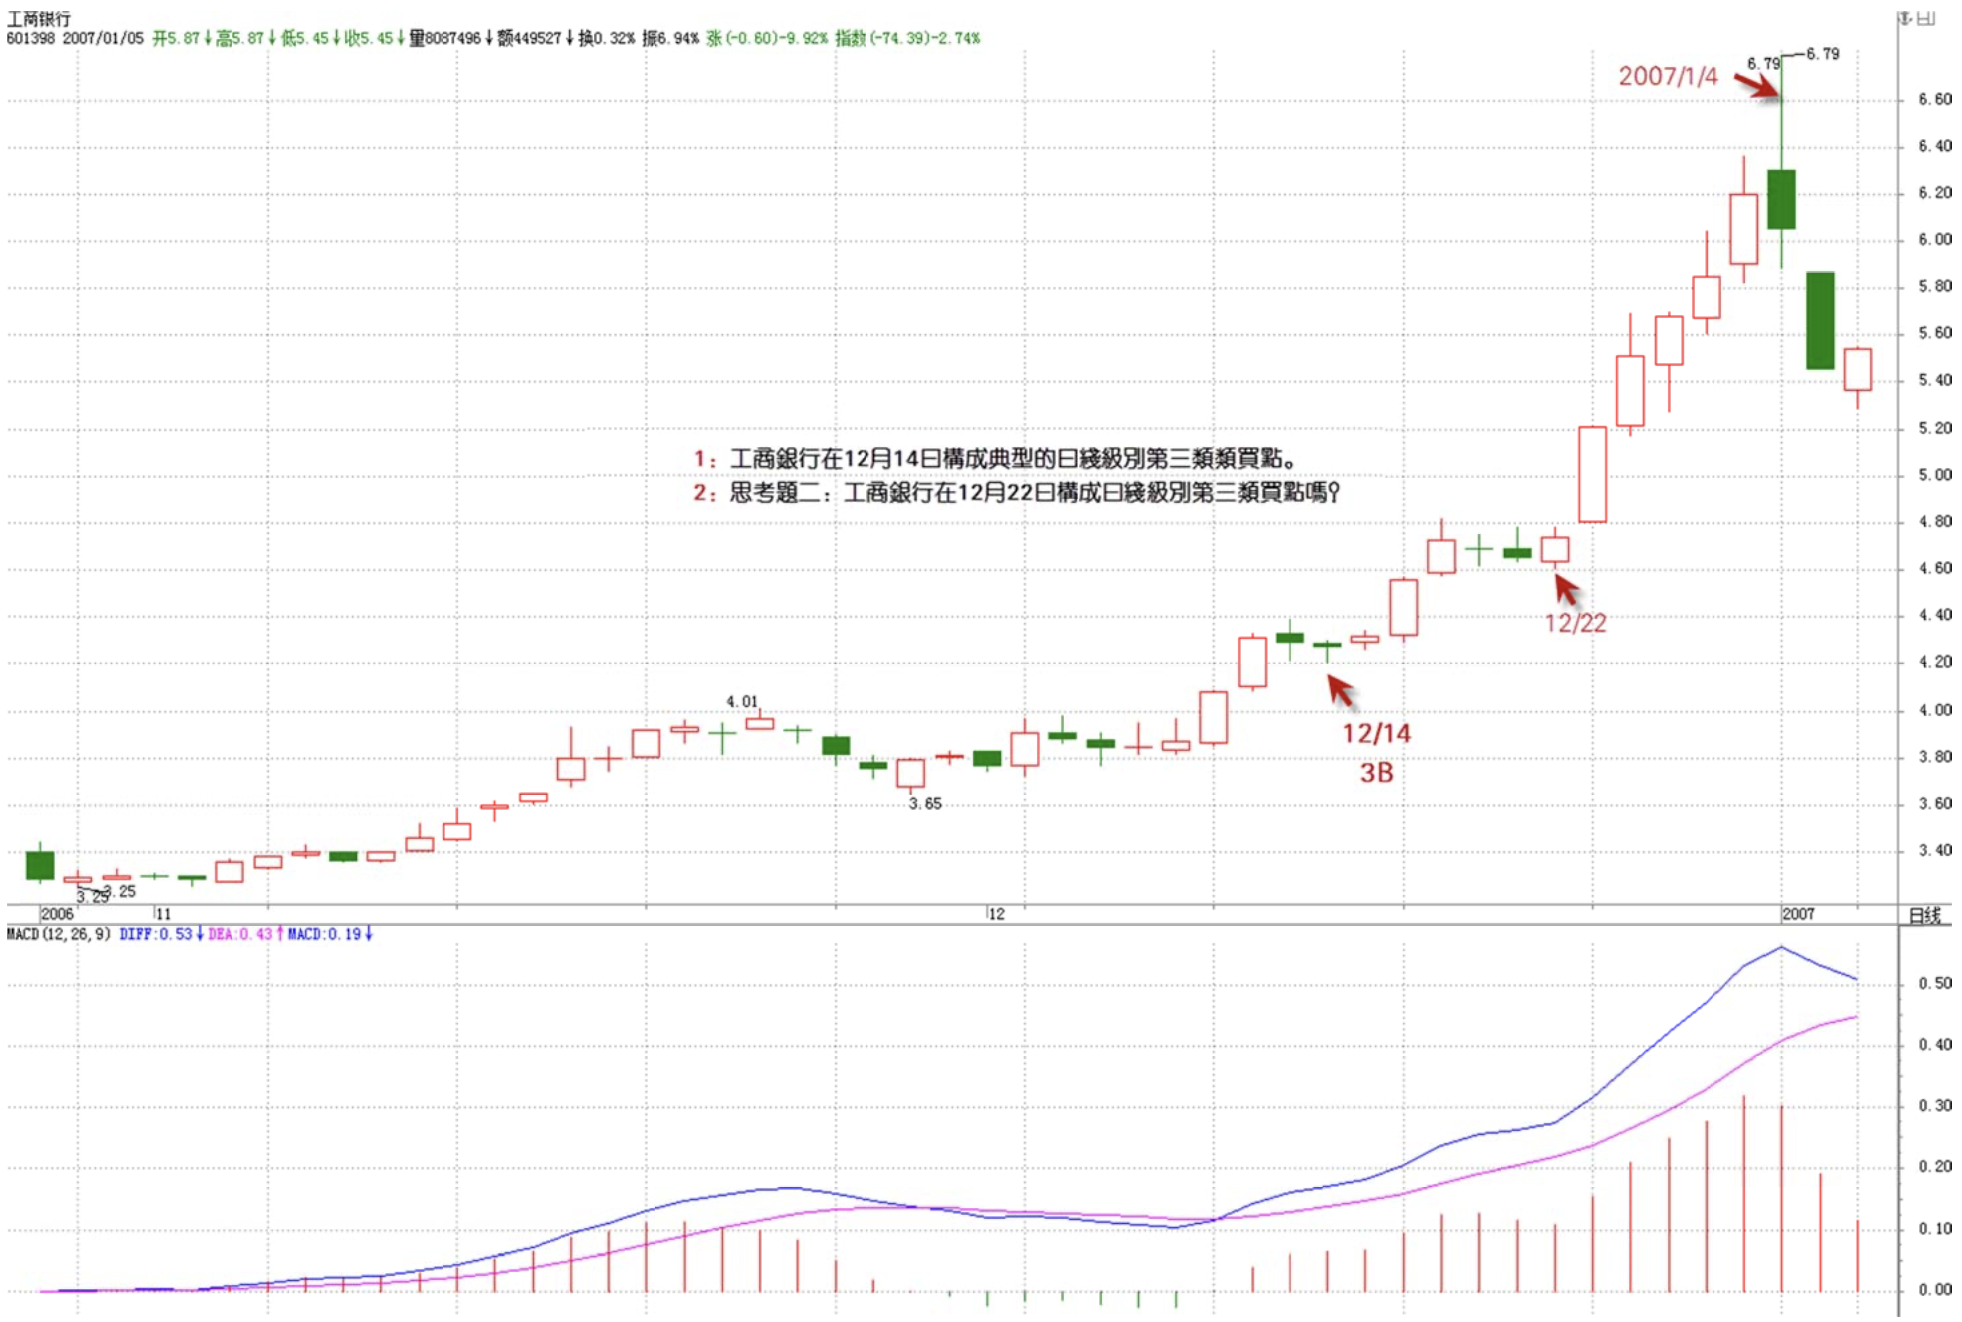
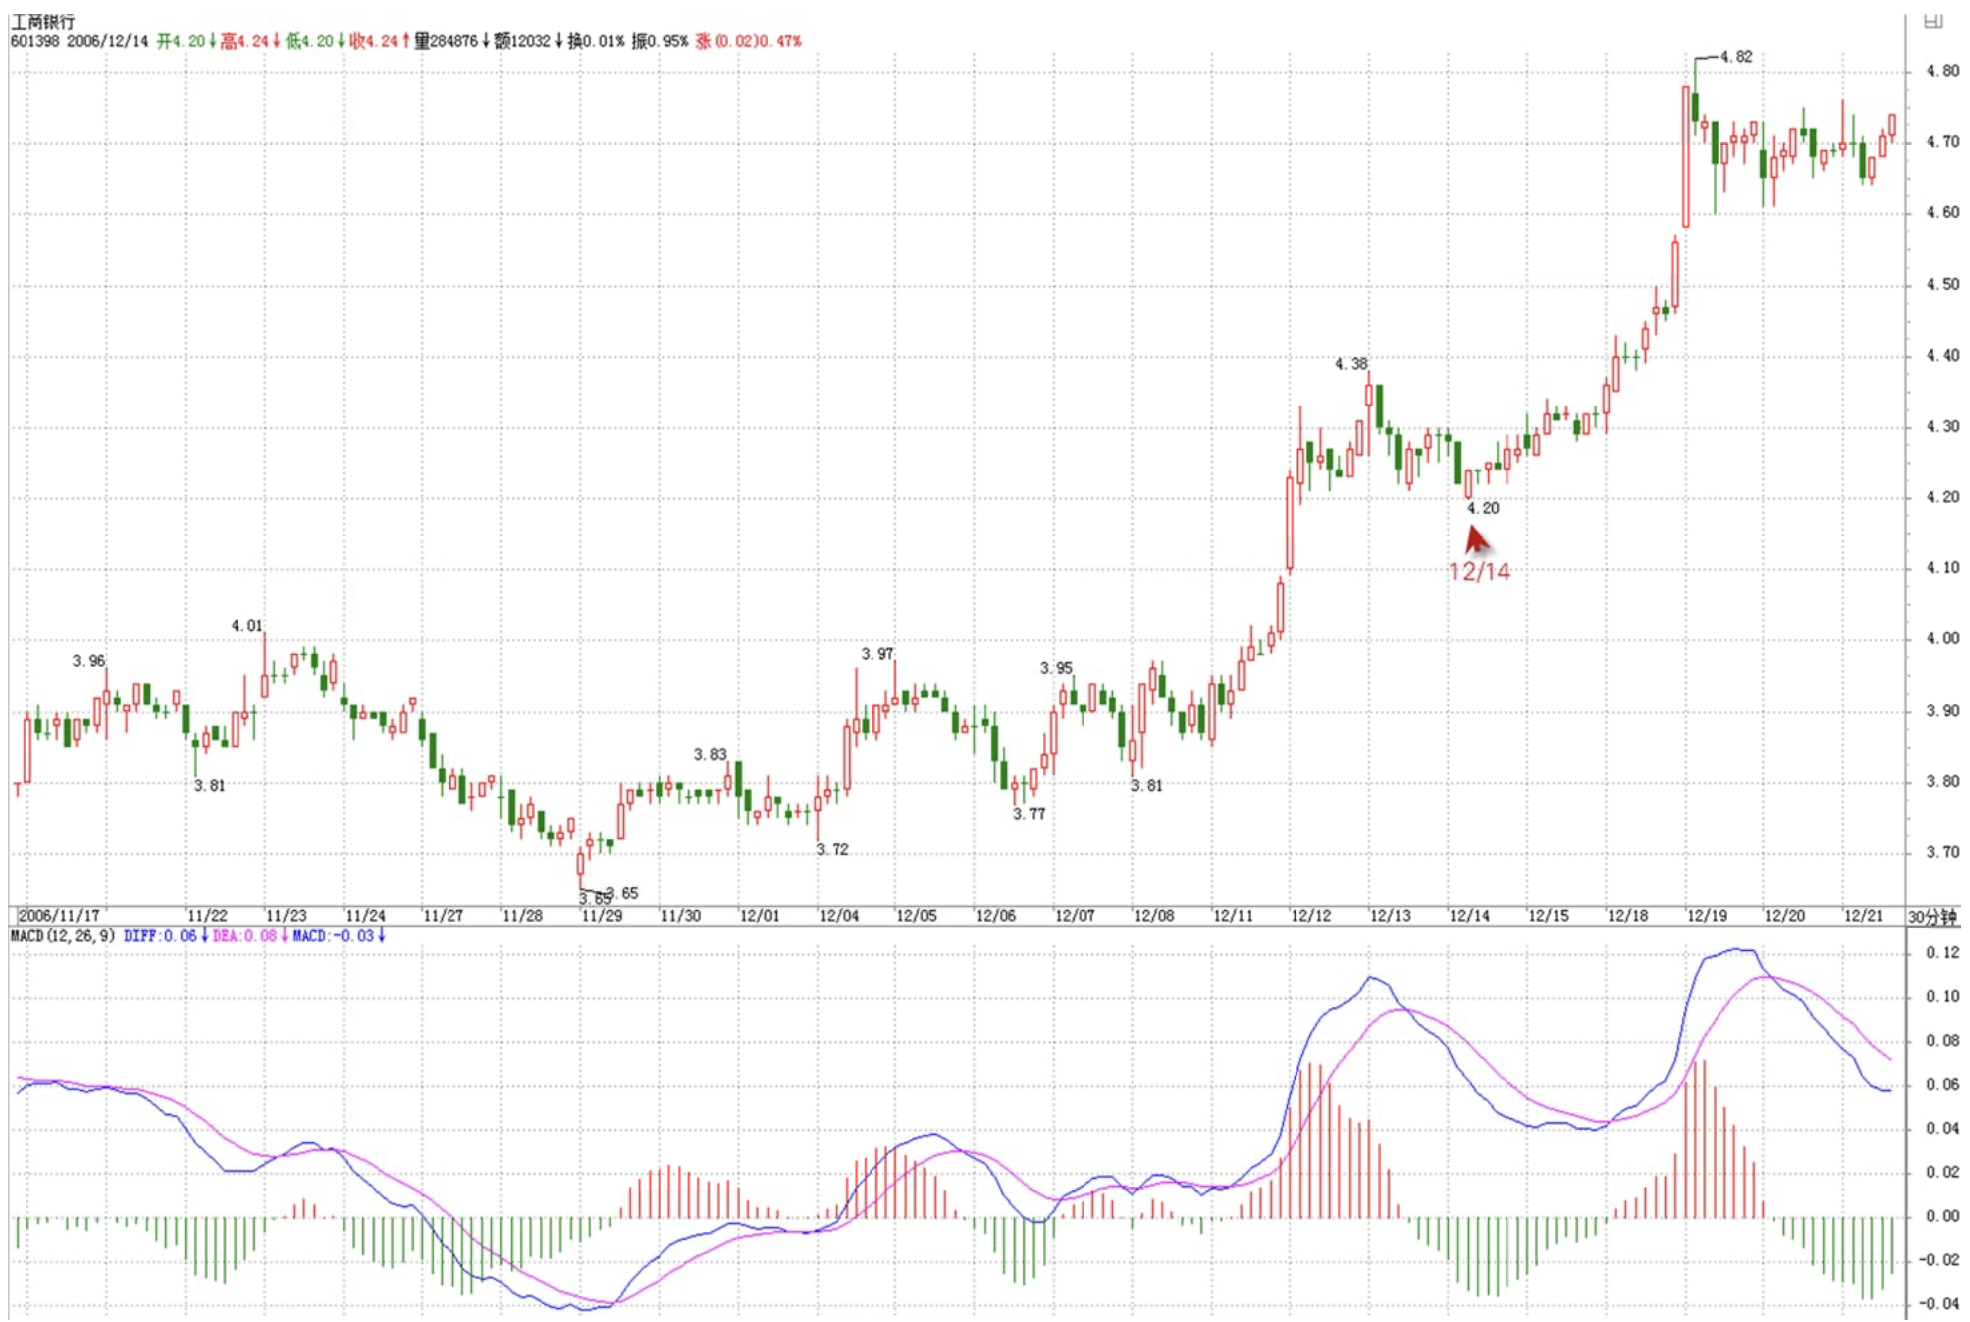
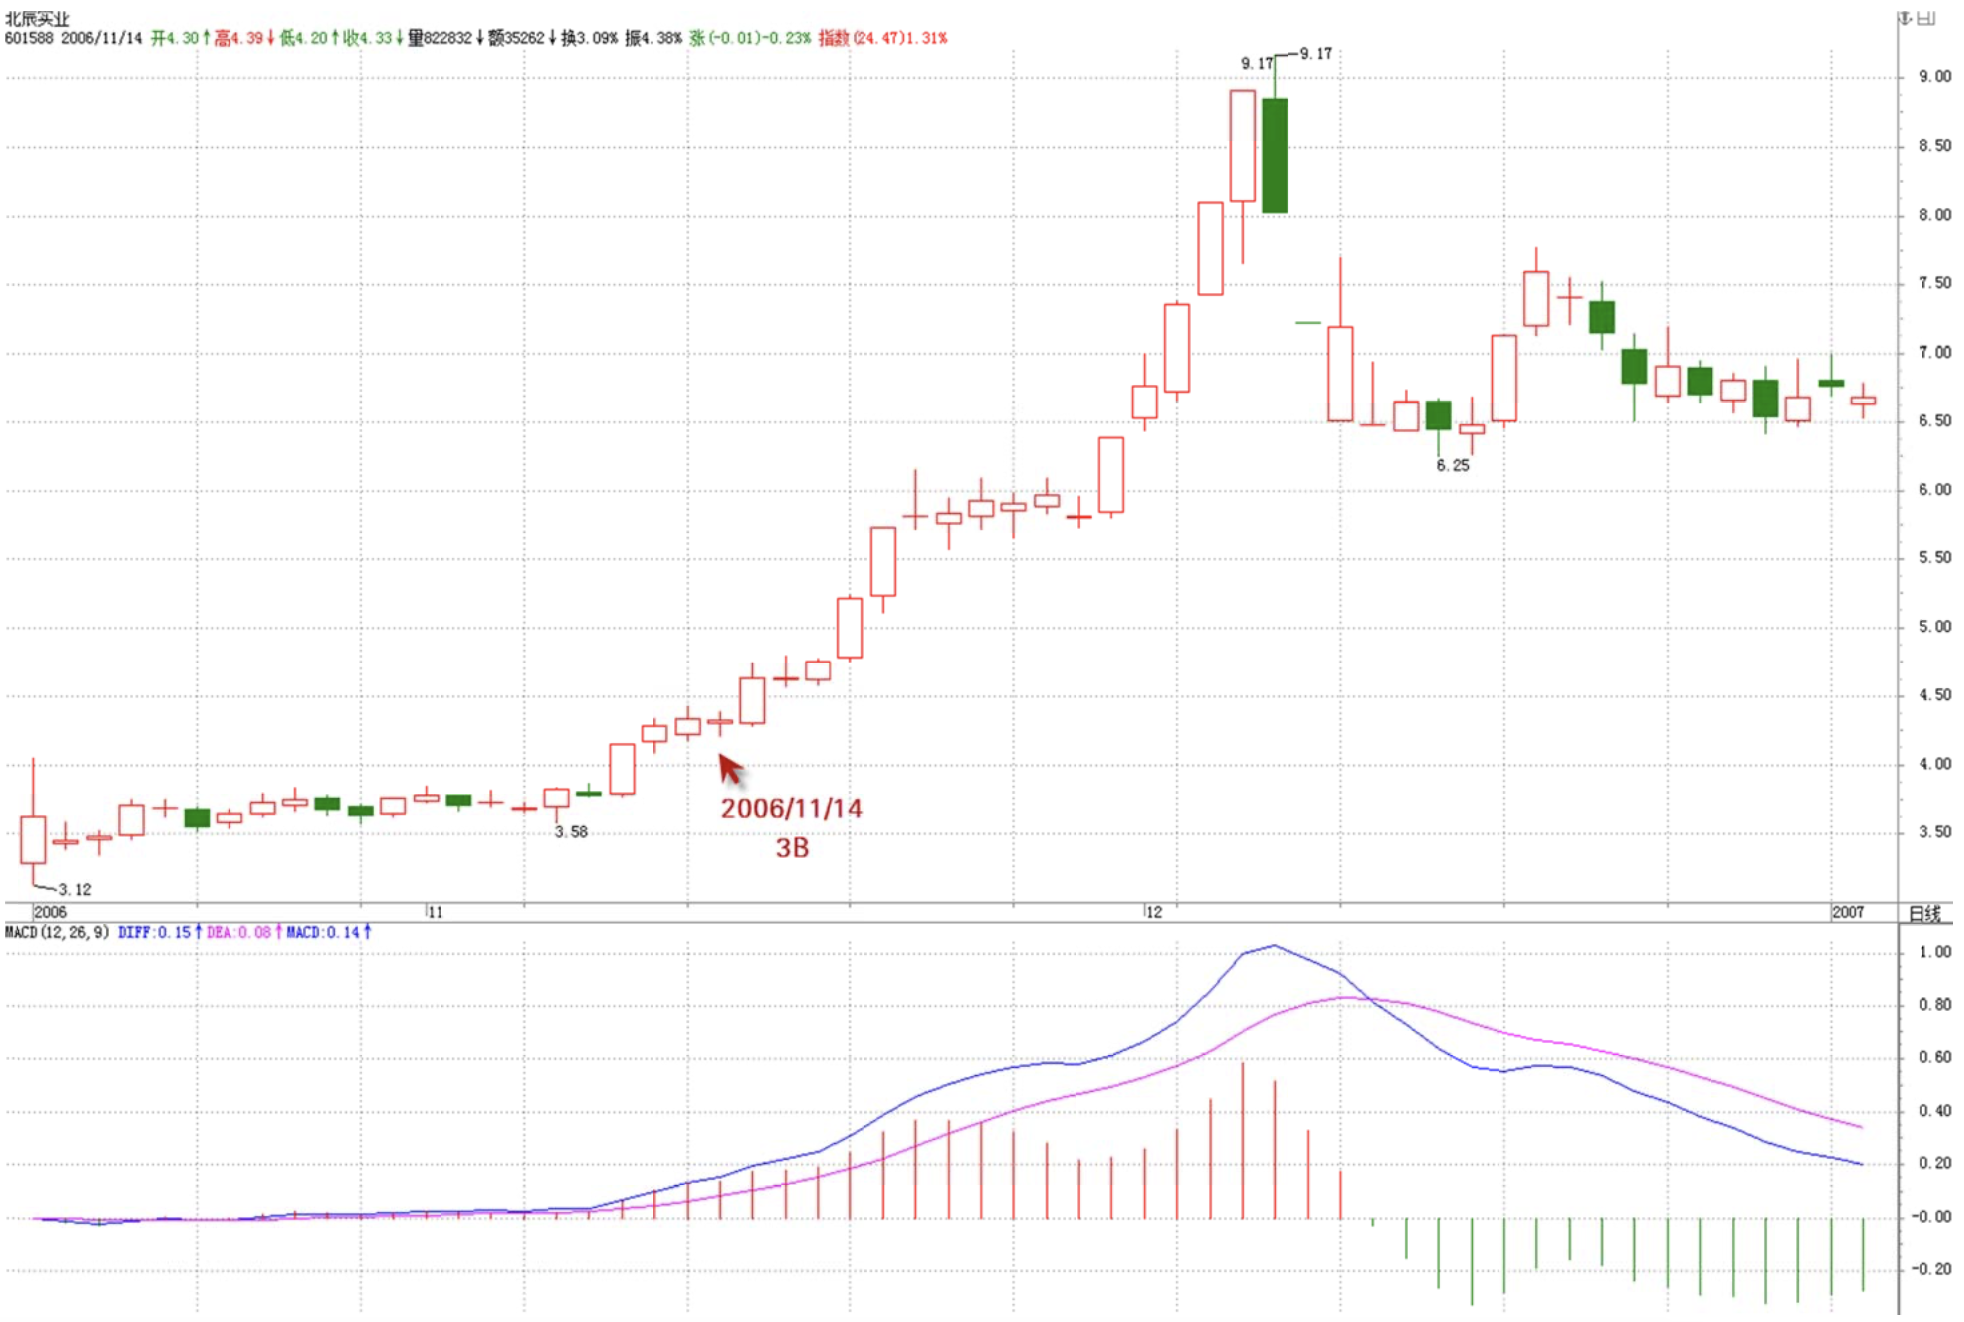
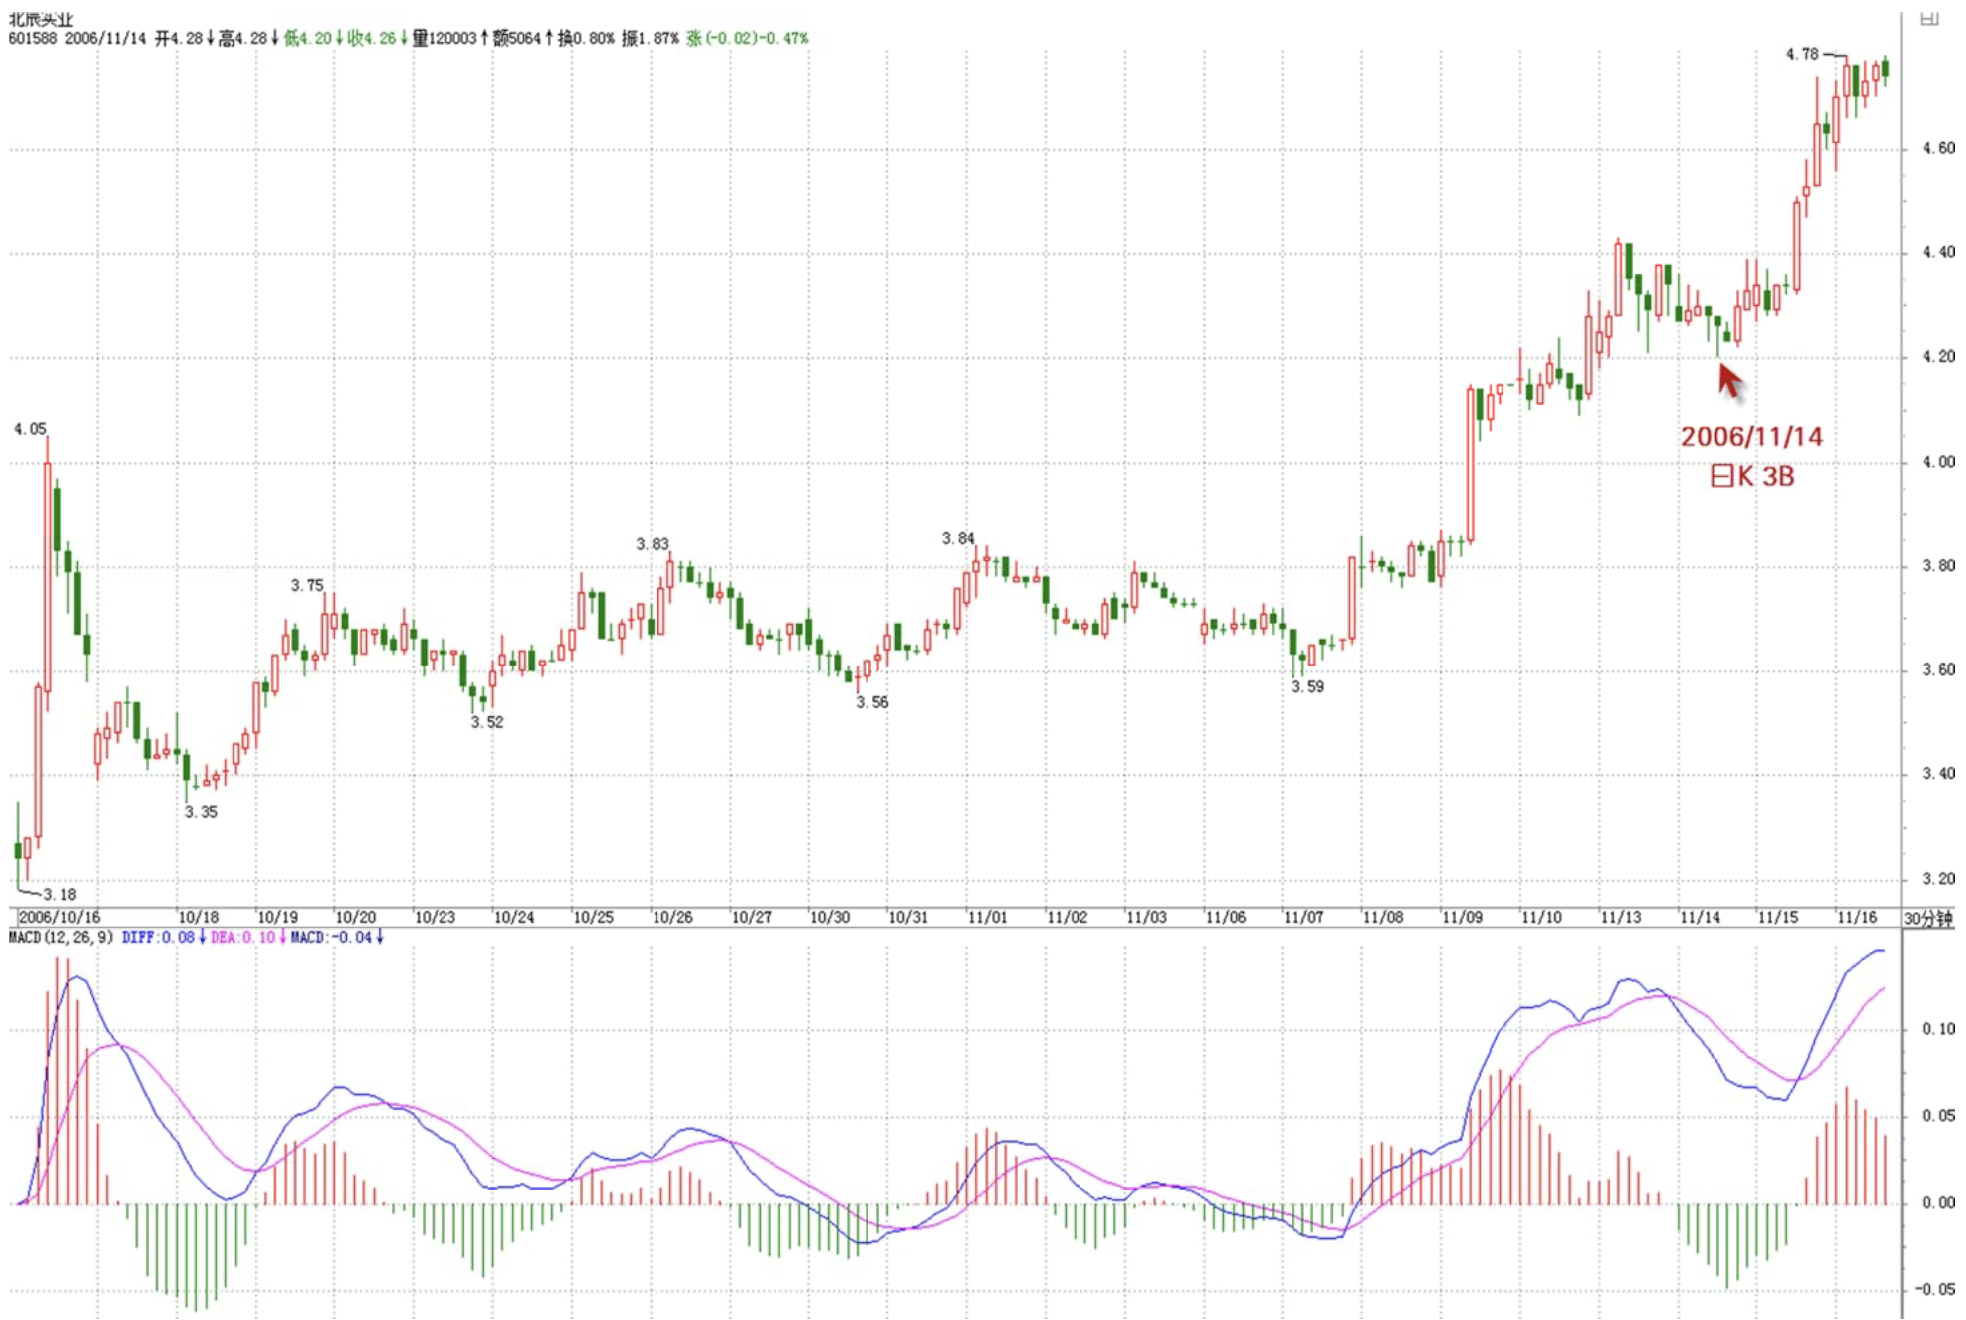
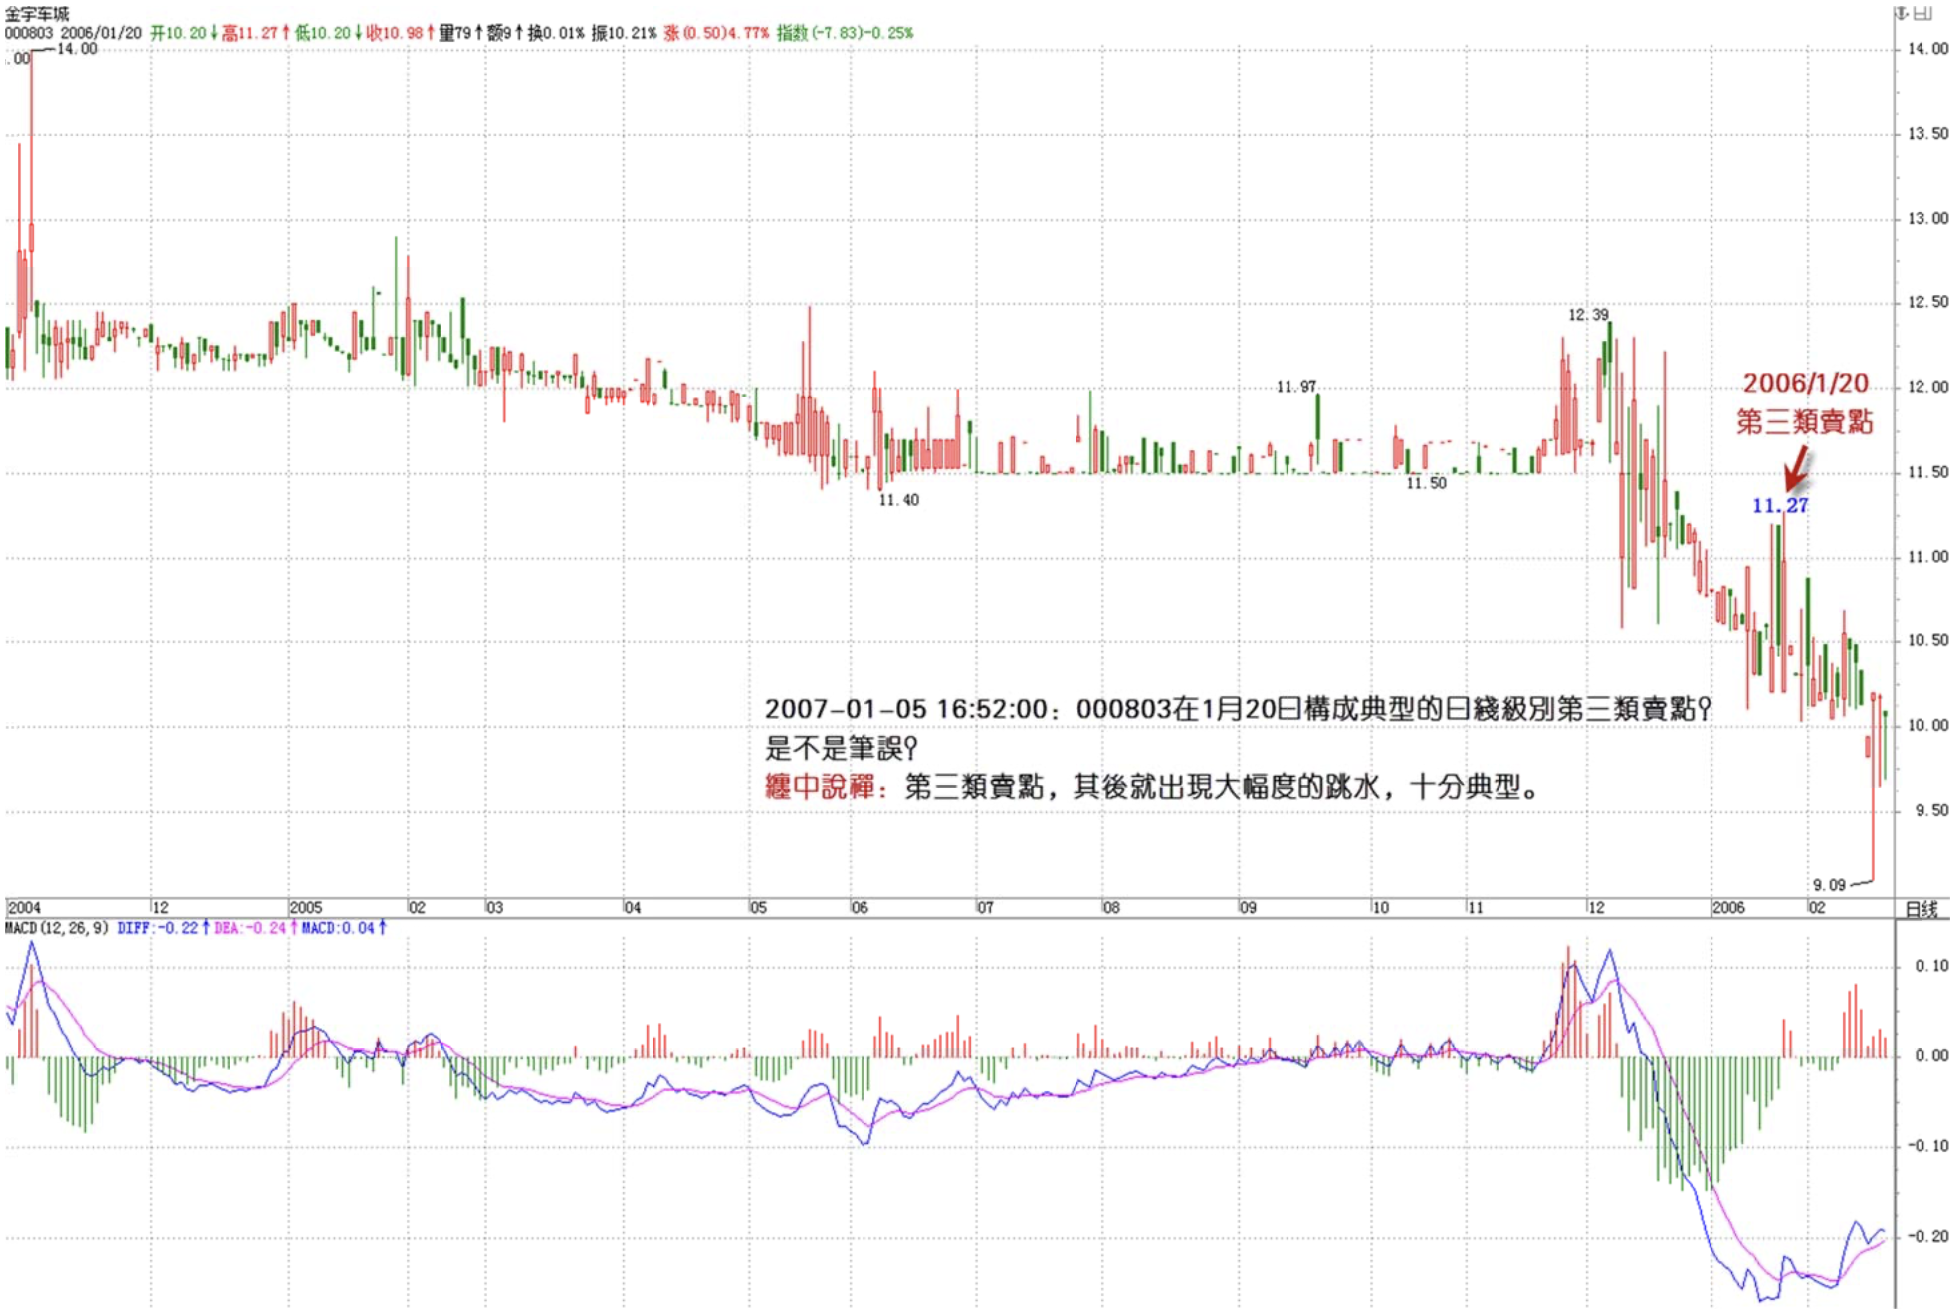
For example, ICBC formed a classic daily-level third-type buy point on December 14; Beijing North Star formed a classic daily-level third-type buy point on November 14; 000803 formed a classic daily-level third-type sell point on January 20. Note that the third type of buy/sell points are more delayed than the first and second types, but if caught well, they often save the time wasted in consolidation and are more suitable for funds with strong short-term skills. However, it must be noted that not every pullback or rally constitutes a third-type buy/sell point — it must be the first time. Furthermore, after a third-type buy/sell point, a trend does not necessarily follow — there's also the possibility of entering a larger-level consolidation. But the reason such trades necessarily profit is that even in consolidation, there will be high points. The operating strategy is very simple: once a trend fails to materialize, one must sell at the consolidation's high point — this is the same strategy as for first and second-type buy points.
Thought Exercise 1: Can a third-type buy/sell point possibly coincide with a same-level second-type buy/sell point?
Thought Exercise 2: Did ICBC form a daily-level third-type buy point on December 22?
Replies
缠中说禅 2007/1/5 15:39:13
Today the most standard mathematical formulas were presented. Understand the formulas and all classifications become very clear. Formulas are simpler than language — the key is to understand them well.
All chart patterns conform. If you think they don't, there's definitely a problem with your understanding. Be patient.
缠中说禅 2007/1/5 15:52:23
Everyone, read patiently — draw your own charts while working through the following passage. It's actually very simple:
For convenience, hereafter all these sub-level trend types consistent with the hub's direction will be called Z-segments, recorded in chronological order within the hub as Zn, etc., with their respective high and low points recorded as gn and dn. Define four indicators: GG=max(gn), G=min(gn), D=max(dn), DD=min(dn), where n traverses all Zn in the hub. Specifically, further define ZG=min(g1, g2), ZD=max(d1, d2). Obviously, [ZD, ZG] is the zone of the Chan Theory trend hub, from which the following theorems emerge:
Chan Theory Trend Hub Central Theorem 1: The extension of a trend hub is equivalent to any interval [dn, gn] overlapping with [ZD, ZG]. In other words, if there exists a Zn such that dn>ZG or gn<ZD, then a higher-level trend hub or trend and its continuation must necessarily emerge.
Chan Theory Trend Hub Central Theorem 2: For two same-level Chan Theory trend hubs front and rear: rear GG<front DD is equivalent to a downtrend and its continuation; rear DD>front GG is equivalent to an uptrend and its continuation. Rear ZG<front ZD and rear GG>=front DD, or rear ZD>front ZG and rear DD=<front GG, is equivalent to the formation of a higher-level trend hub.
缠中说禅 2007/1/5 15:57:29
General Secretary
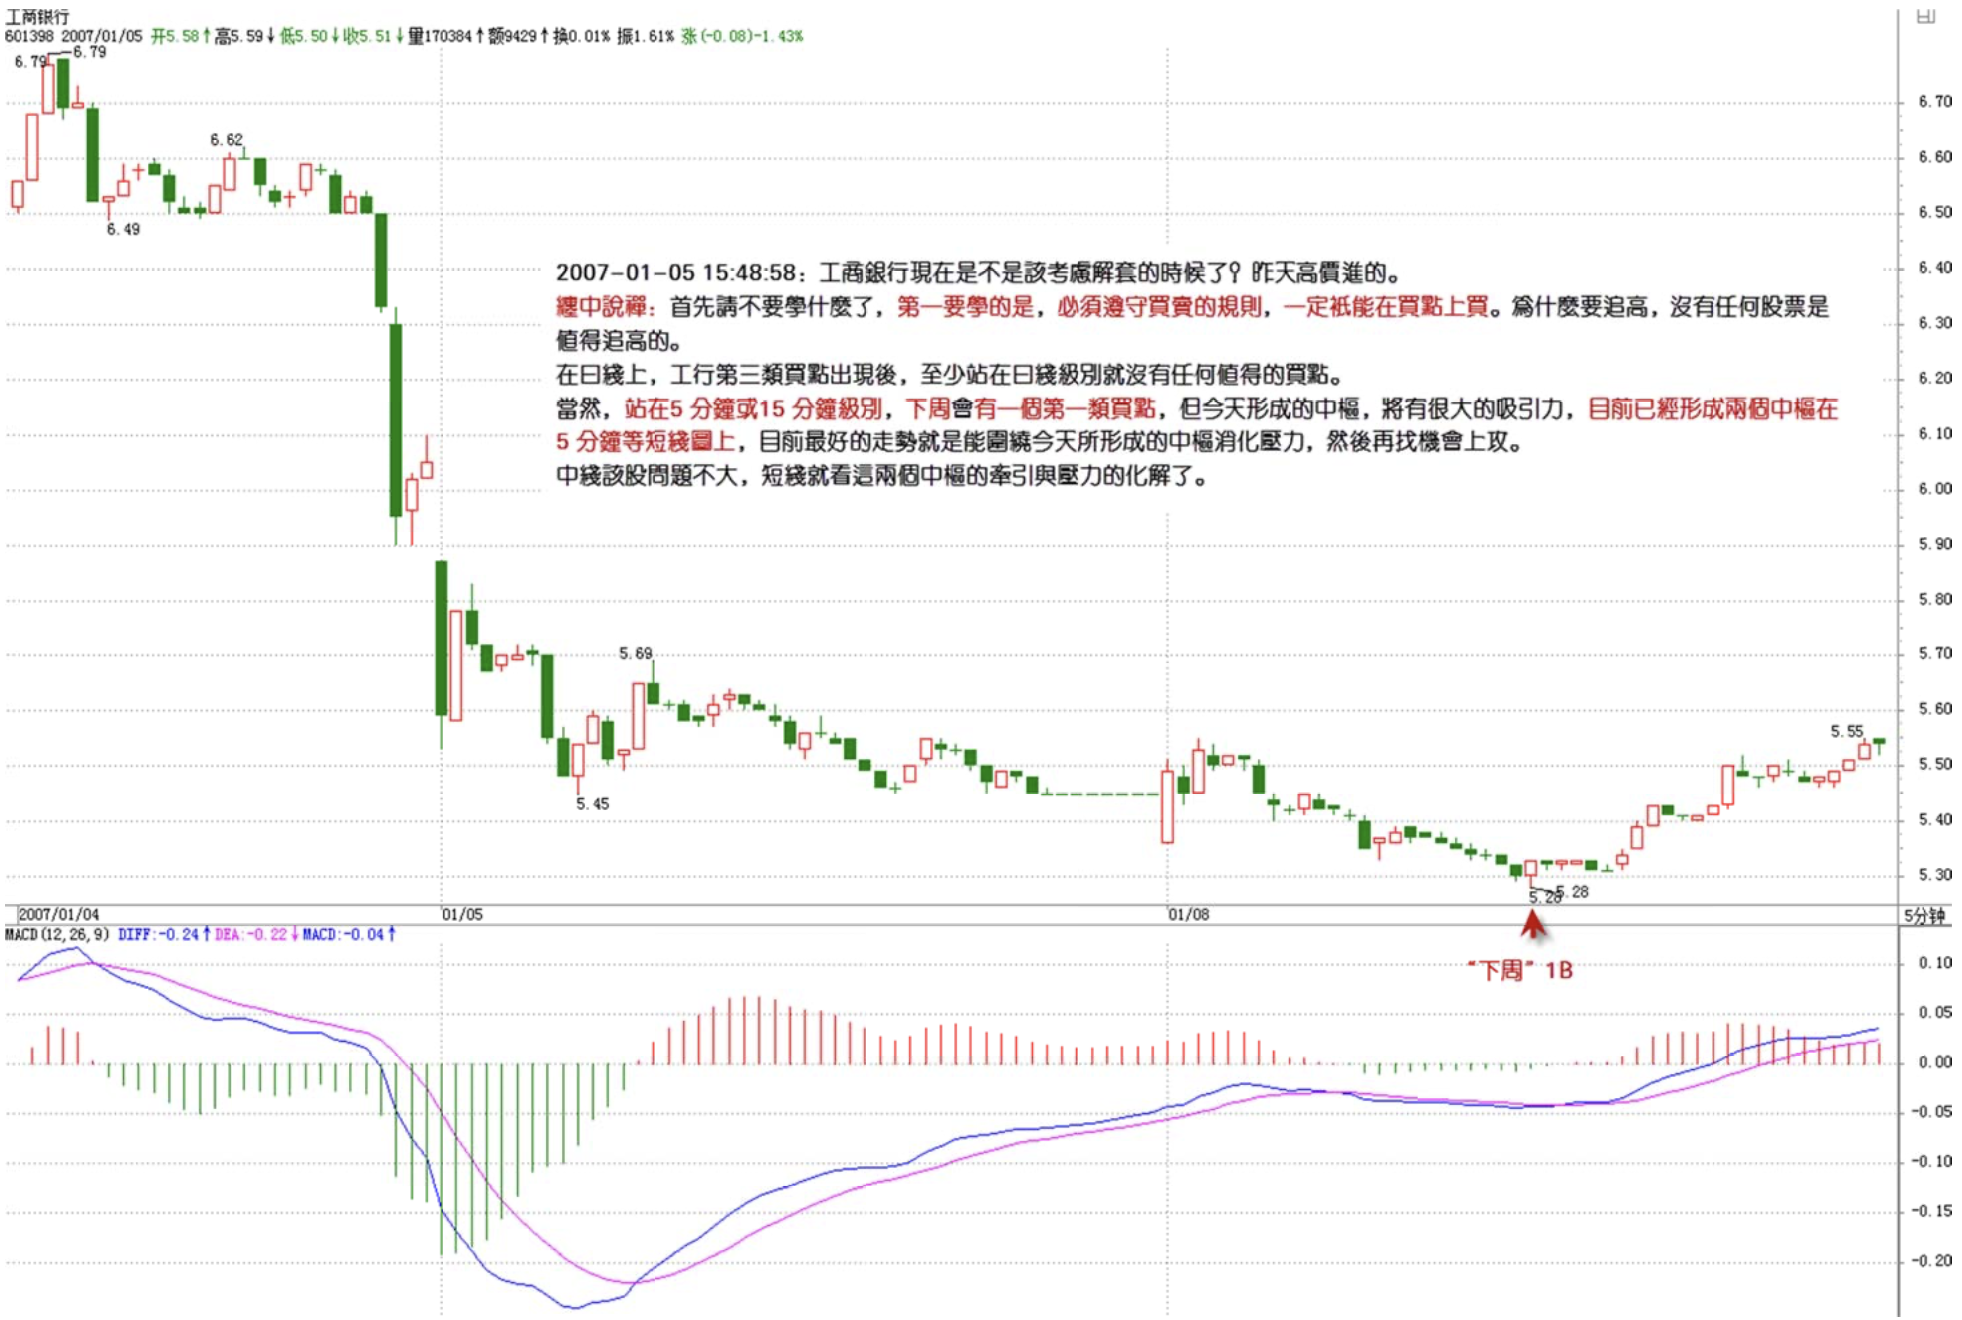
2007-01-05 15:48:58
May I ask the blogger — is my analysis below correct?
600004, on the 30-minute level:
12/14 13:30 to 12/28 15:00 constitutes a decline
12/21 11:00 to 12/25 10:30 forms one Chán Zhōng Shuō Chán hub
12/27 10:00 to 12/28 10:00 forms a second Chán Zhōng Shuō Chán hub
Subsequent movement is uncertain since no Chán Zhōng Shuō Chán hub has yet formed
Should I start thinking about getting un-trapped from ICBC now? I bought at a high price yesterday.
Thank you very much, blogger!
====
First, please stop learning all this for now. The first thing to learn is that you must follow the rules of buying and selling — you can only buy at buy points. Why chase highs? No stock is worth chasing.
On the daily chart, after ICBC's third-type buy point appeared, there has been no worthwhile buy point at the daily level at least.
Of course, from the 5-minute or 15-minute level perspective, there will be a first-type buy point next week. But the hub formed today will exert strong attraction. Currently, two hubs have already formed on 5-minute and other short-term charts. The best scenario now is for the price to oscillate around today's hub to digest pressure, then look for opportunities to push higher.
For the medium term, this stock has no issues. For the short term, it depends on how the pull and pressure of these two hubs resolve.
缠中说禅 2007/1/5 16:00:00
[Anonymous] 新年好
2007-01-05 15:51:16
May I ask Miss Chan: in this passage — "For convenience, hereafter all these sub-level trend types consistent with the hub's direction will be called Z-segments, recorded in chronological order within the hub as Zn, etc., with their respective high and low points recorded as gn and dn. Define four indicators: GG=max(gn), G=min(gn), D=max(dn), DD=min(dn), where n traverses all Zn in the hub. Specifically, further define ZG=min(g1, g2), ZD=max(d1, d2)" — what do GG=max(gn), G=min(gn), D=max(dn), DD=min(dn) mean, and what indicators do they represent?
===
These aren't any kind of existing indicators — they're defined by this ID. The meaning of the definitions is already made very clear in the article. Please patiently go through it word by word.
缠中说禅 2007/1/5 16:38:35
[Anonymous] 新年好
2007-01-05 16:29:40
Miss Chan, could you explain departing from and returning to the hub? I'm getting more and more confused.
===
How can you be confused? Such clear classifications — three situations total. Study them thoroughly.
缠中说禅 2007/1/5 16:40:17
[Anonymous] WHQ999
2007-01-05 16:27:55
Thanks, Miss Chan. These past two days I've moved into second-tier blue chips. Learned so much from you, though mindset still depends on each person's own cultivation, haha.
===
That's the right rhythm, but you must stick to constituent stocks — they're easier to grasp. Opportunities in non-constituents will come later. Also, first-tier constituent stocks still have opportunities — after they drop too much, you can enter. These stocks will be traded repeatedly.
缠中说禅 2007/1/5 16:41:22
[Anonymous] 老老没用
2007-01-05 16:39:37
First-type buy/sell points are easy to understand in terms of level significance. But what about time periods? Apart from new listings and stocks that endured a long bear market, latecomers would find it very hard to spot first-type buy points. At least on the daily chart level. May I ask, Miss Chan. Thank you!
====
They're rare on the daily chart, but second and third types are everywhere. Nobody told you it has to be the first type.
缠中说禅 2007/1/5 16:52:13
Everyone, don't mix things up. The departure from and return to the hub is about the movement around the hub. What we're studying here is the hub's own changes — the three situations of hub continuation, generation of new hubs, and generation of higher-level hubs.
Three situations, with the most rigorous definitions. Get these situations clear, then look at more charts to verify.
缠中说禅 2007/1/5 16:53:44
[Anonymous] 学行
2007-01-05 16:52:00
000803 formed a classic daily-level third-type sell point on January 20?
Is this a typo?
===
Third-type sell point — afterwards there was a massive nosedive. Very typical.
缠中说禅 2007/1/5 17:02:49
[Anonymous] 带套操作
2007-01-05 16:45:23
MM, when you say mid-term, how many months do you mean? Like when you said 600832's mid-term rally would start once it broke through the resistance line, or that ICBC has no mid-term problems, etc. Please enlighten me, thanks!
===
Medium-term means the weekly level. Medium-short-term means the daily level. Short-term means 30-minute. Ultra-short means the 5-minute or 1-minute minimum level.
600832 — yesterday I told you a key level at 11.58. It didn't break below today, which is good. 12.3 to 12.6 is the short-term resistance zone.
Medium-term resistance is the 120-week moving average at 12.43, so it's currently facing weekly and daily resistance zones. Some back-and-forth is perfectly normal. The eventual breakout is not in question — it's just a matter of how quickly it happens.
缠中说禅 2007/1/5 17:11:25
[Anonymous] 带套操作
2007-01-05 16:51:31
Treated ICBC like Shenzhen Development Bank — mid-term holding until before Spring Festival. Been studying MM's old posts daily — benefited immensely. Unfortunately, still got trapped by greed. How embarrassing!
===
For stocks that have risen too sharply on the daily chart, to spot pullback short-trading opportunities you need to look at smaller-level charts. Also, generally when a stock has doubled, there's pressure, especially for large-cap ones. However, the medium term is fine — be patient, there will be chances to play some short trades. Rebounds will happen.
Also, a pullback constrains Life Insurance's opening price somewhat. Everyone hopes to buy at a good price — if ICBC stays at 8 yuan, wouldn't Life Insurance open at 60 yuan? Then nobody could play anymore.
Whether it's the launch of second-tier constituent stocks, Life Insurance's market debut, or Bank of China's lock-up expiry, they all require ICBC to pull back. So this is perfectly normal and not difficult to foresee. Such minor episodes have no effect on ICBC's medium-term trend.
缠中说禅 2007/1/5 17:13:27
心宇
2007-01-05 17:04:14
How should a beginner start? Study first, but by the time you've finished studying won't the market be long gone? But jumping in without studying is...
Chan MM, what should I do?
===
Learning one move well is enough. For example, if you thoroughly understand the third-type buy point discussed today, in a bull market it's sufficient to beat 95% of people.
缠中说禅 2007/1/5 17:15:02
Signing off, see you later. Please save any questions for later.
缠中说禅 2007/1/5 17:25:31
[Anonymous] 新年好
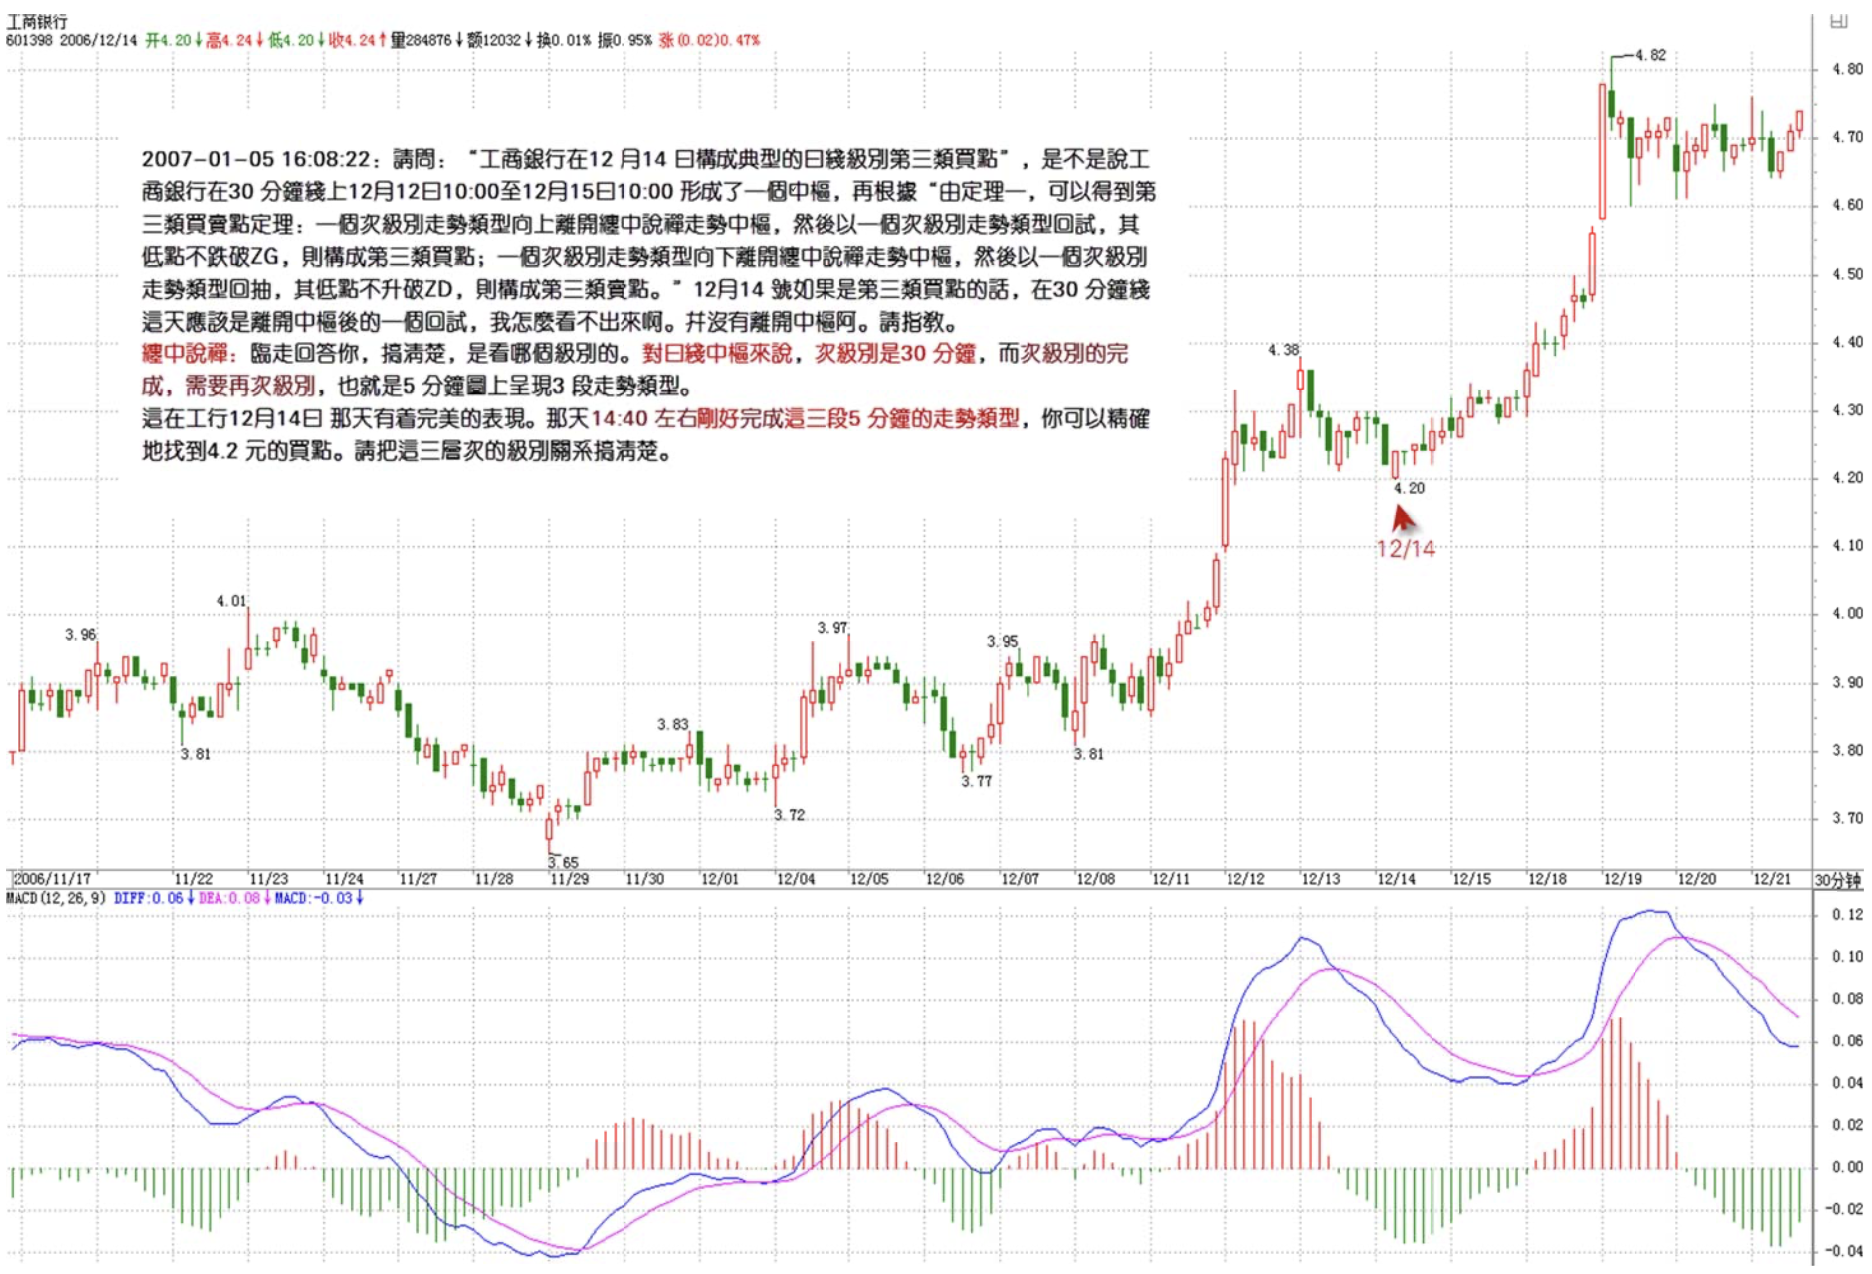
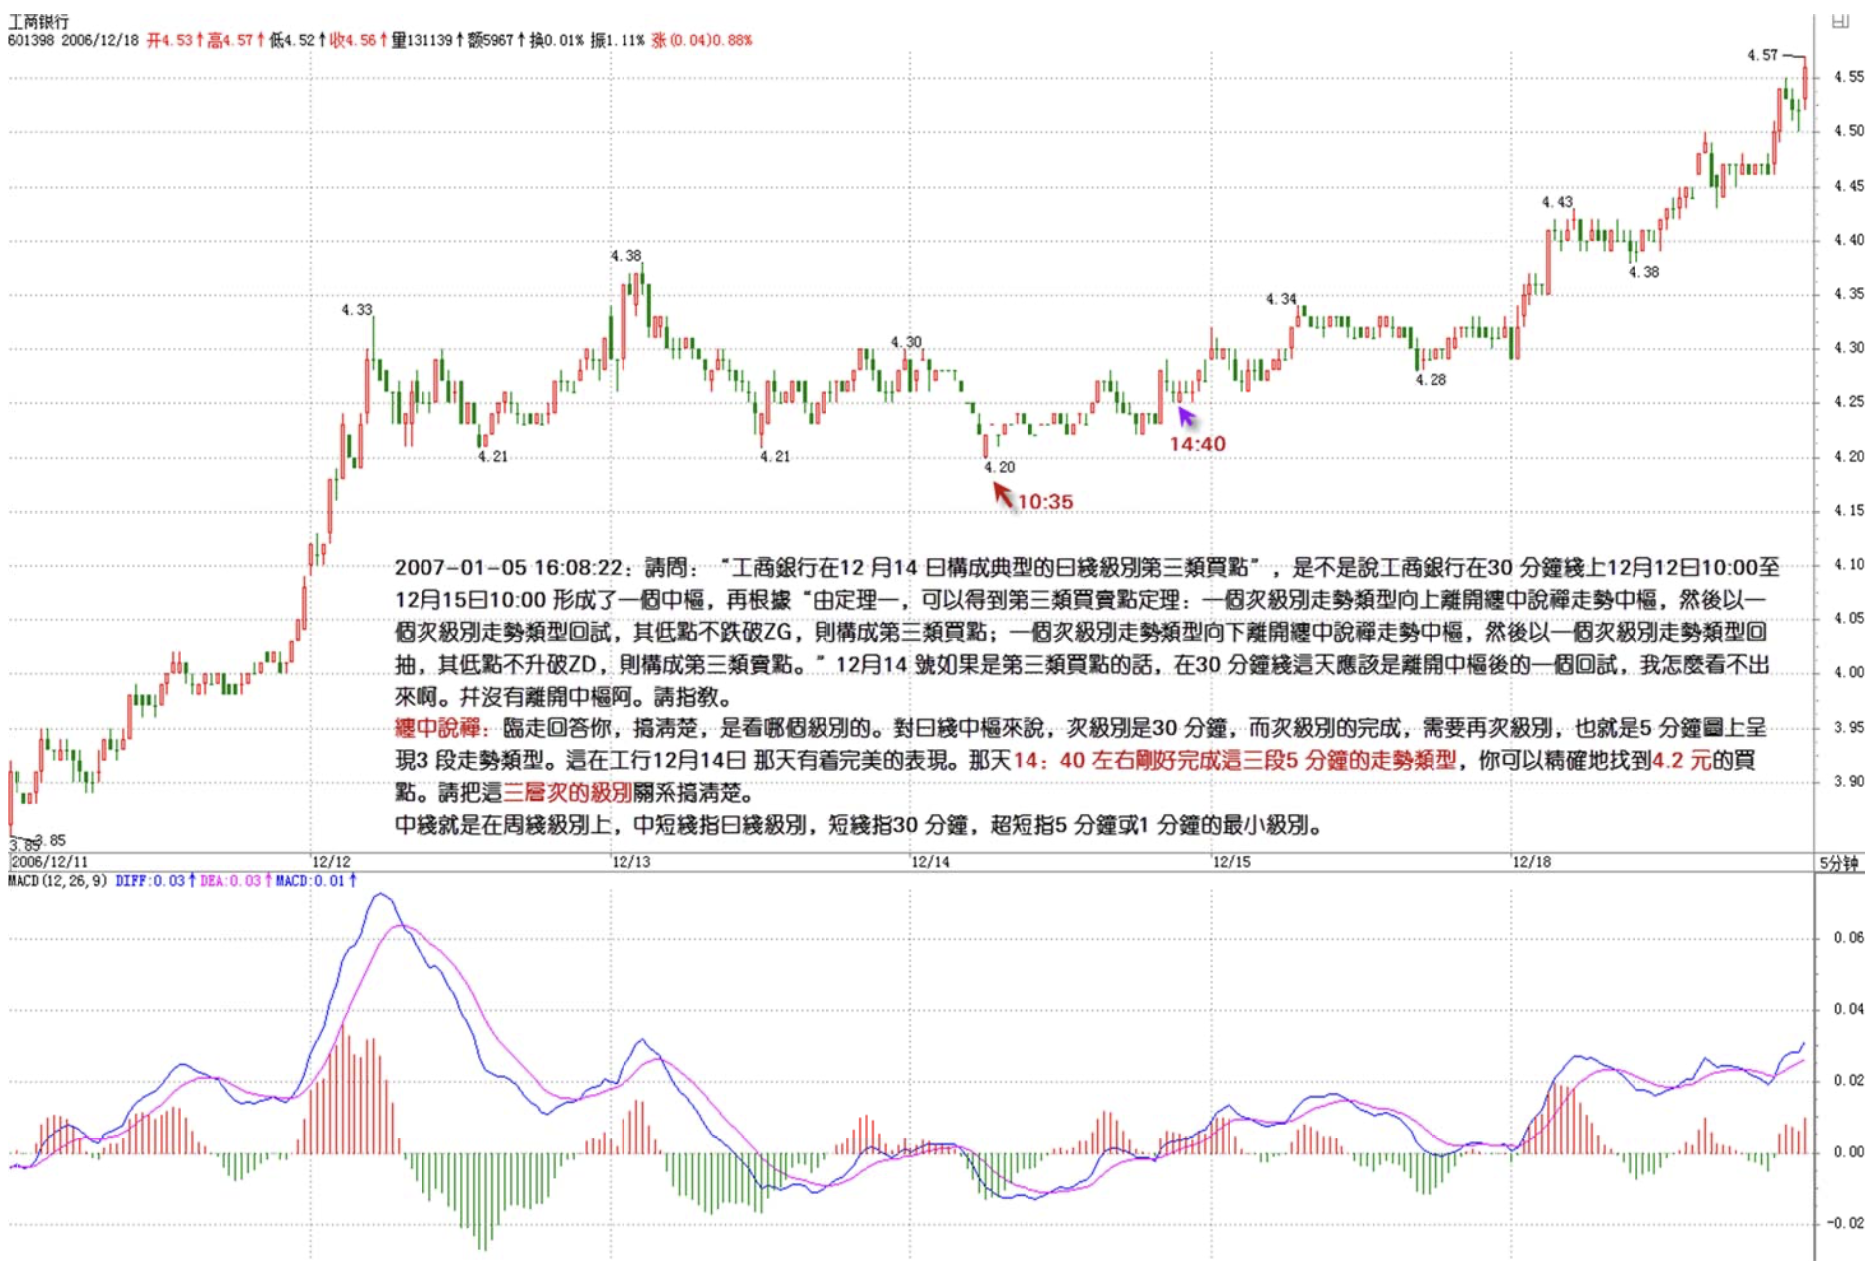
2007-01-05 16:08:22
May I ask Miss Chan: "ICBC formed a classic daily-level third-type buy point on December 14th" — does this mean that on the 30-minute chart, ICBC formed a hub from 12/12 10:00 to 12/15 10:00, and then based on "From Theorem 1, we can derive the third-type buy/sell point theorem: if a sub-level trend type moves upward away from a Chán Zhōng Shuō Chán trend hub, then pulls back with a sub-level trend type whose low doesn't break below ZG, that constitutes a third-type buy point; if a sub-level trend type moves downward away from a Chán Zhōng Shuō Chán trend hub, then bounces back with a sub-level trend type whose high doesn't break above ZD, that constitutes a third-type sell point." If 12/14 was a third-type buy point, then on the 30-minute chart that day should show a pullback after departing the hub — but I can't see it. It doesn't seem to have departed the hub at all. Please enlighten me, Miss Chan.
====
Before I go, let me answer you. Get clear on which level you're looking at.
For a daily hub, the sub-level is 30-minute, and the completion of a sub-level requires the sub-sub-level — that is, the 5-minute chart — to show 3 segments of trend types. This is perfectly demonstrated on ICBC's chart on the 14th. Around 14:40 that day, these three segments of 5-minute trend types were precisely completed, and you could precisely find the buy point at 4.2 yuan.
Please get these three-tier level relationships clear.
See you.
缠中说禅 2007/1/5 15:30:38
Sina must have too many people — it's hard just getting on. Tried posting several times without success.
The market's trend today is very good, a classic catch-up rally. The key is still constituent stocks. Constituent stocks also have first-tier, second-tier, and third-tier. Now, while first-tier banking stocks rest, second-tier ones launch — perfectly normal. Grasp this rhythm and you can play multiple rounds, improving capital utilization too.