Teaching You to Trade Stocks 33: The Polysemy of Trends
2007/3/2 15:20:37
If the market always produced standard a+A+b+B+c patterns with A and B at the same hub level, it would be too standard and too boring. Markets always have their complexities, giving trend movements a kind of polysemy — like the multiple meanings of words in poetry. Without polysemy, if poetry were as rigid as logic, it would be utterly dull. All polysemy in trends relates to hubs.
For example, a 5-minute hub keeps extending, producing 9 or more 1-minute sub-level movements. From the perspective of a 30-minute hub, three overlapping 5-minute movements form one, and 9 or more 1-minute sub-level movements — with every 3 segments constituting a 5-minute hub — can also be interpreted as a 30-minute hub. This kind of polysemy can be eliminated by limiting the number of hub extensions. Generally, hub extension shouldn't exceed 5 segments — that is, once 6 segments of extension appear, plus the original three segments that formed the hub, it constitutes a hub of the next larger level.
Another type of polysemy is caused by the simplification of models. Charts of different levels are essentially models of real trends at different precision levels. For example, a yearly chart naturally lacks the precision of a tick-by-tick chart — many important details are invisible at larger levels. What we call trend levels, in the strictest sense, can be precisely confirmed starting from the lowest-level chart formed by each transaction, building up through hub extension, expansion, and other definitions. This is the most precise method and doesn't involve concepts like 5-minute, 30-minute, or daily. But this would be extremely tedious and unnecessary. Using the level arrangement of 1-minute, 5-minute, 30-minute, daily, weekly, monthly, quarterly, and yearly is merely a simplified approach, primarily because currently available charts are organized this way. Of course, some systems can display charts at different minute intervals — for instance, creating a 7-minute chart is entirely possible. You could even arrange a level sequence based on some geometric progression. However, possible as it is, it's unnecessary, because chart precision doesn't have much practical significance — real trends don't require such precise observation. Of course, some simple modifications are acceptable — for example, replacing 30-minute with 15-minute and 60-minute, forming a 1-minute, 5-minute, 15-minute, 60-minute, daily, weekly, monthly, quarterly, yearly level arrangement. That also works.
Although there's no need to precisely analyze from the lowest-level chart upward step by step, if your chart's zoom function is good, when you continuously shrink the tick or 1-minute chart, more and more of the trend becomes visible. This gradual presentation from detail to whole gives you an intuitive feel for how trend levels continually expand — that feeling can be helpful for developing market intuition later. At a certain stage, you may develop a feeling as if you're standing among layer upon layer of overlapping trends, with the current direction illuminating the stacked movements. At that point, you'll often forget concepts like hubs. All hubs, according to their respective levels, seem to become maze gates of varying sizes, and the true path is only one. Your mind intuits the present moment directly. Honestly, when you have this kind of clear market intuition, you've only just reached the door. At that point, it's like reading a poem — if you're still analyzing grammar, it's like still analyzing using hubs. A truly sensitive reader doesn't get entangled in individual words and phrases — the whole appears intuitively in the present moment. A poem becomes a self-sufficient world that you possess entirely in the present. Market intuition works exactly the same way. As soon as the most subtle signs appear, you grasp them in the present moment — only then can you be considered a somewhat qualified reader of the magnificent poem that is market trends.
In the eyes of a fully intuitive reader, polysemy doesn't exist. But until that sharpest intuition emerges, analyzing the polysemy of trends remains necessary, and must therefore continue. In other words, if you can't play the supra-logical game, you can only continue circling within logic. Besides the two types of polysemy above, there's another with substantive significance: multiple reasonable interpretations in trend analysis that all conform to the theory's internal logic. This kind of polysemy, rather than being a burden, allows multi-angle analysis of trends.
For example, in a+A+b+B+c, segment a can have an entirely different interpretation — viewing a as an oscillation around hub A. Although A actually appears later, this doesn't diminish the value of this perspective. Similarly, c can be viewed as an oscillation around B. This way, the entire movement simplifies to two hubs and a connecting movement between them. In the most extreme case, in the a+A+b+B+c series of trend types, a and c don't necessarily have to exist, and b can simply be a gap — thus the entire movement can be simplified to two isolated hubs. Extending this view to all trends, any chart is essentially a collection of hubs of different scales. Think of these as different planets: planets above the current position exert upward force, those below exert downward force, and the resultant of all these forces constitutes a total force. The market's present-moment force — the force created by current buying and selling (buying is upward force, selling is downward force) — also constitutes a resultant. The first resultant represents a present-moment force constructed by existing market movements; the latter is the force generated by current transactions. Studying the relationship between these two forces constitutes another angle of market research — another process of interpretation. This is a complex issue that will be discussed progressively later; consider it high school curriculum.
For now, never mind the force business. From a purely hub perspective, we can give divergence another interpretation. For a+A+b+B+c, divergence roughly means the power of segment c is weaker than b's. Standing from hub B's perspective, let's first assume b+B+c is an upward process. Then b can be seen as a downward departure from hub B, and c as an upward departure from hub B. So-called top divergence means that in the last hub, the upward departure is weaker than the downward departure. Hubs have the property that they exert equal pull-back force on both upward and downward departures. Since the upward departure is weaker than the downward departure, and the downward departure can be pulled back to the hub, the upward departure can certainly also be pulled back into the hub. For a b+B+c upward movement, this constitutes top divergence; for a b+B+c downward movement, this constitutes bottom divergence. For consolidation divergence, this analysis is equally valid. In fact, from the hub's perspective, consolidation divergence and trend divergence are essentially the same — they differ only in magnitude, level, and the hub position where they occur.
Similarly, from a purely hub perspective, the case of a+A+b+B where B is a larger level than A becomes very simple. Here, it's not necessarily the case that what follows B continues in the original direction — it can proceed in the opposite direction. For example, if a+A+b+B is downward, then a+A+b can actually be seen as a pullback from an upward departure from B. For hubs, there's no requirement that all departures alternate in up-down-up-down sequence — a second upward departure following a first upward departure is perfectly allowed. From this angle, it's very natural for a reversal upward directly from B. Whether this reversal succeeds — let's write the subsequent reversal as c. Then you only need to compare the force of a+A+b versus c, since hub B's pullback force on both segments is the same. If c is weaker than a+A+b, the reversal naturally fails, meaning it must return to the hub — in the strongest case, there'll be at least one pullback to test whether a third-type buy point can form. The force comparison between a+A+b and c is no different from divergence analysis, except the two are in different directions. If using MACD to assist in judgment, divergence comparisons involve the yellow-white lines and the histogram area on the same side of the 0 axis — both above or both below. But for a+A+b versus c, they're on opposite sides. Because of this, there's no issue of yellow-white line pullback, but one thing is certain: the yellow-white lines must cross the 0 axis at least once. The recent market movement provides the most standard demonstration of this situation. Let me briefly analyze it.
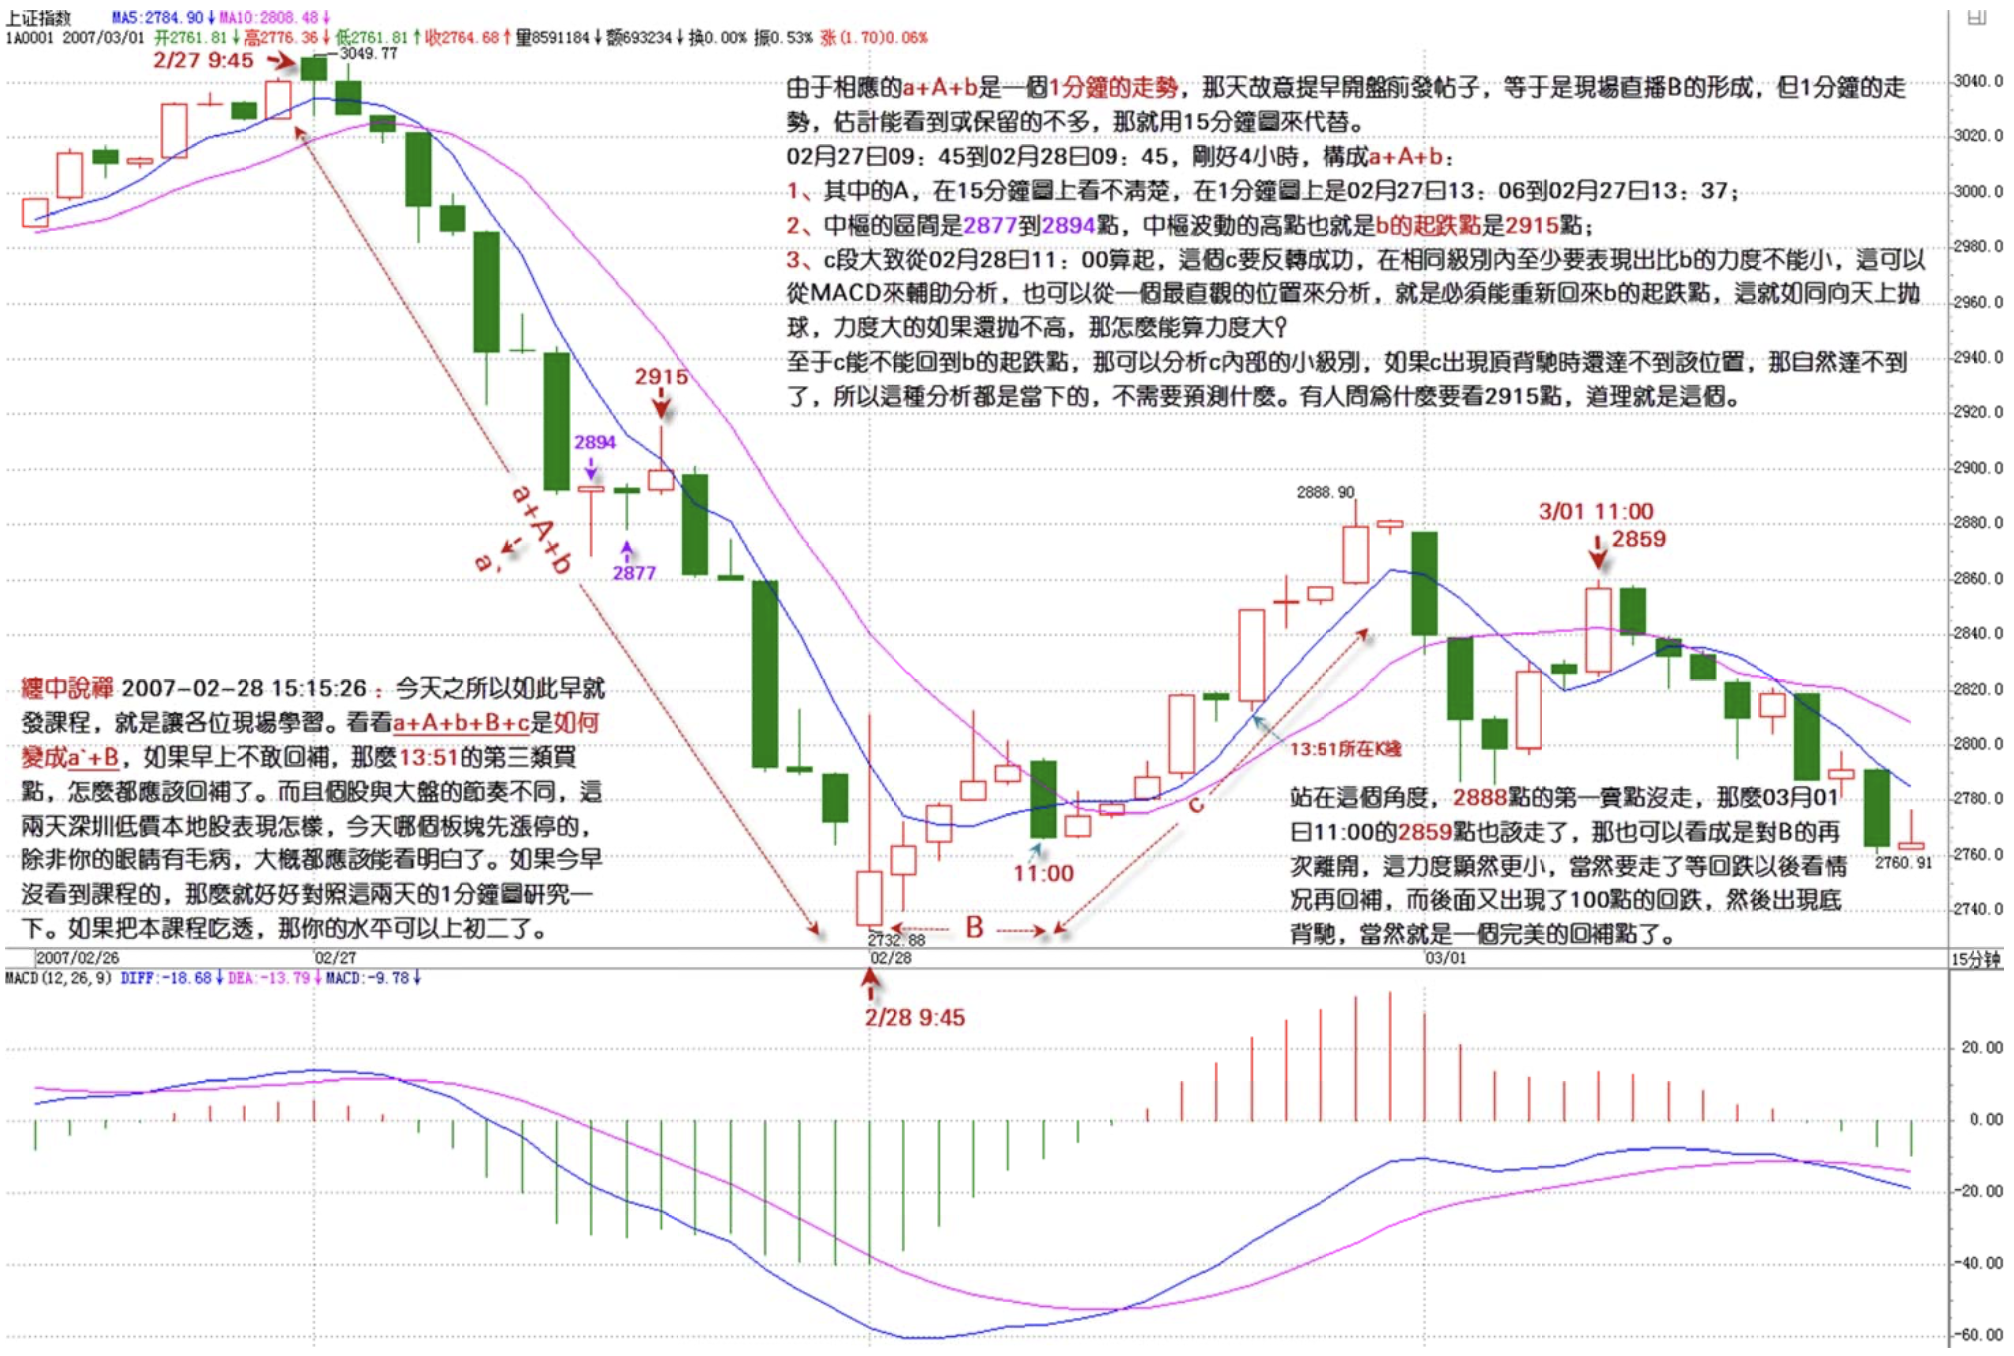
Since the corresponding a+A+b is a 1-minute movement, that day I deliberately posted early before the open — essentially a live broadcast of B's formation. But for a 1-minute movement, probably few could see or preserve it, so let's use the 15-minute chart as a substitute. From 02/27 09:45 to 02/28 09:45, exactly 4 hours, constituting a+A+b. The A within it can't be seen clearly on the 15-minute chart; on the 1-minute chart it's from 02/27 13:06 to 02/27 13:37, with the hub range at 2,877 to 2,894 points and the highest oscillation point around the hub — i.e., b's decline starting point — at 2,915 points. Segment c roughly starts from 02/28 11:00. For c to achieve a successful reversal, within the same level it must at least show force no less than b's. This can be assessed with MACD assistance, or from the most intuitive position: it must be able to return to b's decline starting point. It's like throwing a ball into the air — if the force is supposed to be great but can't even reach the same height, how can the force be called great? Whether c can reach b's decline starting point can be analyzed within c's own smaller levels — if c shows top divergence before reaching that level, then naturally it can't. So this analysis is entirely in the present moment, requiring no prediction. Some people asked why to watch the 2,915 level — that's the reason. As for also directing everyone to watch the 5-day MA, that was just an auxiliary method for those who couldn't follow. With such precise analysis, all moving averages are actually meaningless. And since c's force was insufficient, it naturally had to return to B — so the subsequent movement was extremely natural. From this angle, anyone who didn't exit at the 2,888 first sell point should have exited at 03/01 11:00's 2,859 — which can also be seen as another departure from B with even less force. Naturally you should exit and wait for a pullback before considering whether to buy back. Then another 100-point decline occurred, followed by a bottom divergence — of course that was a perfect buy-back point.
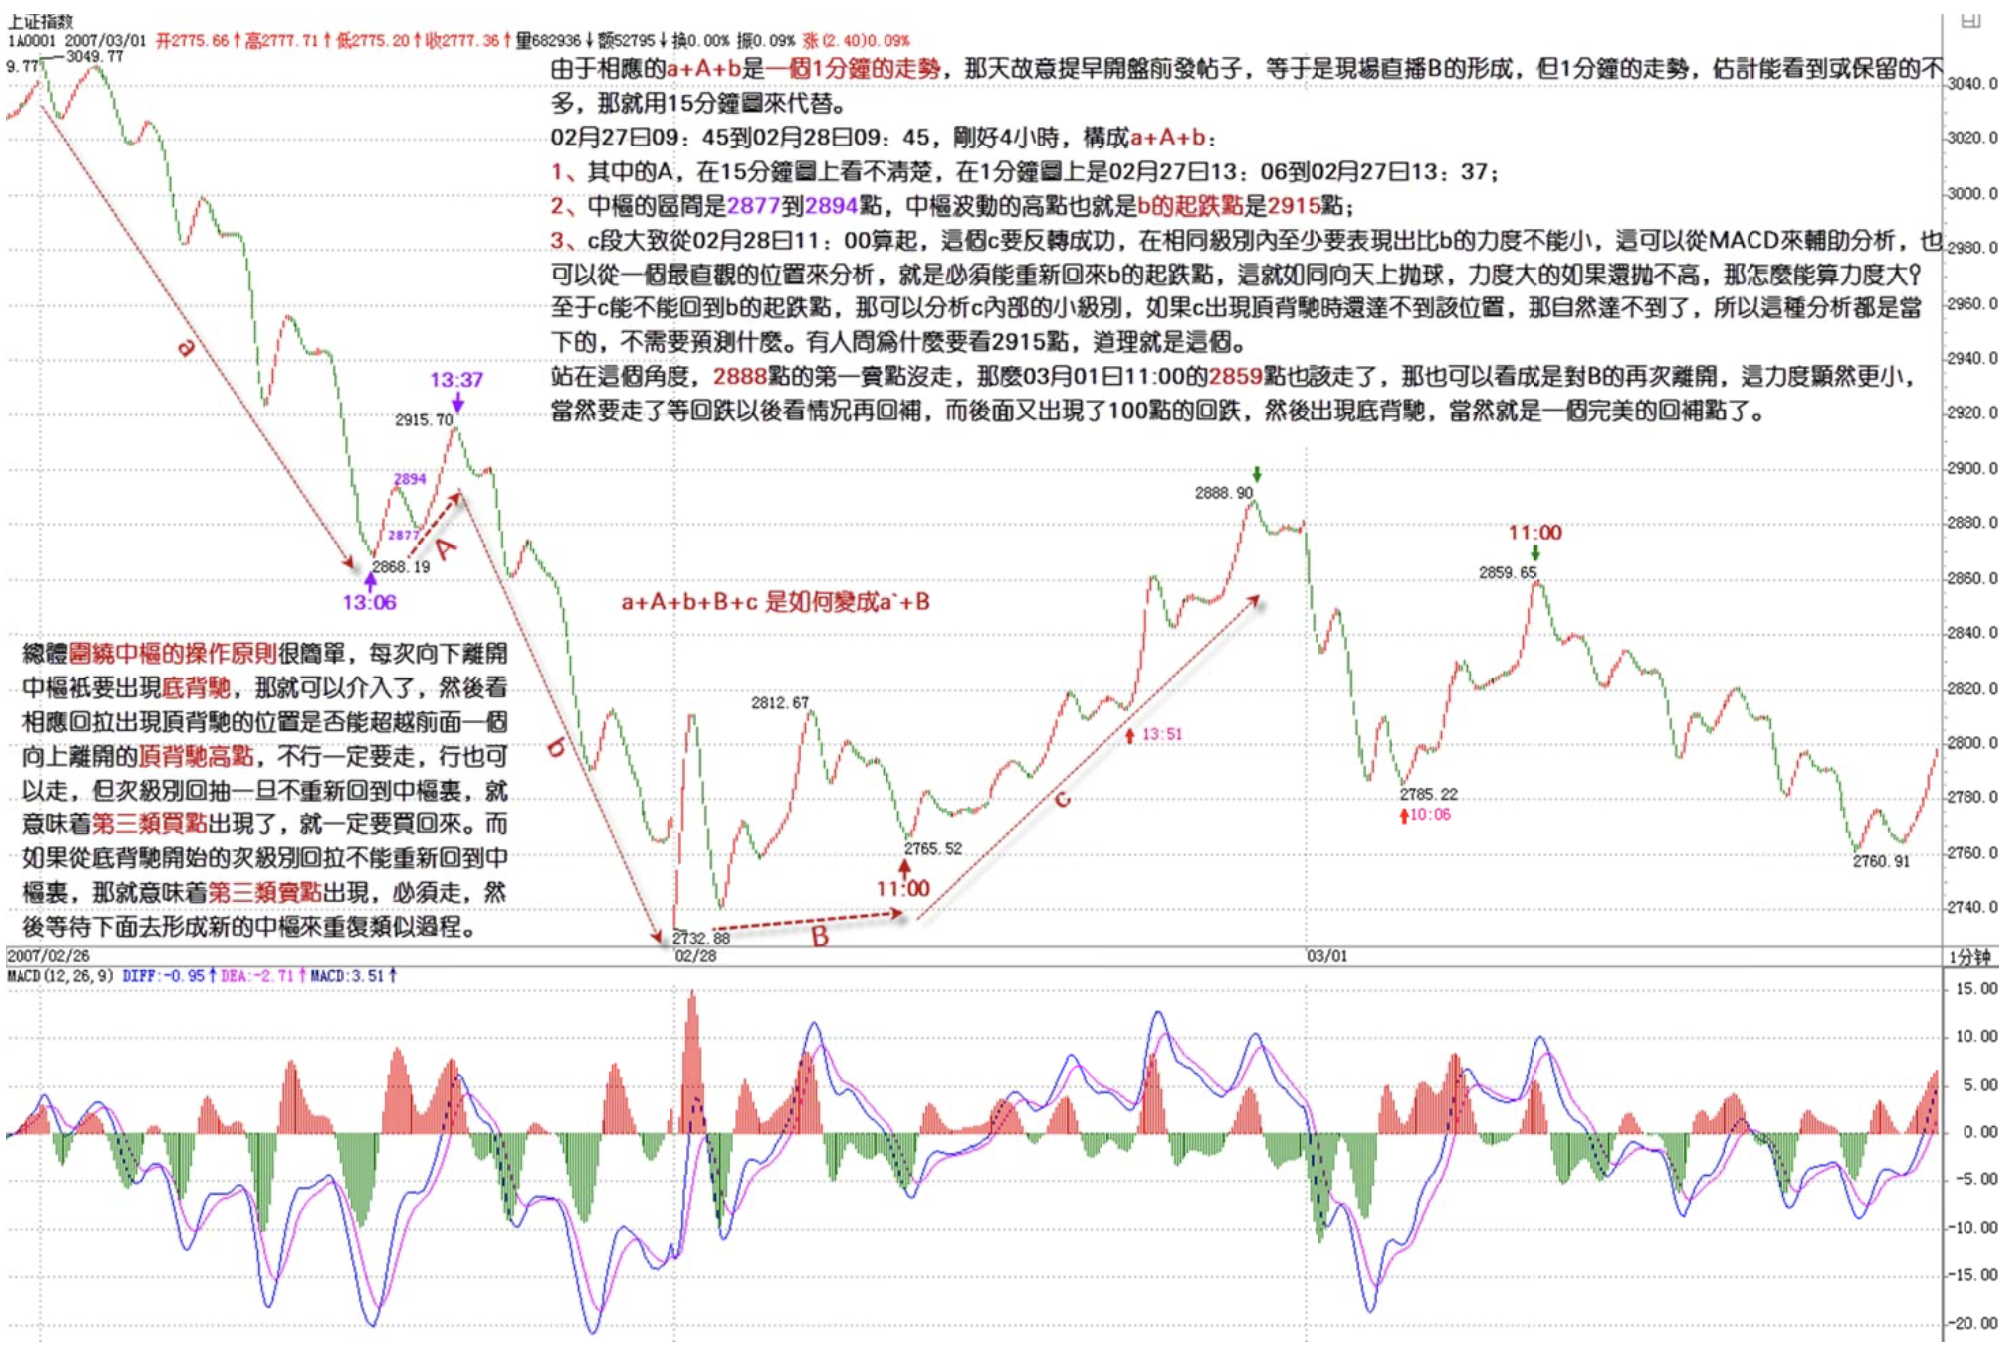
The overall principle of operating around a hub is simple: every time a downward departure from the hub shows bottom divergence, you can enter. Then watch whether the corresponding pullback's top divergence position can exceed the previous upward departure's top divergence high — if not, you must exit; if so, you can also exit, but once the sub-level pullback doesn't re-enter the hub, it means a third-type buy point has appeared, and you must buy back. If the sub-level pullback starting from the bottom divergence can't re-enter the hub, it means a third-type sell point has appeared and you must exit, then wait for a new hub to form below and repeat a similar process. Operating around a hub is really just that simple. Of course, without this ID's theory, such precise analysis would be impossible — just as without Newton's theory, people could only use myths to tell stories about stars.
However, these analyses all target the index. Individual stocks must be analyzed specifically. Many individual stocks, as long as the index isn't in a one-sided decline, will remain active and ignore the index, so you can't entirely follow the index. Actually, for indices, the greatest benefit lies in futures. However, futures have significant peculiarities — because futures allow opening positions at any time, unlike the basically stable quantity of stock certificates. So there are many differences in force analysis and other aspects, which we'll discuss later.
Replies
缠中说禅 2007/3/2 15:26:02
[Anonymous] angel
2007-03-02 15:22:35
Hello, first post,
Reading your blog, I feel you're very impressive. A question: can your stock trading techniques be applied to futures? Also, what percentage of your total technique do these published methods represent? (For the stock market only, not including the Analects and such.)
Please be sure to answer, thanks.
--
Technique is just superficial. It's people who use technique, not technique that uses people. Without becoming a person first, the higher the technique, the worse the death. Coming here and only learning technique is the most boring thing possible.
缠中说禅 2007/3/2 15:28:37
[Anonymous] 缠文观止
--
Please read the article first.
缠中说禅 2007/3/2 15:34:18
[Anonymous] Little Bird
2007-03-02 15:28:49
May I ask sister:
What kind of divergence causes the end of a certain level's movement?
I feel like it could be either a sub-level trend divergence or consolidation divergence?
Also, is consolidation divergence at a certain level caused by trend divergence at the sub-level?
--
Simply put, the end of any movement must be caused by divergence. Divergence at a certain level will at least end the movement of that level — there's no question about this. But it's not necessarily caused by sub-level divergence, otherwise studying a'+B and such would be meaningless.
缠中说禅 2007/3/2 15:37:11
[Anonymous] angel
2007-03-02 15:31:08
Chán Zhōng Shuō Chán
"Technique is just superficial. It's people who use technique, not technique that uses people. Without becoming a person first, the higher the technique, the worse the death. Coming here and only learning technique is the most boring thing possible."
What do you want us to learn here then? If not technique, what else?
--
If technique is all you see, then learn technique first. People can only learn what they can see. Once you see more, or need more, then continue looking for the non-technical aspects.
缠中说禅 2007/3/2 15:40:32
[Anonymous] Xiao Ming
2007-03-02 15:36:31
Chán Zhōng Shuō Chán
2007-03-02 15:26:02
[Anonymous] angel
2007-03-02 15:22:35
Hello, first post,
Reading your blog, I feel you're very impressive. A question: can your stock trading techniques be applied to futures? Also, what percentage of your total technique do these published methods represent? (For the stock market only, not including the Analects and such.)
Please be sure to answer, thanks.
--
Technique is just superficial. It's people who use technique, not technique that uses people. Without becoming a person first, the higher the technique, the worse the death. Coming here and only learning technique is the most boring thing possible.
-----------
That statement alone is enough. From now on I won't obsess over short-term ups and downs. Looking at the big picture — short-term prediction is too hard. Take today's market for example: I originally predicted a morning rally followed by an afternoon pullback, but reality was completely different.
Rather than exhausting yourself with short-term prediction, better to take a long view and go medium-term.
I'll upvote today's article but I'm not going to study it — it gives me a headache.
==
Technique alone isn't enough, but having no technique is even worse. Technique isn't prediction — it's grasping the present moment.
缠中说禅 2007/3/2 15:43:09
[Anonymous] 三藏
2007-03-02 15:28:04
Hello boss, there are three things I don't understand. Please guide me:
-
For example at the 5-minute level — say a decline — how many consecutive 5-minute K-lines of movement does it take to constitute a 30-minute level decline?
I wonder if it can be viewed this way. I'm not clear on the level concept here. -
Proposition 1: Two 5-minute movements forming a hub experience overlapping oscillation and expansion, causing the 30-minute movement to form one hub, which is also a daily hub (this level's movement constitutes a hub of the same level).
Proposition 2: One daily hub requires at least 3 thirty-minute movement types, and 3 thirty-minute movement types require at least 3 five-minute movement-formed hubs.
How are Propositions 1 and 2 contradictory? Or are my propositions wrong? -
For divergence below the 1-minute level, how exactly should I look at it? Today for 938, I failed to spot the divergence at 11.38 on the 1-minute chart — sorry for failing your theory...
Wishing the boss a great mood every day!!
==
Read today's lesson carefully first. Actually, none of these are real problems.
缠中说禅 2007/3/2 15:46:02
[Anonymous] 哈哈
2007-03-02 15:41:30
Does Chan sister mean that some trends also contain non-technical elements? Is that coming in later lessons?
==
As long as more than one person is trading, there are no non-technical trends.
缠中说禅 2007/3/2 15:50:42
[Anonymous] 古代
2007-03-02 15:32:01
Teacher, you are the Goddess of Wisdom!!
First, happy weekend!!! Teacher, don't forget Sunday's music session + Lantern Festival!!!
I want to hear the most beautiful music, Goddess of Wisdom!
==
The music session probably can't happen — that website still isn't fixed. Probably not until next week at the earliest. Saturday is rest day. This Sunday let's discuss how to sing together.
缠中说禅 2007/3/2 15:54:12
Wild Grass
2007-03-02 15:52:44
Teacher, I'm new here. Just checking in — starting today I'll learn from the teacher.
--
Start directly from the hub concept — that way you go straight to the core. Everything before that is just reference material.
缠中说禅 2007/3/2 15:59:54
[Anonymous] 面甲
2007-03-02 15:52:41
Chan sister, this lesson is written superbly! Resolved many of my doubts.
Could you explain the essence of hubs? And what's the relationship with ordinary resistance and support levels?
Following Chan sister's theory, I've grasped the market rhythm well during this period — so I haven't lost money.
But I haven't mastered individual stocks, so I haven't made money either. The low-priced stocks I bought today are all still consolidating — no action.
==
Select stocks by finding good buy points. In a bull market, the explosive power of third-type buy points is the strongest — for example on the daily chart. If you really can't find any, look for them on the 30-minute chart. You can take some promising sectors, low-priced stocks whose weekly charts haven't rallied yet, and add them to your watchlist — maybe 50 to 100 stocks. Then every day pick buy points from among these stocks. This way it won't be too tiring. Once you get the rhythm right, you can basically reach a state where after selling you can immediately buy something else, maximizing capital efficiency. Retail investors' capital is small — leverage that advantage. No need to participate in large-level adjustments. Remove stocks that have broken down from your stock pool and continuously swap in promising new sectors. Keep doing this and the results will be substantial.
缠中说禅 2007/3/2 16:01:38
[Anonymous] Little Bird
2007-03-02 15:59:54
For the third-type buy point, as long as it doesn't touch the hub's highest point, even if it touches the hub oscillation's highest point, it still counts, right?
==
A sub-level that doesn't fall back inside the hub qualifies. But if it doesn't even fall back to the highest point, that's naturally the strongest.
缠中说禅 2007/3/2 16:04:12
[Anonymous] 请教大势
2007-03-02 15:57:58
May I ask the blogger:
Has the Shenzhen local stock rally ended? Or will there be another week or two of activity?
With such huge volumes in Shenzhen local stocks these past two days, is the rally over?
Please give a hint. Thank you!!
==
Sectors must rotate — you can't stay in one sector forever. Otherwise, how did the military-industrial sector take off today? If you're a retail investor, select several sectors, sell at sell points first, rotate between them — this maximizes efficiency. Of course, you can also stick to one sector and keep making short-term trades — that's also quite efficient.
缠中说禅 2007/3/2 16:05:22
[Anonymous] 满目山河
2007-03-02 16:03:52
"Select stocks by finding good buy points. In a bull market, the explosive power of third-type buy points is the strongest — for example on the daily chart. If you really can't find any, look for them on the 30-minute chart. You can take some promising sectors, low-priced stocks whose weekly charts haven't rallied yet, and add them to your watchlist — maybe 50 to 100 stocks. Then every day pick buy points from among these stocks. This way it won't be too tiring. Once you get the rhythm right, you can basically reach a state where after selling you can immediately buy something else, maximizing capital efficiency. Retail investors' capital is small — leverage that advantage. No need to participate in large-level adjustments. Remove stocks that have broken down from your stock pool and continuously swap in promising new sectors. Keep doing this and the results will be substantial."
=======
That sounds great, but if the execution isn't right, everything becomes ambiguous and the rhythm gets disrupted easily.
==
Of course the prerequisite is that you must master the theory first. But without practice, mastering theory is very difficult. Paper trading is useless.
缠中说禅 2007/3/2 16:13:17
Little Muddled Little Dance
2007-03-02 16:07:41
May I ask the blogger: regarding this c segment after B — no matter how it develops, as long as it ultimately hasn't formed a hub of the same level as B, then hub B continues to exert its influence?
==
Correct. To be precise: at least the same level and non-overlapping. Of course, larger ones count too. The original one doesn't lose its effect — rather, it's integrated into a larger hub system to exert influence. The layered relationships of this hub system will be discussed later. For ordinary operations, especially short-term, handling one hub well is already plenty.
缠中说禅 2007/3/2 16:14:33
Two Tigers
2007-03-02 16:12:30
May I ask the blogger:
Has the Shenzhen local stock rally ended? Or will there be another week or two of activity?
With such huge volumes in Shenzhen local stocks these past two days, is the rally over?
Please give a hint. Thank you!!
====
I just bought into Shenzhen local stocks today, and the rally is already over?! I was feeling pretty proud about following the fairy sister closely!
==
This sector has been mentioned for how many days now? Don't keep repeating the mistake of refusing to buy 999 at 6 yuan, then buying at 12. Of course, buying at 12 isn't necessarily a problem, but you'll need to spend some time waiting.
缠中说禅 2007/3/2 16:17:53
[Anonymous] 请教
2007-03-02 16:12:01
Chan Theory consolidation: In any level of any movement, a completed movement type containing only one Chan Theory hub is called consolidation of that level.
Chan Theory hub: In a certain level's movement type, the portion overlapped by at least three consecutive sub-level movement types.
Question: Consolidation is a type of movement that needs hubs to define it, but hubs need movement types to define them. How should this be understood?
Can any brother or sister help explain?
==
Recursion. The lowest-level hub is formed by just three K-lines. Then proceed using a form like a(n+1) = f(a(n)). As for concepts like consolidation and trend, they're actually unnecessary — they're just accommodations for everyone's habits. The only truly useful concept is the hub — everything else is superfluous.
缠中说禅 2007/3/2 16:19:05
[Anonymous] Little Bird
2007-03-02 16:17:10
"Once 6 segments of extension appear, plus the original three segments forming the hub, it constitutes a hub of the next larger level."
What is this? Quantitative change causing qualitative change?
You've said consolidation + consolidation is still consolidation. So if a 30-minute hub's three 5-minute movements each contain only one 5-minute hub, isn't that consolidation + consolidation + consolidation, which is still one 5-minute hub? Is it because of what you said that it becomes a 30-minute hub?
==
Consolidation + consolidation is still consolidation, but add enough and it becomes large-level consolidation — there's no problem here. Consolidation also has a level dimension.
缠中说禅 2007/3/2 16:21:28
Two Tigers
2007-03-02 16:18:04
Fairy sister! 600151, this military-industrial stock, had an ordinary performance today!
Holding it and being tossed around by the market maker is quite painful — riding the elevator up and down.
Still more comfortable buying sister's stocks.
==
They're all the same — they'll all perform well eventually. And within the military-industrial sector, this ID's focus isn't actually 343 — it's a small-cap stock, not very interesting — but rather another aerospace stock. No need to elaborate further — anyway, everything else will rise too.
缠中说禅 2007/3/2 16:25:46
Sorry, discussing stocks on the weekend makes this ID feel a bit unwell. Life is short — can't always be about stocks. This ID is logging off, about to go out and cause some mischief. I'll be back Sunday to discuss singing together.
Logging off. Bye.
缠中说禅 2007/3/2 15:21:15
Today's expected military-industry-related positive news gave us another weapon against the traitors. CITIC's upcoming issuance means the traitors can no longer suppress financial stocks so recklessly. Currently the key is psychological repair, using oscillation to shake out the uncommitted.
For the market's technical trend, with today's lesson you can analyze it yourself. If you can't see it, then use the 5-day MA. Two Sessions ending is a sensitive period, and early next week is psychologically sensitive because, reportedly, the traitors and their lackeys both have a "Monday syndrome."
Nothing much to say about individual stocks. Now that you've learned more, you should find stocks yourself — don't all pile into the same ones. Though this ID doesn't mind increased operational difficulty, it actually hurts everyone. What you find yourself tastes the best — what you're learning here is the method. Among low-priced stocks, historically active sectors like tech (including 3G), tourism, and so on are good places to look. But stock selection must follow technical analysis — find those with third-type buy points, or at least ones that have just risen from a third-type buy point.
I estimate few people still hold 999 now. Those who were thrown off the train needn't despair — your level is on par with a certain famous fund with a traitor-like name that lost tens of millions of shares due to redemptions. This is truly wonderful news. The situation with 343 is the same — this is about punishing those traitors. But the traitors still have shares, and this ID now wants to provoke them — they'd better dump them all out.