Teaching You to Trade Stocks 90: Auxiliary Judgment for Bardo Phase Ending Time
2007/12/3 22:33:08
Note: what's given here is an auxiliary judgment for the bardo phase ending time, not an absolute judgment. Just like using MACD to judge divergence, it's only auxiliary. But because the accuracy is extremely high, and the absolute judgment is too complex to be practical, this can generally be used for making judgments. Generally speaking, the effectiveness of this auxiliary judgment for bardo phase ending time can approach 100%, with very few exceptions.
Of course, since it's auxiliary, technique and proficiency are crucial. It's like performing acrobatics — a well-trained performer rarely makes mistakes on stage, while someone with no training at all will definitely mess up the moment they step up.
This auxiliary judgment utilizes an indicator available in all software: Bollinger Bands. Generally displayed as BOLL in software. This indicator usually has three lines — upper, middle, and lower bands. Generally speaking, running above the upper band or below the lower band indicates a super-strong state. This inevitably occurs during hub shifts — the only difference is the former represents an upward super-strong state, while the latter represents a downward super-strong state.
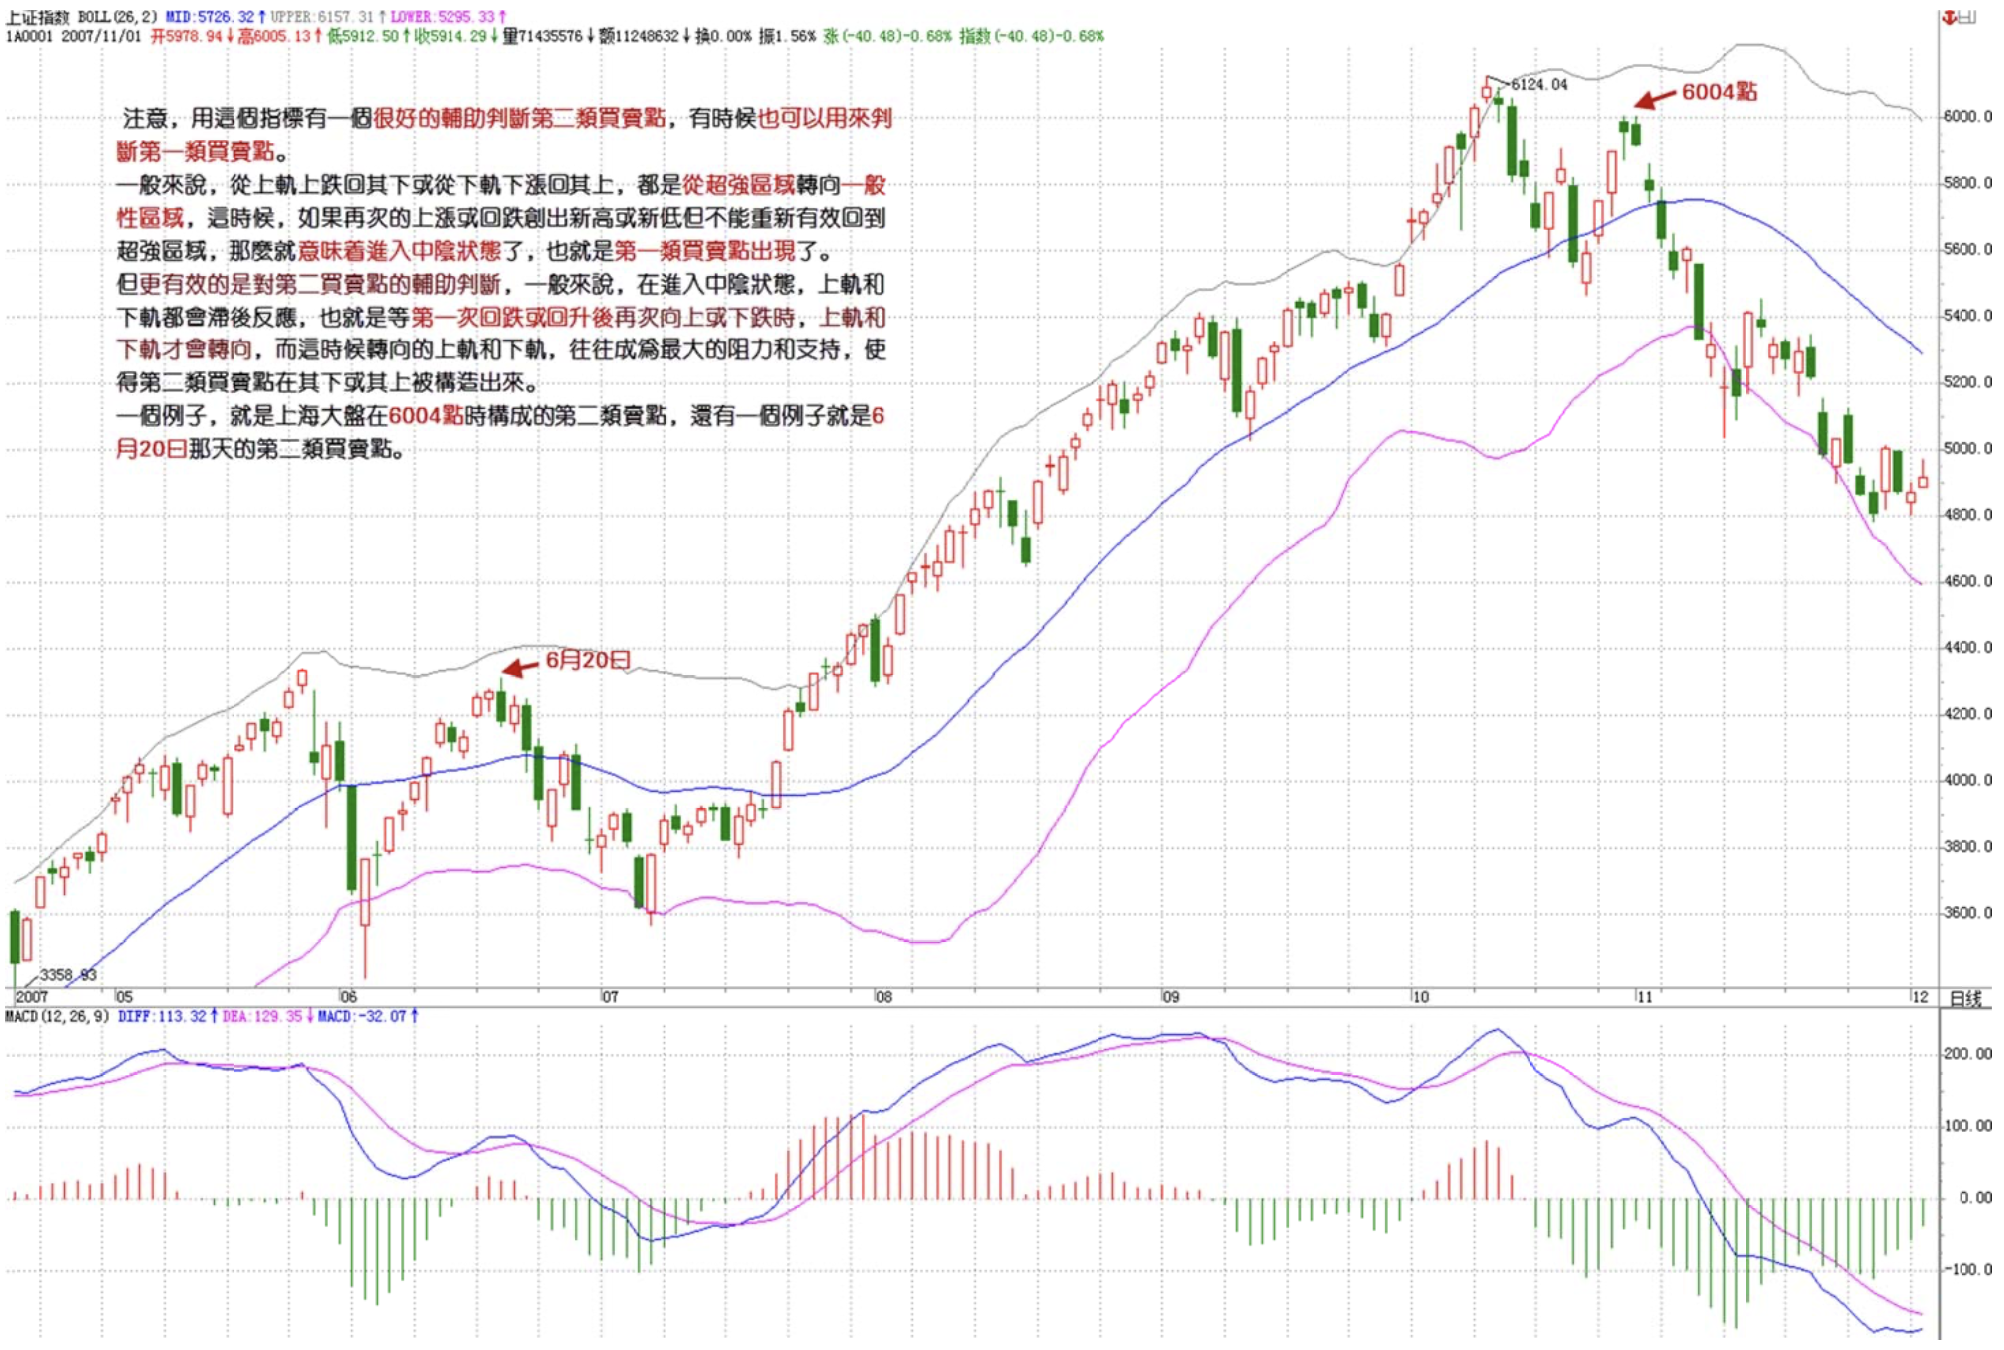
Note, this indicator provides an excellent auxiliary judgment for second-type buy/sell points, and sometimes can also be used to judge first-type buy/sell points. Generally speaking, falling back below the upper band from above, or rising back above the lower band from below, both represent transitioning from a super-strong zone to a normal zone. At this point, if a subsequent rise or decline creates a new high or new low but fails to effectively return to the super-strong zone, it means a bardo state has been entered — that is, a first-type buy/sell point has appeared.
But even more effective is the auxiliary judgment for second-type buy/sell points. Generally speaking, upon entering the bardo state, the upper and lower bands will react with a lag — meaning they only turn after the first pullback or bounce, and then the subsequent move up or down. At the point when the upper and lower bands turn, they often become the strongest resistance and support, causing second-type buy/sell points to be constructed below or above them. One example is the second-type sell point formed at the Shanghai market's 6004 level, and another example is the second-type buy/sell point on June 20th.
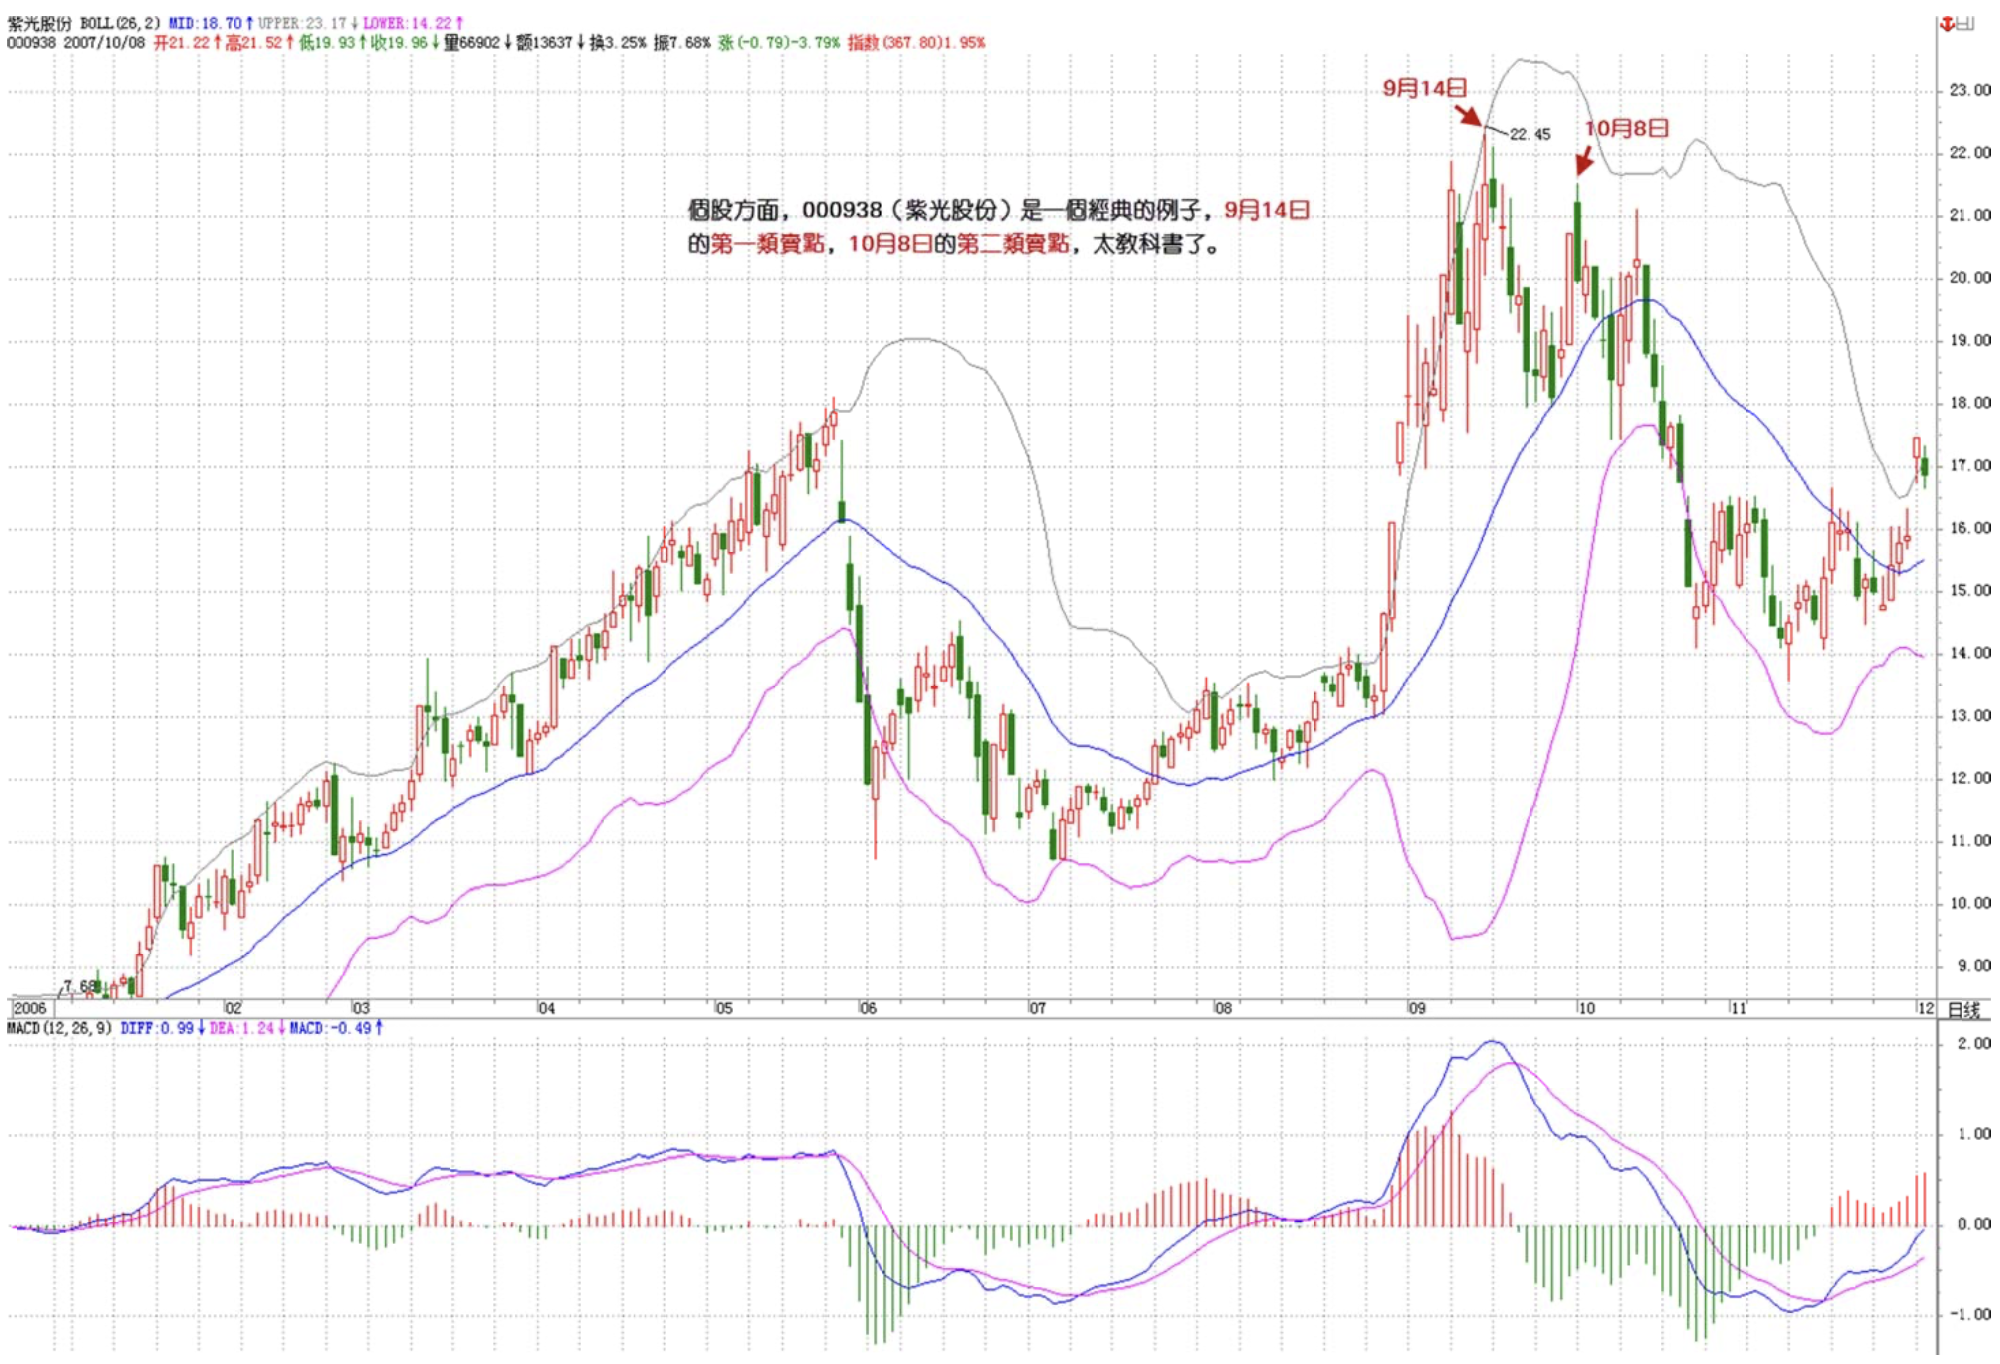
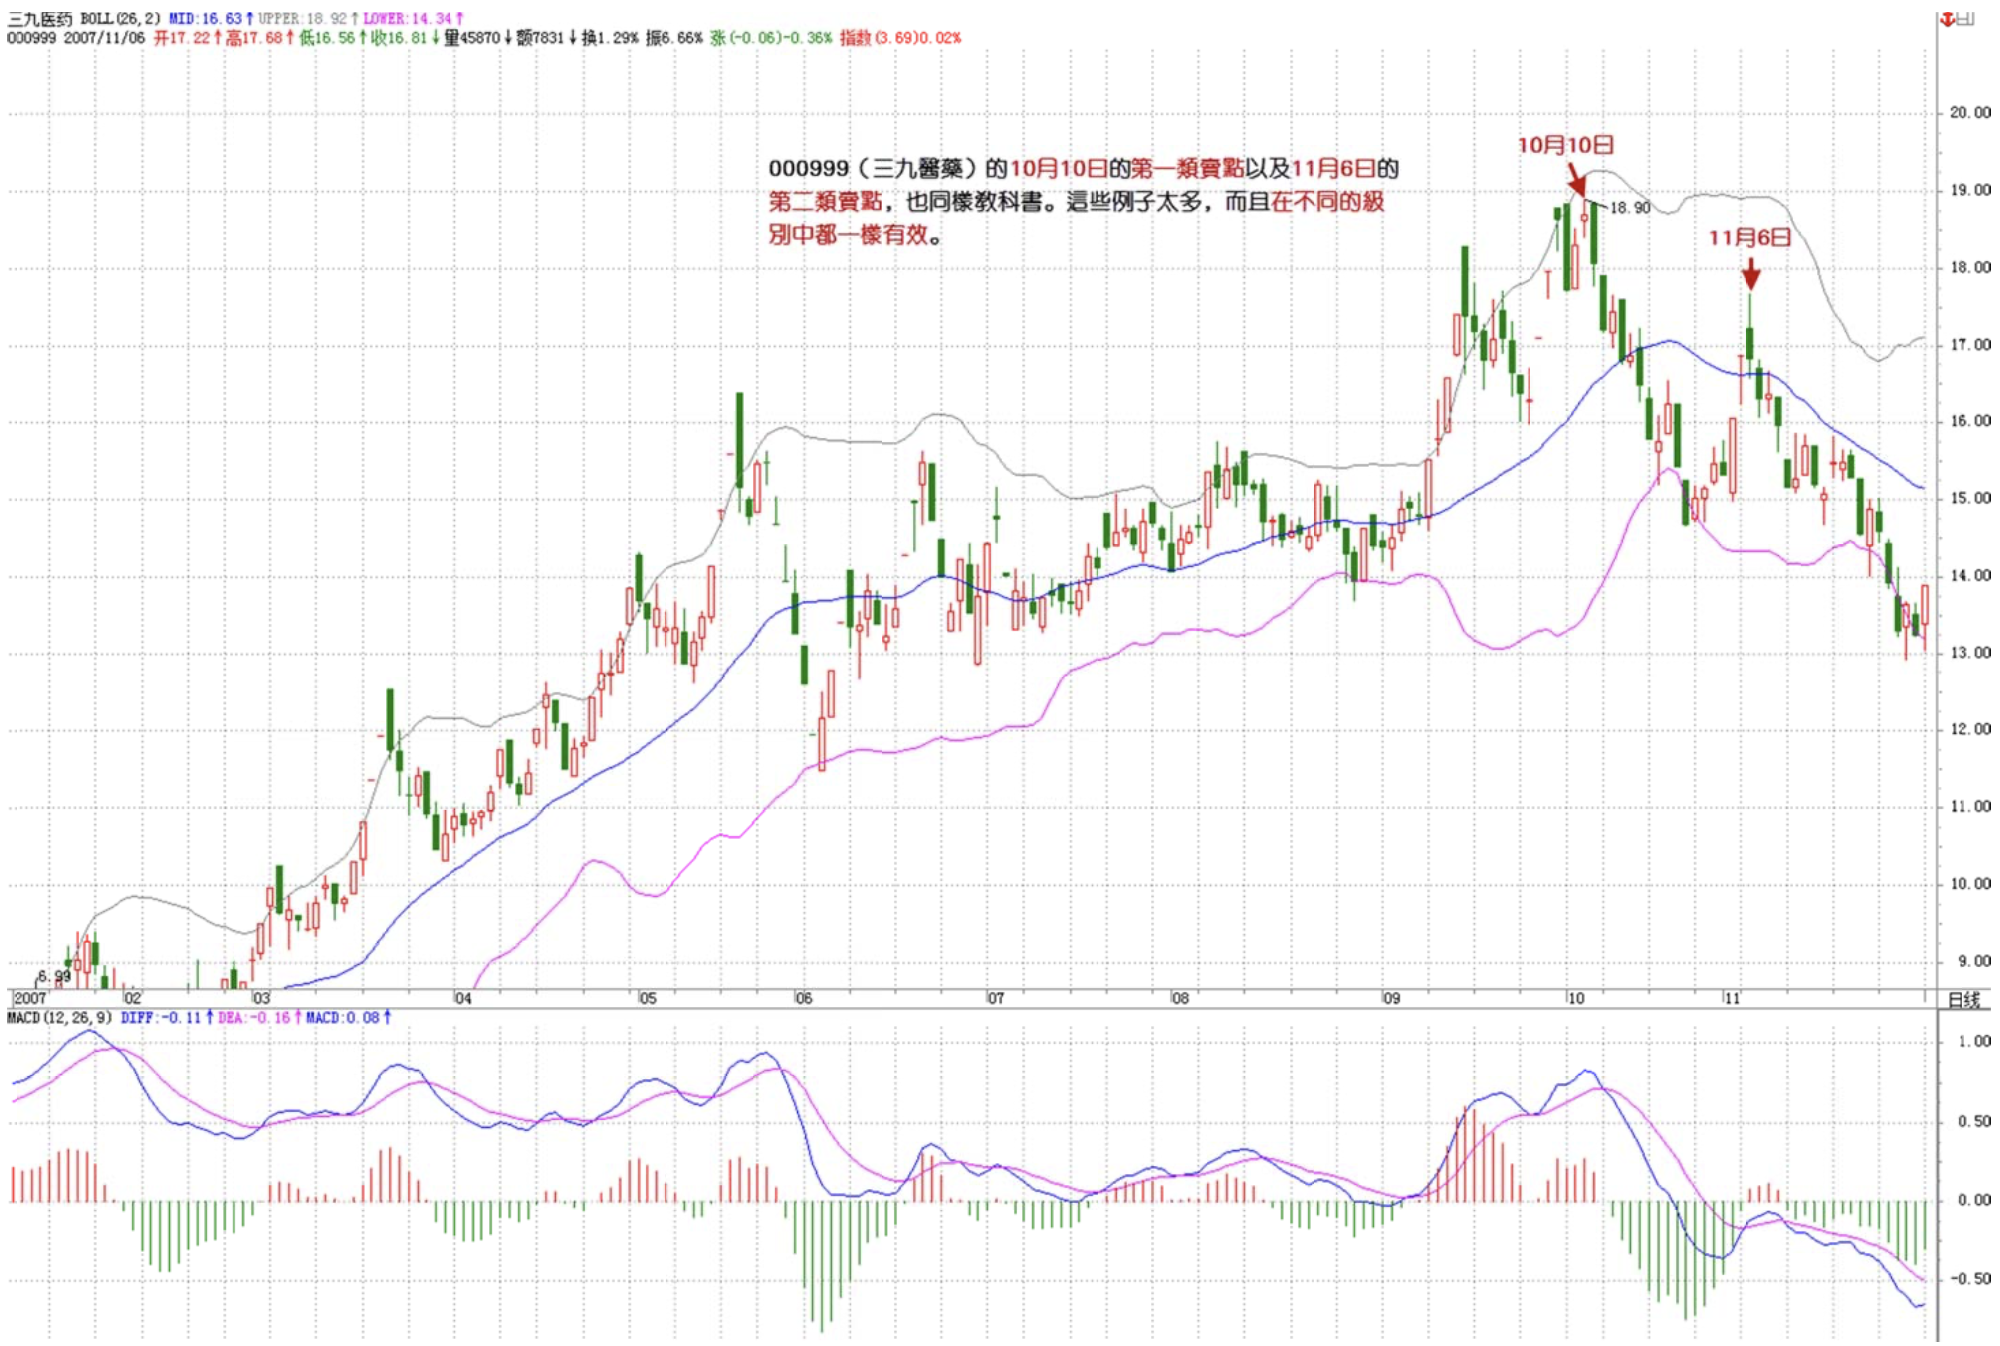
For individual stocks, 000938 is a classic example — the first-type sell point on September 14th, the second-type sell point on October 8th, absolutely textbook. 000999's first-type sell point on October 10th and second-type sell point on November 6th are equally textbook. There are too many such examples, and they work equally effectively across different levels.
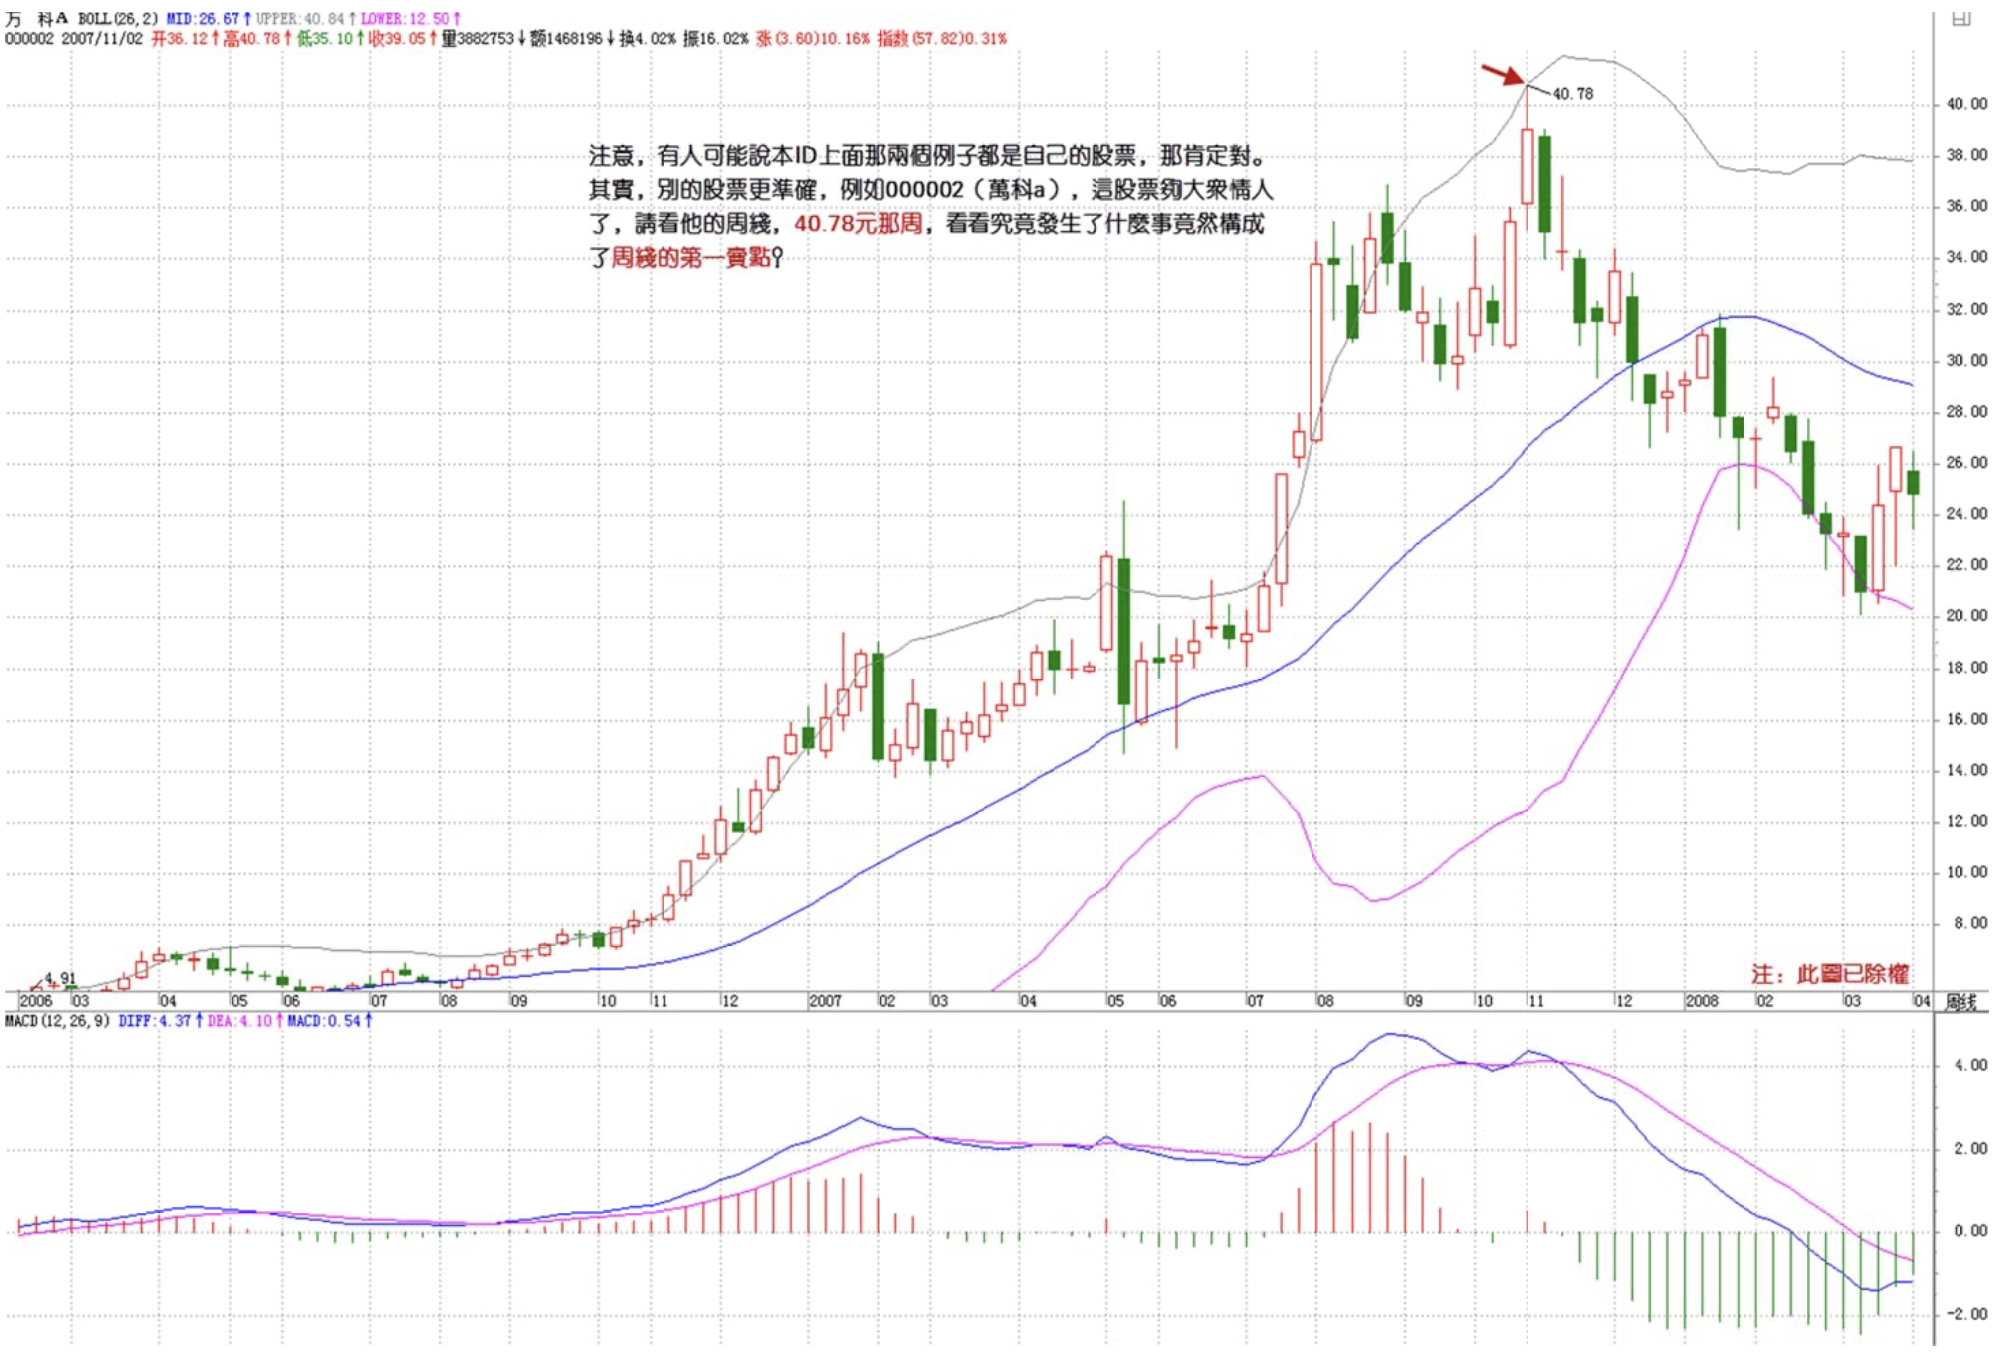
Note, some people may say the two examples above are this ID's own stocks, so of course they'd be accurate. Actually, other stocks are even more precise. For example, 000002 — this stock is popular enough for the masses, right? Look at its weekly chart: the week of 40.78 yuan — what exactly happened to form a weekly first-type sell point?
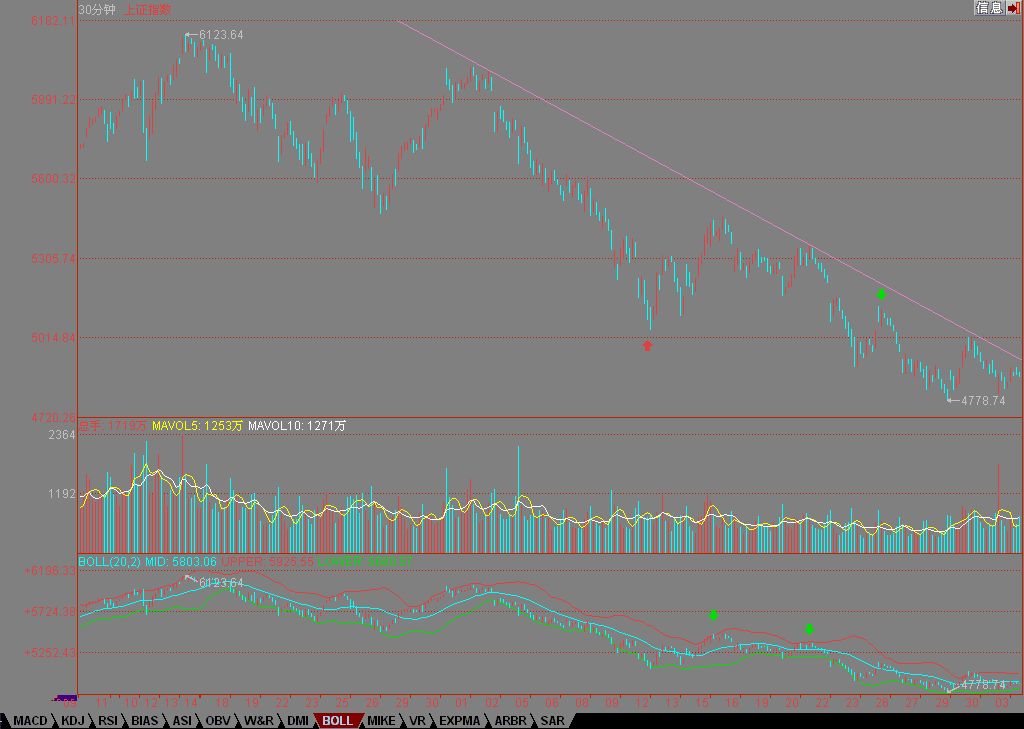
However, the most useful application of Bollinger Bands is the pre-judgment of bardo ending time. Generally speaking, the contraction of Bollinger Bands is the best indication of when the bardo will end. But there's some technique involved — a 1-minute level doesn't necessarily mean looking at 1-minute Bollinger Bands. For example, in the chart below, a 5-minute bardo process corresponds to looking at the 30-minute Bollinger Bands.
Generally speaking, when the Bollinger Bands at a certain level contract, it means some bardo process at a lower level is about to either expand in level or end. This typically corresponds to a third-type buy/sell point at the appropriate level.
Please study the chart below carefully — it also contains the descending channel mentioned this afternoon. You can see how close the price is to the upper band now.
Note, this auxiliary judgment requires slightly more technique than the MACD technique. You must constantly study charts and summarize your own experience to gain proficiency. This ID here is only pointing at the moon for everyone. To make the moon your own, you still need to put in the effort yourself.