Teaching You to Trade Stocks 81: Illustrations, Corrections, and the Philosophical Essence of Fractals and Trend Types
2007/9/17 22:57:16
Please first look at a reply post:
[Anonymous] Made money
2007-09-17 17:36:23 Happy vs Veggie Bug Delete all comments by this person
2007-09-17 17:24:59 Diagram 1:
               5   7
---------------------------------------/-
----------------/\--------------------/--
---------------/--\----/\------/\----/---
--------------/----\--/--\----/--\--/----
-------------/------\/----\--/----\/-----
------------/--------------\/------------
-----------/-----------------------------
----/\----/------------------------------
---/--\--/-------------------------------
--/----\/--------------------------------
-/---------------------------------------
Diagram 2:
----------------------------------------/
---------------/\----------------------/-
--------------/--\----/\--------/\----/--
-------------/----\--/--\------/--\--/---
------------/------\/----\----/----\/----
-----------/--------------\--/-----------
----/\----/----------------\/------------
---/--\--/-------------------------------
--/----\/--------------------------------
-/---------------------------------------
Dear Chan jie, may I ask: how many segments does Diagram 1 have, and how many does Diagram 2 have???
==================================
If 5 = 7 or 5 is lower than 7, both have one segment. If 5 is higher than 7, both have 3 segments.This afternoon, when this ID was answering questions while being interrupted by constant phone calls, the answer given was not entirely complete, because this ID was answering based on the diagram showing 7 not lower than 5. Coming back in the evening, I found that someone had already written out the complete correct answer, so a big red flower must be awarded.
Both of these cases belong to the second type of line segment destruction, so we must consider the characteristic sequence of the downward movement from the high point, and must consider inclusion relationships. That's why the above commenter's answer is the complete one.
Additionally, someone mentioned the last diagram in Lesson 71. That diagram is obviously wrong — the problem is similar to this case, where position 7 was drawn too high. The position analogous to 7 should be lower than the position analogous to 5 — only then would it be three segments. When drawing it at the time, I didn't pay special attention. So this must be pointed out here.
Therefore, everything should follow the definitions — once you have the definitions clear, everything becomes manageable. Even if this ID draws something wrong, you should be able to spot it at a glance.
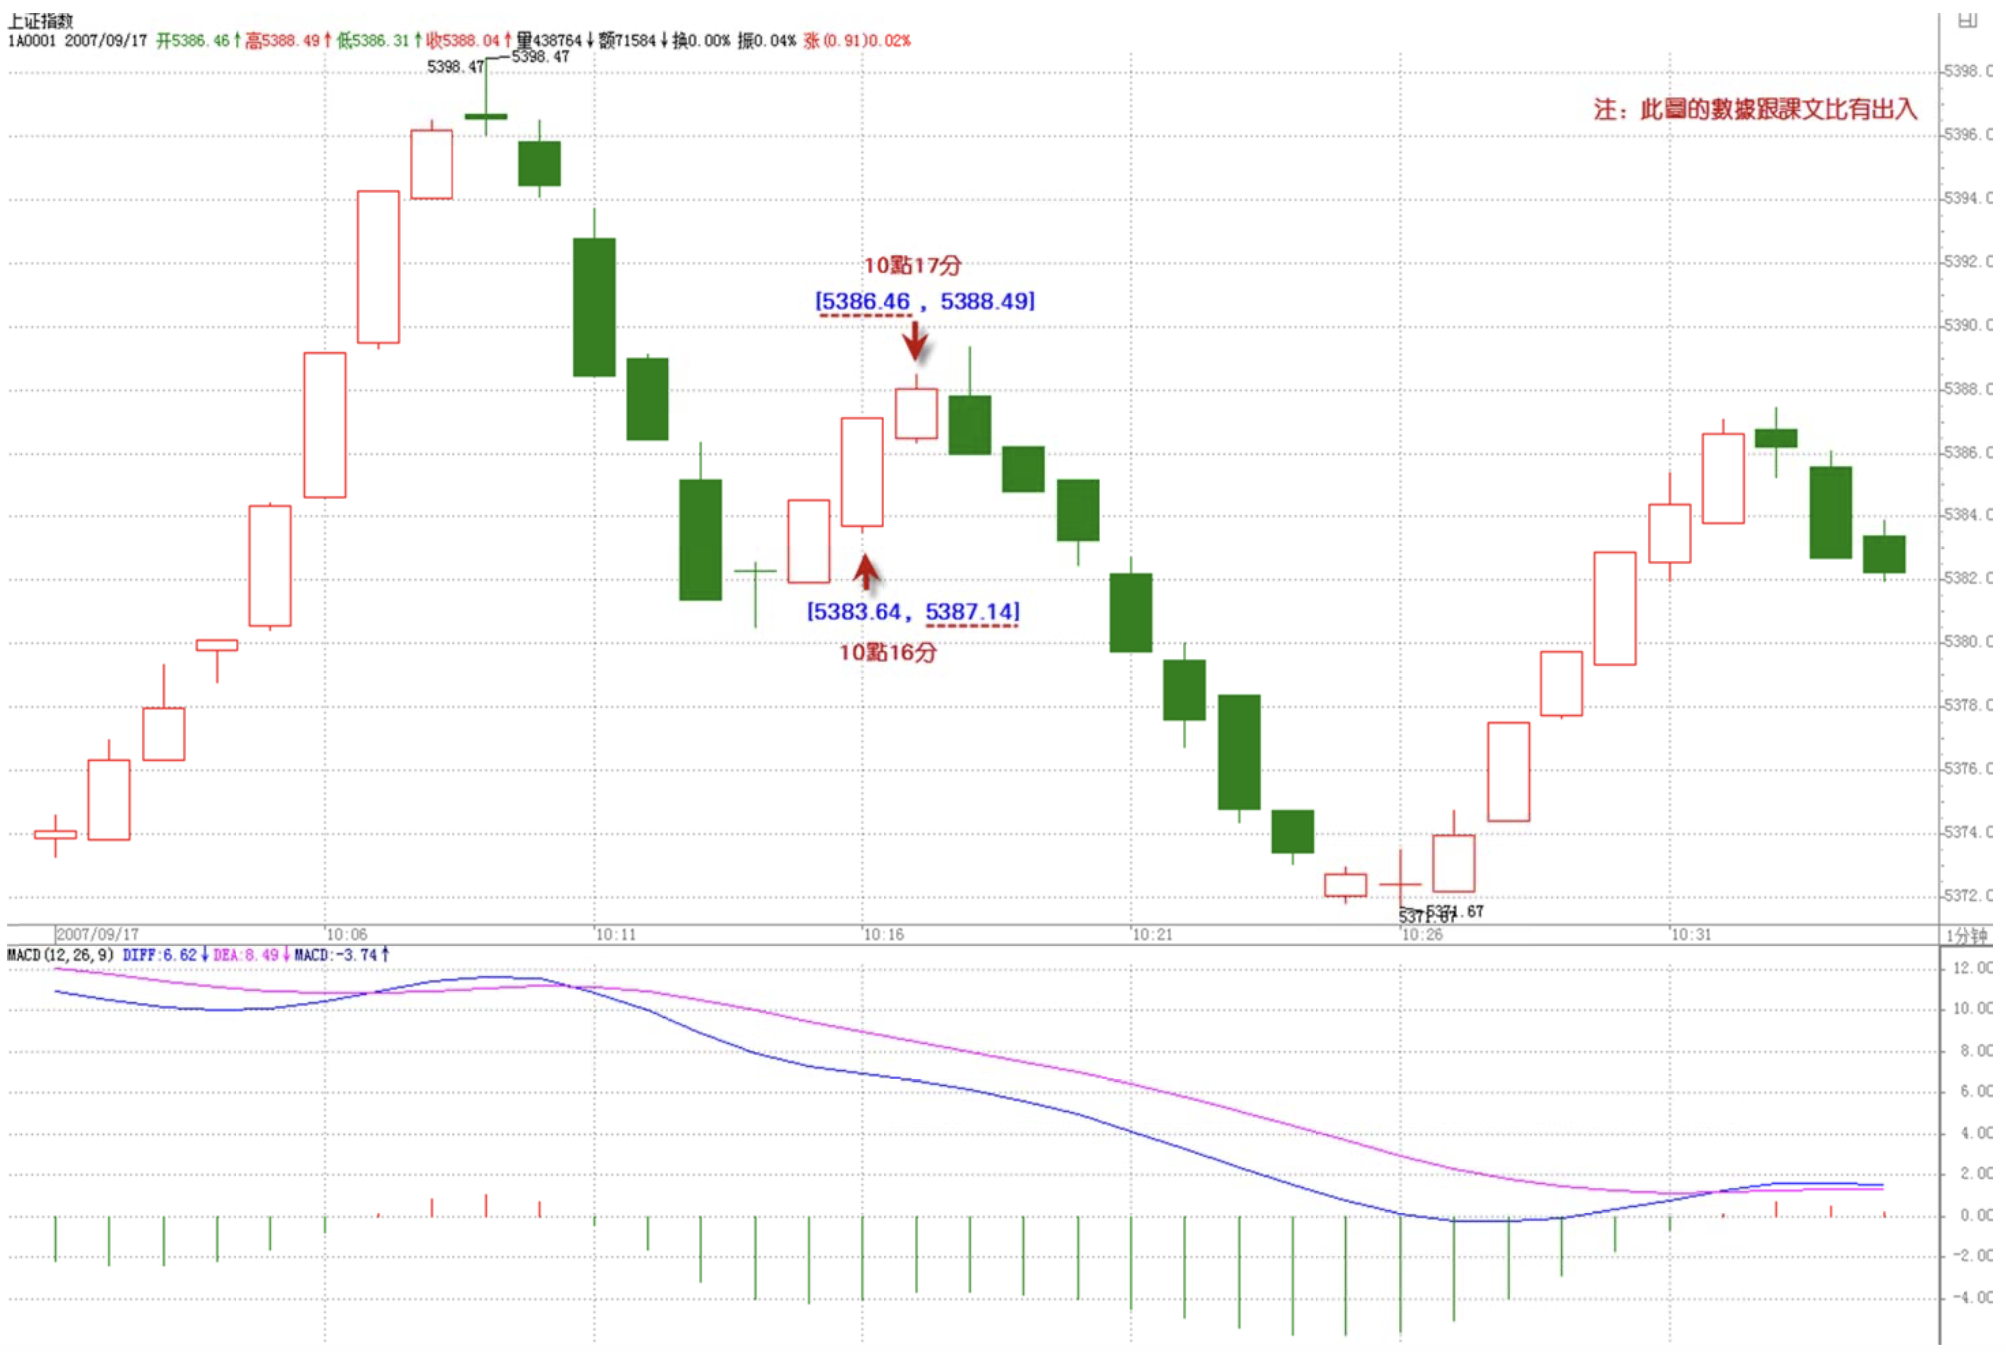
Additionally, let me raise an issue. Today's trend division has some peculiarities. What this ID said this afternoon had some problems. The main issue is that the low point at 10:17 of 5386.47 is higher than the 5386.39 from one minute earlier, so the top of the top fractal is at the 10:17 timestamp — therefore that point constitutes a stroke. But visually on the chart, the top appears to be at the 16th minute mark. Writing too hastily this afternoon, I didn't compare carefully. Coming back tonight and carefully comparing the data, I discovered that point should indeed constitute a stroke, so the entire division needs to be somewhat modified. That is, a 1-minute hub formed today. The first segment before the hub is simple; the key is the second and third segments — how exactly they should be divided. Those who can correctly divide them are at least passing in line segment division. The answer will be revealed tomorrow afternoon — you can compare.
Everyone should learn from this ID's afternoon mistake going forward: for those with only 5 or 6 K-lines, you must check carefully whether there are inclusion relationships among them. Only then will you avoid careless errors — this is where mistakes most easily occur.
Someone might ask: can just that 0.08 difference really affect the entire market? What's strange about that? If you know certain physics theories, you'd know that according to those theories, the reason our world is the way it is comes down to some extremely minute differences. Without those differences, the world would certainly not be what it is now. Also, please note: you must always use the same software. This way, the measurement precision or error is essentially consistent, maintaining the entire division on the same error or precision basis.
Enough with the digressions — let's enter the new lesson.
Why study fractals, trend types, and such things? What is their philosophical foundation? It is human greed, anger, delusion, doubt, and arrogance. Because everyone's greed, anger, delusion, doubt, and arrogance are the same — they just vary in magnitude depending on time and environment. This is what gives rise to self-similarity. And since trends are the combined-force result of everyone's greed, anger, delusion, and doubt, when reflected in trends, they cause trends to exhibit self-similarity.
The essence of fractals and trend types is self-similarity. Likewise, the essence of "all trends must complete" is also self-similarity. A fractal has this structure at the 1-minute level, and the same structure on the yearly chart. At different levels, the levels differ, but the structure is the same — this is self-similarity. The same applies to trend types.
Precisely because trends possess self-similarity, trends are comprehensible and graspable. Without self-similarity, trends would inevitably be incomprehensible and impossible to grasp. To grasp trends is essentially to grasp their self-similarity.
Self-similarity has another most important characteristic: self-similarity can self-organize levels. In the above text, mentioning levels first is not strictly correct. Levels are self-organized — or rather grown — from self-similarity. Self-similarity is like the genetic code; according to this code, this blueprint, trends grow different levels automatically as if they were alive. No matter how the people constituting the trends change, as long as their greed, anger, delusion, and doubt remain unchanged, as long as they're all human, self-similarity will exist, and the self-organization of levels must necessarily exist.
The philosophical essence of this ID's theory lies in the self-similarity triggered by human greed, anger, delusion, doubt, and arrogance, and the resulting self-organization of trend levels — a quasi-life phenomenon. Trends are alive. When this ID says "watching a trend unfold is like hearing a flower blossom, seeing a flower's fragrance, smelling a flower's beauty — everything is radiant in the present moment," this is absolutely not some pretentious metaphor in the style of Confucius the male — it is a statement of scientific rigor. Because trends truly do possess flower-like life characteristics; trends truly sprout, grow, bloom, and wither through self-similarity and self-organization.
Therefore, this ID's theory is a developable theory that can provide endless research opportunities for countless people. What is the research direction? It is the self-similarity and self-organization of trends. Here, combining with various disciplines of modern science, there are broad prospects and developmental potential.
So this ID's theory is not a set of dead dogma, but a life science discipline.
For now, this ID is only presenting to you the simplest forms of self-similarity: fractals and trend types.
Within this ID's theory, there is a most important theorem: for every distinct self-similar structure, there exists a correct path for analyzing the stock market. Any stock market analysis method that departs from self-similarity is essentially wrong.
Clearly, fractals and trend types are two non-isomorphic self-similar structures. We can find many similar structures, but for now, let's first fully understand these two most fundamental structures. All roads lead to Rome — just mastering these two structures will get you to Rome. Finding and researching other structures is essentially a matter of theoretical interest. And the question of operational differences corresponding to different self-similar structures is a major theoretical problem in its own right.
There is also an as-yet-unsolved problem in this ID's theory: exactly how many self-similar structures can a trend accommodate? There's an even more interesting question: the influence of initial trading conditions on the generation of self-similar structures. If this problem were solved, then truly scientific market regulation could be achieved.
This ID's theory can continue to expand and also be refined further. For example, the selection of self-similar structures under different trading conditions is a theoretical problem of refinement.
What are self-similar structures useful for? The uses are immense. A simplest conclusion: all tops must be top fractals, and conversely, all bottoms must be bottom fractals. Without self-similar structures, this conclusion obviously couldn't hold. But precisely because self-similar structures exist, we have such a conclusion that applies to any stock, any trend.
Conversely, from this conclusion, we can immediately derive this 100% correct conclusion: without a top fractal, there is no top; conversely, without a bottom fractal, there is no bottom. In practical operations, if on the K-line chart of your operating level, no top fractal appears, you can hold and sleep peacefully — wait for a top fractal to appear before doing anything.
Furthermore, with self-similar structures, the trend development at any given level is independent. That is to say, for example, a hub oscillation at the 30-minute level and an uptrend at the 5-minute level — these two levels don't conflict with each other. Instead, they form something like a system of simultaneous equations. If the solutions to a single equation are many, then when solved simultaneously, the solutions decrease dramatically. In other words, the existence of levels allows trend judgments to be combined — to be viewed comprehensively and systematically — making the boundary conditions for possible trend developments remarkably simple.
So when viewing trends, you cannot look at just one level — you must view them three-dimensionally. Otherwise, you're wasting the favorable conditions that self-similar structures provide.
I can't go on — it's almost 11 p.m., and I got home too late today. This topic will continue to be discussed in future lessons.
Signing off, goodbye.