Teaching You to Trade Stocks 59: Chart Analysis Demonstration Four
2007/6/14 8:23:43
Business trip — three charts are needed to cover the missed movements. For those just learning analysis, the hardest part is distinguishing line segments. So on each chart, numbers continue to mark each line segment, from which it shouldn't be hard to learn how line segments are actually divided.
Someone might ask: why do some line segments extend over a hundred points or more, while some are very short? There's nothing strange about this. Whether something is a line segment depends on the shape that develops — if every low point is higher than the previous high point, then even if this situation extends infinitely, it's still just one line segment. This has nothing to do with amplitude.
Also, two consecutive adjacent line segments can't be in the same direction — both upward or both downward cannot constitute two adjacent line segments. Moreover, since line segments must at minimum present up-down-up or down-up-down, line segments can't possibly be a flat horizontal line. From this you also know why a stock hitting a no-movement limit-up day after day, no matter how long it continues, is still below the line segment level — it's at the minimum level.
Below, let me first display the three charts. The three are continuous, as can be understood from the markings above. Because there are too many candlesticks, they can't fit on one chart, otherwise it would be impossible to see clearly.
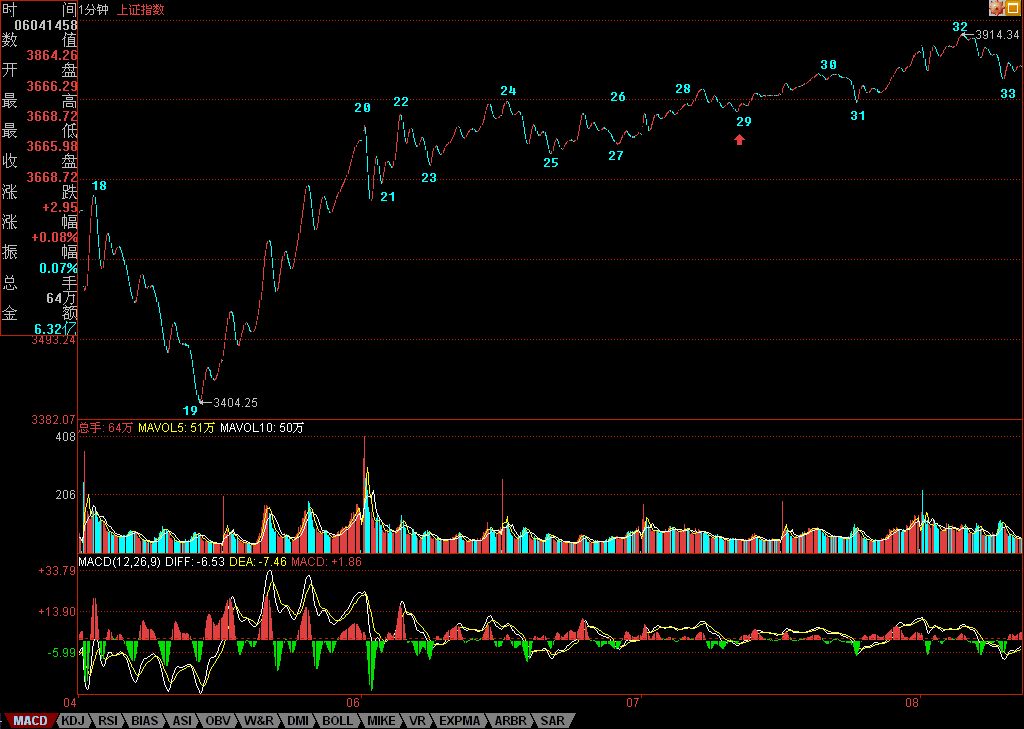
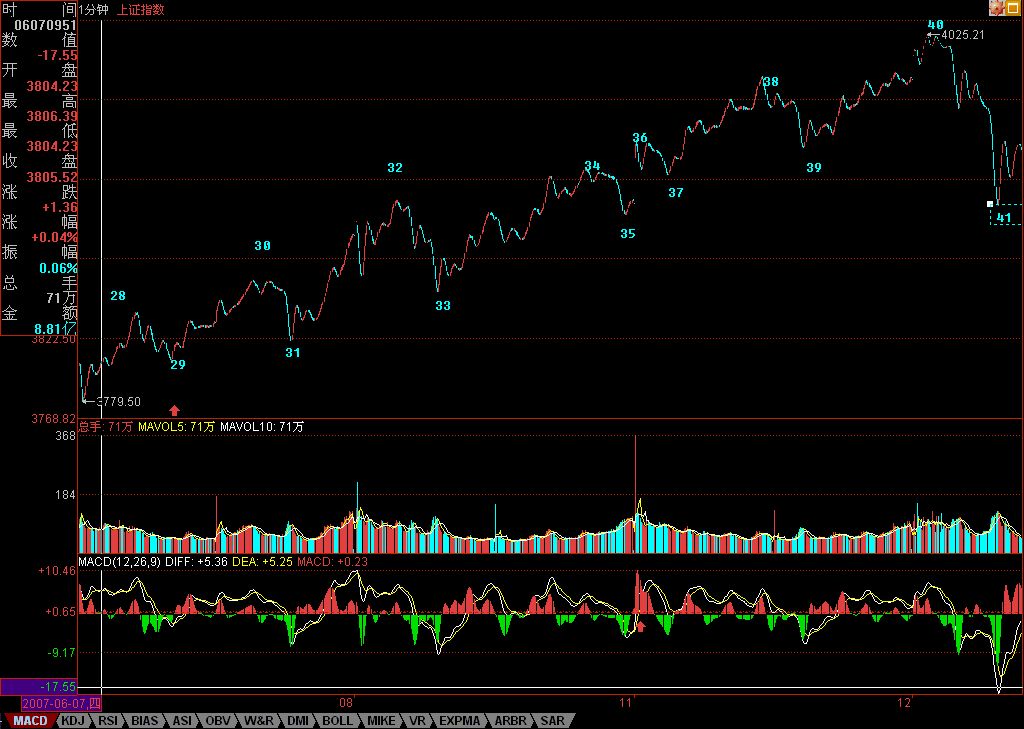
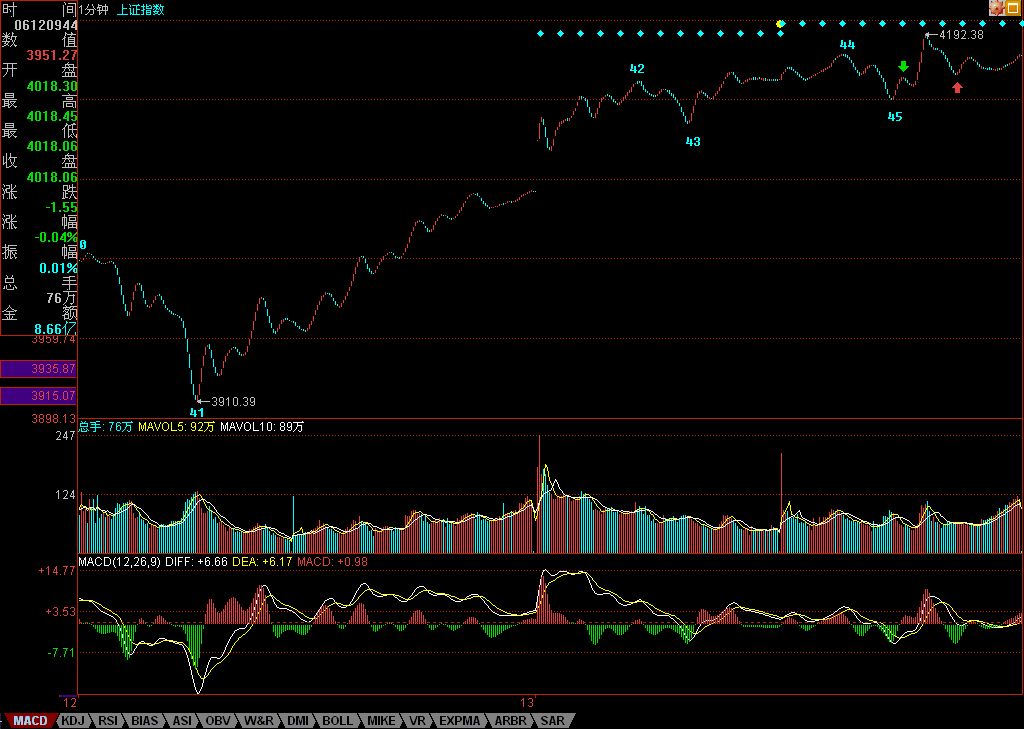
In Chart 1, the 1-minute hub formed by 20-23 produces extension, and 29 is the third-type buy point of this hub. In Chart 2, 33 is the third-type buy point of the 28-31 1-minute hub, and 37 is the third-type buy point of the 32-35 1-minute hub. In Chart 3, since the red arrow point is higher than the green arrow point, it cannot be confirmed that the line segment is complete — subsequent movement must be watched. From this you can understand how to grasp the end of a line segment: generally speaking, the ending of a line segment is the same as the ending of a larger-level movement segment. In trends, divergence is used for confirmation; in other situations, consolidation divergence is used. If a sudden event occurs, then the second-type buy/sell point is used — the principle is the same, just the levels involved are particularly small. For Chart 3, the subsequent movement relates to the 1-minute hub of 42-45 — it's simply hub oscillation until a third-type buy or sell point appears.
Note that in the previous lesson's 7-8-9, since 8's low point of 3994.57 and 7's last high point of 3994.21 are extremely close — if precision is only to the ones digit, the two are completely identical — so in such cases they can be considered overlapping, thus divisible into three line segments. Of course, if precision is required to two decimal places, then 7-8-9 could actually be considered a single line segment. Generally speaking, when the two are this close, and since 8 also shows clear down-up-down movement, it's better to treat them as three line segments. However, how you view it depends on the precision you predetermined — the key is to apply it consistently. Regardless of which precision you use, there's no substantive impact.
Someone might ask again: why is it always the 1-minute chart? Actually, which chart you look at doesn't matter. Starting from the 1-minute chart merely means the analysis foundation has a precision premise based on the 1-minute chart. Under this premise, you naturally examine the 1-minute chart, and this doesn't affect analysis of larger levels. For example, segments 1-19 constitute a 5-minute trend type, and this movement ultimately doesn't form two 5-minute hubs, so it can only be considered a consolidation. And from 19 to 45, since 41 is lower than 32, this movement has at least one 5-minute hub, but this new 5-minute trend type hasn't ultimately been completed.
For this incomplete 5-minute trend type of 19-45, detailed study can be conducted. Since 29 is lower than 24, segments 22-31 also constitute a 5-minute hub, and this hub corresponds to another decomposition. But regardless of the decomposition, the conclusion that 19-45 is at least an incomplete 5-minute trend type doesn't change. Of course, under this decomposition, 41 is the third-type buy point of the 22-31 five-minute hub. Therefore, if the rally starting from 41 ultimately forms a 5-minute hub that doesn't overlap with the 22-31 five-minute hub, then the trend type starting from 19 would be a 5-minute uptrend.
From the above analysis, there's a clear conclusion for short-term movement: as long as the oscillation around the 42-45 1-minute hub doesn't produce a third-type sell point, or even if it does, the subsequent expansion doesn't touch the oscillation range of the 22-31 five-minute hub — then the market's oscillation is strong, and even if a 30-minute or higher-level hub ultimately forms, it would develop at minimum around the 42-45 1-minute hub. Otherwise, the market would use the 22-31 five-minute hub's oscillation range as a base to expand into a 30-minute level hub, and the corresponding movement would be relatively weak. As for specific operations, you can use hub oscillation methods, choosing the appropriate hub level based on your operational level.
Appendix:
Today's movement is nothing to talk about — yesterday already described it very clearly. Technical, psychological, and policy pressures all need to be digested through oscillation here. Since the gap wasn't fully closed today, that position remains key for the short term. Of course, the 42-45 1-minute hub mentioned above has already extended to 9 segments, becoming a 5-minute hub. The specific analysis going forward was already written in the article above, so no need to repeat. Shenzhen is being drawn to the 13700 point level — short-term, whether it can hold above that line has enormous guiding influence on the market's direction.
Note that in hub oscillation, the safe approach is to sell first and buy later, establishing a rhythm. This is actually quite simple: when chips accumulated from low levels and you detect that the one-sided movement has ended and a larger-level oscillation has begun — the signal being the appearance of top divergence or consolidation divergence — you should reduce positions. Then wait for the oscillation to come down, buy back when bottom divergence or consolidation divergence appears, and this is how the price differential is created and costs are reduced. If you buy first and sell later, the only possibility is that during the one-sided move you held a light position, so you had cash without selling stocks — which in itself is a manifestation of already being off-rhythm.
Of course, all of this requires practice to become proficient. And you must note: once the oscillation's strength exceeds the previous level and may form a third-type sell point, you must stop buying back. Wait for the buy point that appears from the decline triggered by the third-type sell point before entering. Many people often make mistakes here because they mentally assume a possible decline range, feeling certain it won't drop much — this is a major flaw. You must develop the habit of operating purely based on charts.
As always: whether it's policy, psychology, news, or anything else — all are component forces of the market, and the movement is the result of the combined forces. This is the crux of the matter.
Sorry, can't answer everyone's questions today. This afternoon there's one group, tonight two groups that all need some socializing. This ID must go make up for lost time. Signing off first, see you tomorrow morning.
Replies
缠中说禅 2007/6/14 15:33:09
Today's movement is nothing to talk about — yesterday already described it very clearly. Technical, psychological, and policy pressures all need to be digested through oscillation here. Since the gap wasn't fully closed today, that position remains key for the short term. Of course, the 42-45 1-minute hub mentioned above has already extended to 9 segments, becoming a 5-minute hub. The specific analysis going forward was already written in the article above, so no need to repeat. Shenzhen is being drawn to the 13700 point level — short-term, whether it can hold above that line has enormous guiding influence on the market's direction.
Note that in hub oscillation, the safe approach is to sell first and buy later, establishing a rhythm. This is actually quite simple: when chips accumulated from low levels and you detect that the one-sided movement has ended and a larger-level oscillation has begun — the signal being the appearance of top divergence or consolidation divergence — you should reduce positions. Then wait for the oscillation to come down, buy back when bottom divergence or consolidation divergence appears, and this is how the price differential is created and costs are reduced. If you buy first and sell later, the only possibility is that during the one-sided move you held a light position, so you had cash without selling stocks — which in itself is a manifestation of already being off-rhythm.
Of course, all of this requires practice to become proficient. And you must note: once the oscillation's strength exceeds the previous level and may form a third-type sell point, you must stop buying back. Wait for the buy point that appears from the decline triggered by the third-type sell point before entering. Many people often make mistakes here because they mentally assume a possible decline range, feeling certain it won't drop much — this is a major flaw. You must develop the habit of operating purely based on charts.
As always: whether it's policy, psychology, news, or anything else — all are component forces of the market, and the movement is the result of the combined forces. This is the crux of the matter.
Sorry, can't answer everyone's questions today. This afternoon there's one group, tonight two groups that all need some socializing. This ID must go make up for lost time. Signing off first, see you tomorrow morning.
缠中说禅 2007/6/14 8:26:42
Today's market commentary will be appended to this post after 3:30 PM. Signing off first, goodbye.