Teaching You to Trade Stocks 69: Monthly Line Segment Division and Shanghai Market Major Trend Analysis & Forecast
2007/8/9 23:03:22
Fractals, strokes, and line segments can be identified on 1-minute charts, and the principle is exactly the same on monthly charts. But using monthly charts for identification is like using an extremely low-precision microscope—you can only see a rough picture. However, this rough picture is the most substantive one, representing the big direction.
Below is the monthly chart of the Shanghai Index. Green arrows point to top fractals, and red arrows point to bottom fractals. Those marked with "X" indicate that the fractal doesn't meet the specifications required for strokes. Here, there are only two criteria: first, there isn't at least one candlestick between the top and bottom; second, it doesn't satisfy the requirement that a top must be followed by a bottom, or a bottom must be followed by a top.
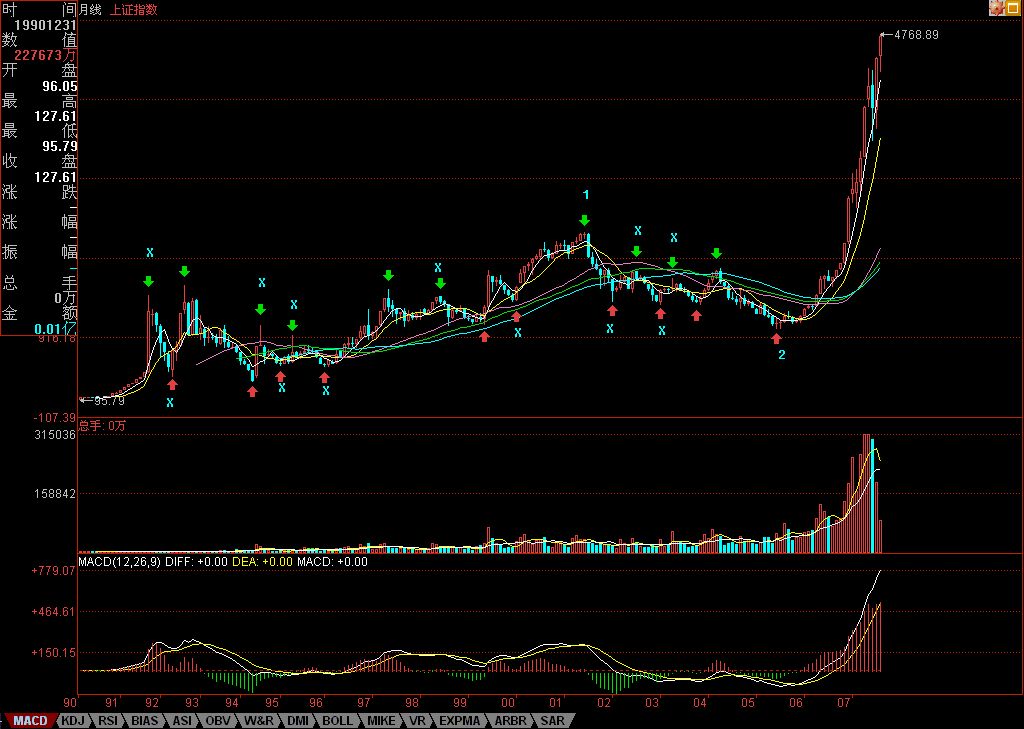
For example, between the first red arrow and the second green arrow, obviously no stroke can be formed. That is to say, between these two, only one can be taken: if we take the first red arrow, then the second green arrow is not a fractal within a stroke, and the second red arrow is obviously a bottom fractal, thus forming two consecutive bottom fractal classifications. Obviously, in this case, the first one doesn't count, which contradicts taking the first red arrow's corresponding bottom fractal. Therefore, here, we can only take the second green arrow. At this point, the top fractal corresponding to the first green arrow naturally doesn't count as a top within a stroke.
For the remaining fractals, those marked with "X" can all be analyzed according to the above two principles.
Someone might ask: how is the determination of these fractals completed in the present moment? It must be completed in the present moment. For example, when the trend reaches the first red arrow, obviously the first green arrow's top fractal can temporarily be considered a confirmed top fractal. But when the second green arrow emerges, this becomes subject to modification.
Someone might wonder: can fractals be modified at any time? The answer is no. Once the pattern is complete, modification is impossible. The fact that a fractal can be modified proves the pattern isn't complete. For example, after the second red arrow's fractal appears, the selection among the first three fractals becomes unique. This modifiability of fractals is actually an extremely advantageous property for judging trends. For example, after the second green arrow emerges, the incomplete nature of the pattern is 100% certain. But all patterns must eventually complete—trends must be perfect. How can perfection be achieved? Within the theoretical framework, there are only very few possibilities, and these possibilities become the key conditions for comprehensive judgment. Then, based on the incomplete nature of patterns across various levels, the boundary conditions of trends can be made extremely clear and narrow, which is extremely advantageous for actual operations. Note that this has nothing to do with probability—it is a 100% pure theoretical guarantee, ultimately based on the trend-must-be-perfect principle that this ID has repeatedly emphasized from the very beginning of the theory.
In fact, the key to this ID's theory is not hubs or trend types, but that trends must be perfect—this is the core of this ID's theory. But to truly understand this key point, you can't grasp it just by looking at the literal meaning.
Obviously, on the monthly chart, segments 1 and 2 have already been formed. Among them, based on the analogous divergence within the strokes of line segments, the end of segment 1's top and segment 2's bottom are both extremely easy to determine. The historical major tops and bottoms of the Shanghai Index, according to this line segment division, are not some difficult secret. So, for the still-ongoing segment 3, what can be determined with 100% certainty?
First, obviously, for this segment to qualify as a segment, it needs at least three strokes, and currently not even one stroke has been completed. Therefore, the magnitude of this bull run should be self-evident. That is to say, even after this stroke is completed, after one stroke of correction, there should be at least one more upward stroke.
Second, the range from 2245 to 998 points constitutes an analogous hub of the line segment. That is to say, as long as the corrective stroke doesn't fall below 2245 points, it will constitute an analogous third-type buy point of the line segment, which also supports that at least one more stroke must unfold.
Third, the completion of a stroke must form a top fractal. And how would a monthly top fractal be formed? What does this imply? I'll leave this as homework for you all to think about, and then derive the corresponding operational strategy for this conclusion. Through this, you can personally experience and understand the power of theory-guided operations.
Finally, let me pose another thought question: why did this ID go all-out with the "Man Jiang Hong" campaign in July, but from August onward just sat back and enjoyed the ride? Please use the principles of fractals to give a technical explanation for this ID's behavior.
缠中说禅 2007/8/9 23:06:48
Sorry, the friends list was full long ago, and Sina won't increase the quota, so please don't apply to be friends for now. If you have questions, you can post them in the comments. If this ID sees them, I'll try to arrange answers in the articles, preferably those with broad relevance.
Signing off now, goodbye.