A Live Textbook Demonstration of This ID's Theory
2007/9/12 15:42:13
Today's movement was extremely technical. In short, as mentioned yesterday, after breaking below the 5-week moving average there must be a rebound—the key question is how far this rebound can extend. If it can't pull back above 5265 points, then the subsequent path remains fraught with danger.
But if you understand some of the simplest conclusions from this ID's theory, today's movement was practically a live textbook demonstration. You can clearly see how the movement expanded from a line segment into a 1-minute hub, and how through divergence relationships and other tools, one can roam freely through seas of fire and mountains of blades.
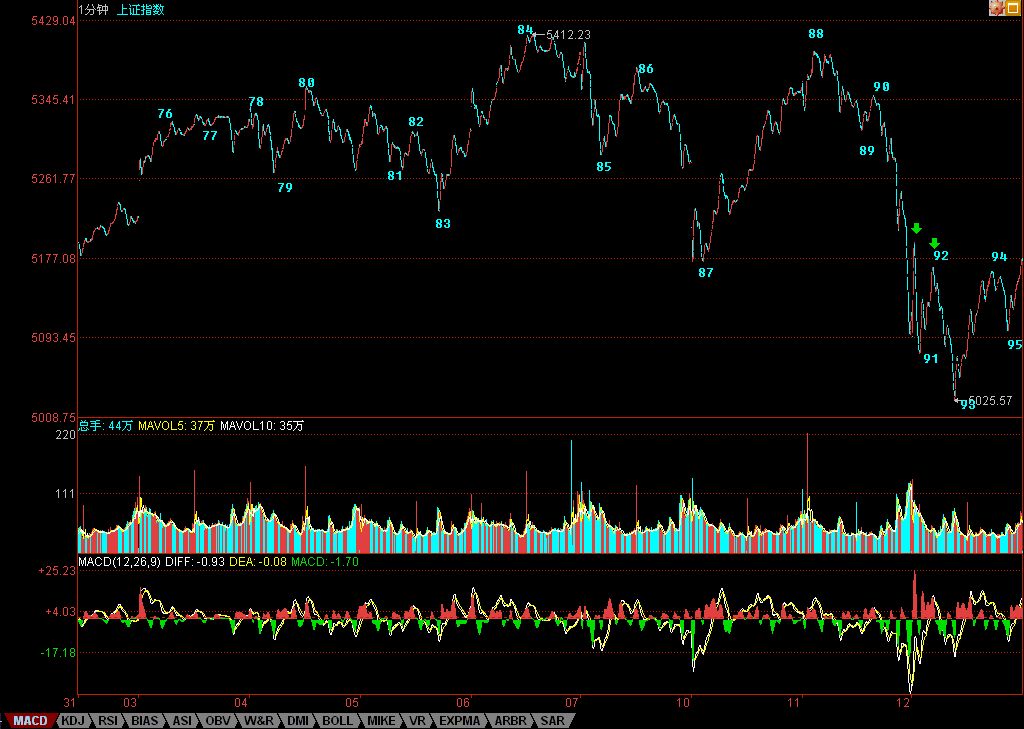
Clearly, the stroke at the first green arrow did not produce a stroke violation, which meant it necessarily had to fall back to complete the line segment's movement—this is 100% guaranteed by the theory.
At position 92, a line segment violation occurred, but this line segment couldn't pull back to position 85, which therefore constituted the third-type sell point of the 85–88 1-minute hub. The continued decline afterward is also 100% guaranteed by the theory.
At position 93, there was a textbook line segment-type divergence, which meant that from the 92 1-minute third-type sell point, a hub extension would occur, forming at least one 1-minute hub—also 100% guaranteed by the theory.
That is to say, the decline from 88 to 93 was complete, and there must necessarily be a rebound against this decline. The subsequent evolution played out textbook-perfect—anyone who has studied this ID's theory knows that all of this can be judged in real time, without needing after-the-fact analysis.
So what comes next? Simple: after the 84–93 1-minute trend type left the 76–85 5-minute hub, we need to watch whether a 1-minute trend type pullback can reach back above point 79, i.e., above 5265 points. If not, that constitutes the third-type sell point of this 5-minute hub, and subsequently it must at minimum expand into a 30-minute hub—worst case, a 5-minute level decline.
Those who entered at position 93 as the theory required, and those who didn't exit yesterday as the theory required, should watch closely whether this third-type buy/sell point materializes. If it doesn't, then the market continues its hub oscillation—which is practically paradise for this ID's theory.
On individual stocks, their rhythms don't necessarily match the market's. Using this ID's stocks as examples—600578, 000099, 000999—yesterday there wasn't any sign of forming a daily top fractal, and today the possibility of forming a daily top fractal was quickly destroyed. These are short-term strong stocks, so you must patiently wait for the daily top fractal to appear.
And for stocks like 000938—if you use this ID's theory to operate, the short-term trading opportunities within are simply a blast for retail investors. Please study 000938's chart carefully—see how textbook-perfect yesterday's top fractal was, and how classic today's bottom divergence at 17.59 was (for force comparison, check the 5-minute chart). How much is the spread between these two?
Don't look down on short-term trading. Those who do so only because they lack the skill. Of course, if you lack the skill, then don't trade too short-term—short-term trading requires a soldier of steel.
This ID's theory isn't just for short-term trading—it works at all levels. The key is whether you can truly master it.
Signing off. Goodbye.