Teaching You to Trade Stocks 16: An Efficient Buy/Sell Method for Small and Medium Capital.
2006/12/14 12:06:47
The previous chapter stated that the movement chart of any market instrument at any timeframe can be decomposed into combinations of three basic situations: uptrend, downtrend, and consolidation. Uptrend and downtrend constitute trends. How to distinguish between trends and consolidation is the core issue of analyzing movements. A most fundamental problem is that movements are level-dependent: what appears as an uptrend on the 30-minute chart may be just a segment of consolidation or even a rebound within a downtrend on the daily chart. Therefore, discussing trends and consolidation without specifying the level is utterly meaningless—this must be firmly grasped. Note: the discussion below and prior, unless otherwise stated, is all conducted at the same level. Only after understanding things at the same level can different levels of movements be combined for study—that comes later.
The three basic movements—uptrend, downtrend, and consolidation—have six possible combinations representing three categories of different movements:
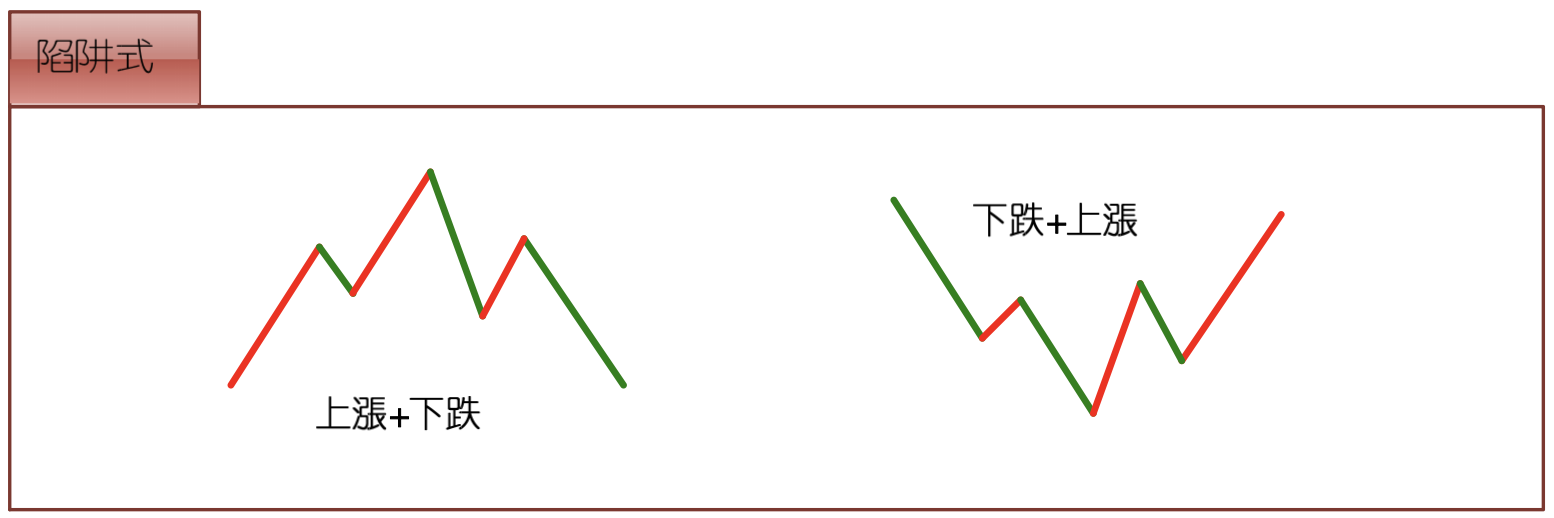
Trap type: uptrend + downtrend; downtrend + uptrend.
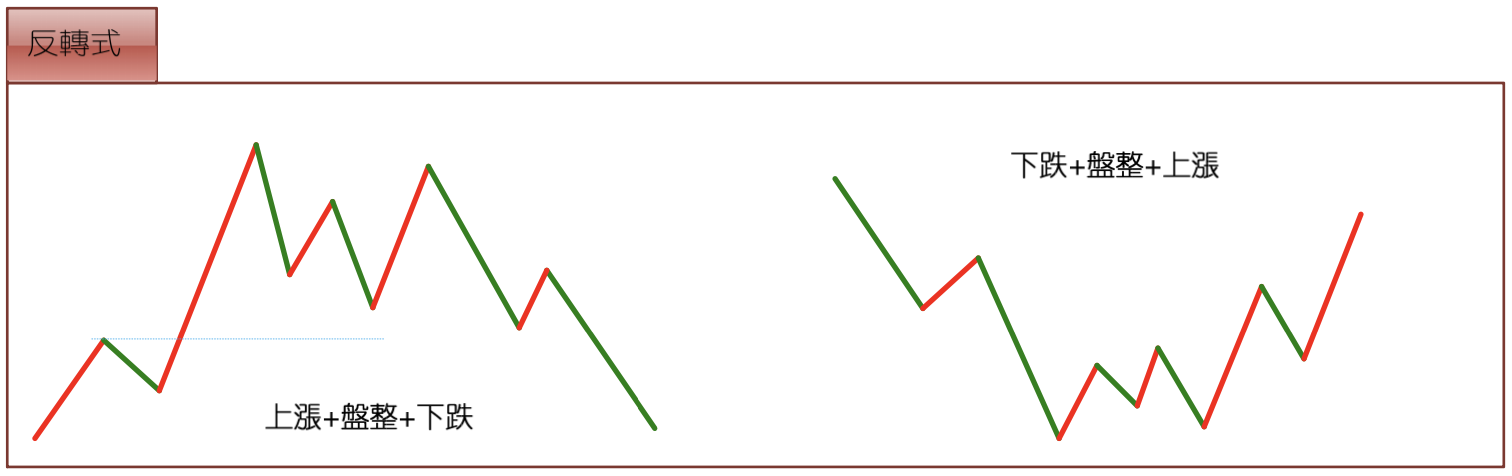
Reversal type: uptrend + consolidation + downtrend; downtrend + consolidation + uptrend.
Continuation type: uptrend + consolidation + uptrend; downtrend + consolidation + downtrend.
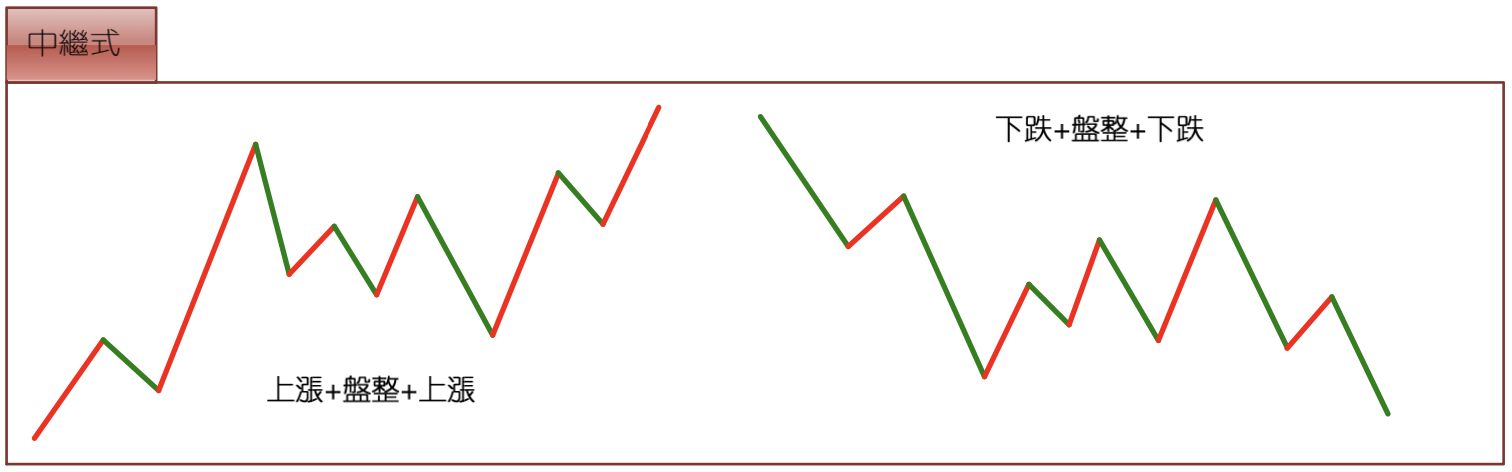
All market movements can be decomposed and studied through these three types. Standing from the bull's perspective, the first consideration is buying. Therefore, among the six most basic movements above, those with buy value are: downtrend + uptrend, downtrend + consolidation + uptrend, and uptrend + consolidation + uptrend. Those without buy value are: uptrend + downtrend, uptrend + consolidation + downtrend, and downtrend + consolidation + downtrend. From this, it's not hard to discover that if you buy during a downtrend, you'll subsequently encounter only one type of movement without buy value—downtrend + consolidation + downtrend—which is one fewer scenario than buying during an uptrend. When buying during a downtrend, the only risks to avoid are: 1. The current downward leg hasn't ended yet; 2. The current downward leg has ended, but consolidation is followed by another downward leg.
In the previous chapter "No Trend, No Divergence," using divergence to find the first-type buy point in a downtrend is precisely to avoid the first risk above. After buying, you'll face the second risk—how to avoid it? Once a consolidation pattern appears afterwards, you must reduce your position and exit first. Why not exit entirely? Because consolidation can lead to two outcomes: uptrend or downtrend. If a downtrend follows, it means a loss, and consolidation also wastes time—for small and medium capital, there's absolutely no need to participate. There's a very important question here to be analyzed later: how to judge whether consolidation will be followed by an uptrend or downtrend. If you master this technique, you can decide whether to reduce positions and exit or dynamically build positions during consolidation. This is a major issue—especially for large capital that doesn't want to be a market maker. Safe position building for such capital, among the six movement types, is only possible in one: downtrend + consolidation + uptrend. The others are all unsuitable. As for market-making position building methods, those are entirely different—if there's interest, this ID can discuss them later.
Based on the analysis above, an effective buy/sell method can be immediately designed: after buying at the first-type buy point, once consolidation appears, regardless of what follows, exit immediately. The essence of this buy/sell method is that among the six most basic movements, you participate in only one: downtrend + uptrend. For smaller capital, this is the most effective buy/sell method. Let's analyze in detail:
For downtrend + uptrend, the movement preceding the downtrend can only be one of two things: uptrend or consolidation. If it's uptrend + downtrend + uptrend, then this movement constitutes consolidation at the next higher level, so this can be categorized under consolidation operations—to be studied in the dedicated analysis of consolidation later. In other words, for those operating the "downtrend + uptrend" method, the "uptrend + downtrend + uptrend" movement is not considered. This means when you want to use the "downtrend + uptrend" method to enter a stock showing a first-type buy point, if the preceding movement is "uptrend + downtrend," don't consider it. Note: "don't consider" doesn't mean there's no profit potential—it just means this situation can be categorized under consolidation-type operations. The "downtrend + uptrend" method refuses to participate in consolidation. Thus, under this method, the eligible stocks are further reduced, leaving only this one situation: "consolidation + downtrend + uptrend."
From the analysis above, it's very clear that for the "downtrend + uptrend" method, the situation must be: a first-type buy point appearing after a "consolidation + downtrend" type movement. Obviously, this downtrend breaks below the preceding consolidation—otherwise it wouldn't constitute "consolidation + downtrend" and would still be consolidation. The movement before this consolidation also has only two possibilities: uptrend or downtrend. For "uptrend + consolidation + downtrend," this essentially constitutes consolidation at the next higher level, so the "downtrend + uptrend" method also cannot participate in this situation. Therefore, only one situation remains: "downtrend + consolidation + downtrend."
In summary, for the "downtrend + uptrend" method, stock selection narrows down to only one situation: a first-type buy point appears AND the preceding movement is "downtrend + consolidation + downtrend" type. Therefore, here we obtain the standard procedure for selecting buy candidates using the "downtrend + uptrend" method: 1. First, select only those showing a "downtrend + consolidation + downtrend" movement. 2. Enter when the first-type buy point appears during the second downward leg of this movement. 3. After entry, once consolidation appears, exit decisively. Note: this exit will definitely not lose money, because you can use the first-type sell point at a lower level to exit, which guarantees a profit. But why exit? Because it doesn't meet the "downtrend + uptrend" standard of not participating in consolidation. The downside of consolidation is wasting time, and there's a 50% chance consolidation leads to another downtrend—for small and medium capital, there's simply no need to participate. Always remember: operations must follow standards—that's the most efficient way. If no consolidation appears after buying, then truly congratulations, because the stock will at least recover to the consolidation zone of the "downtrend + consolidation + downtrend" pattern. If this pattern appears on daily or weekly charts, the chances of it developing into a major dark horse are quite significant.
Here's an example:
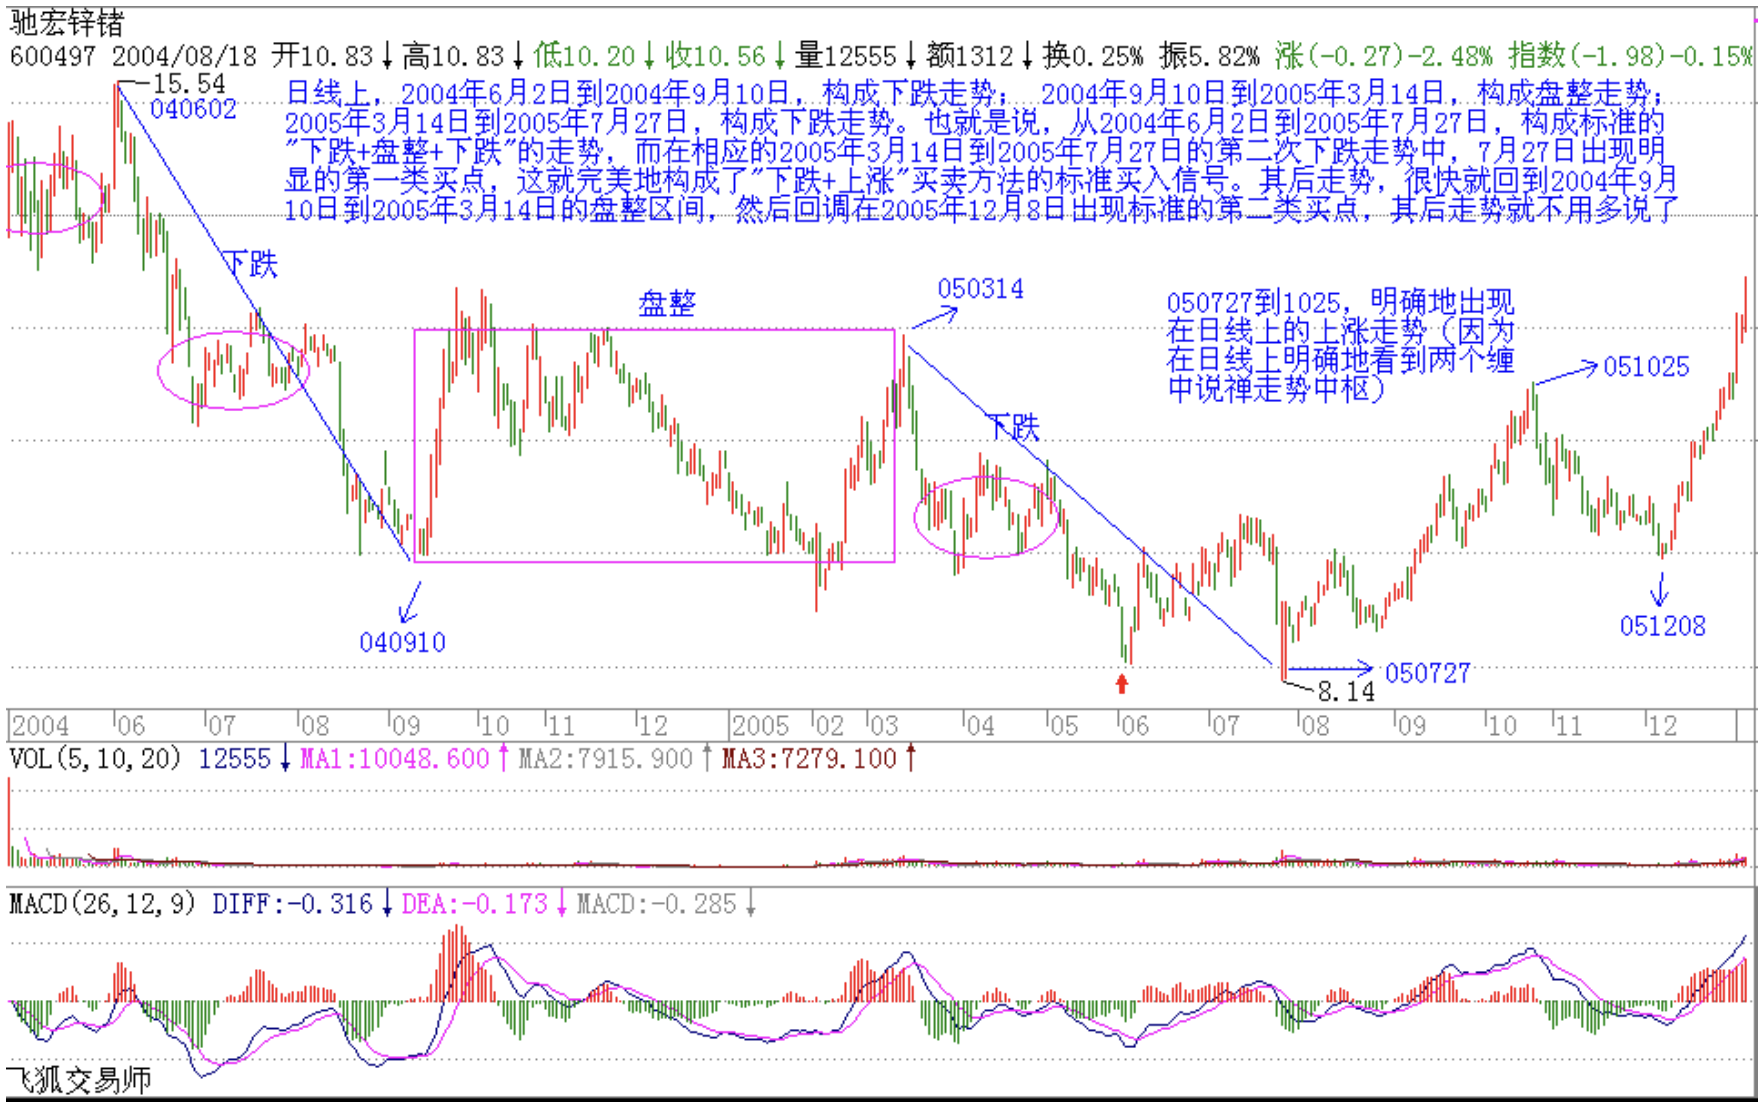
Chiho-Tiande (驰宏锌锗): On the daily chart, June 2, 2004 to September 10, 2004 constituted a downtrend; September 10, 2004 to March 14, 2005 constituted consolidation; March 14, 2005 to July 27, 2005 constituted a downtrend. That is, from June 2, 2004 to July 27, 2005, a standard "downtrend + consolidation + downtrend" pattern formed. In the second downward leg from March 14, 2005 to July 27, 2005, an obvious first-type buy point appeared on July 27—this perfectly constituted a standard buy signal for the "downtrend + uptrend" method. The subsequent movement quickly returned to the consolidation range of September 10, 2004 to March 14, 2005, then the pullback produced a standard second-type buy point on December 8, 2005. The subsequent movement goes without saying.
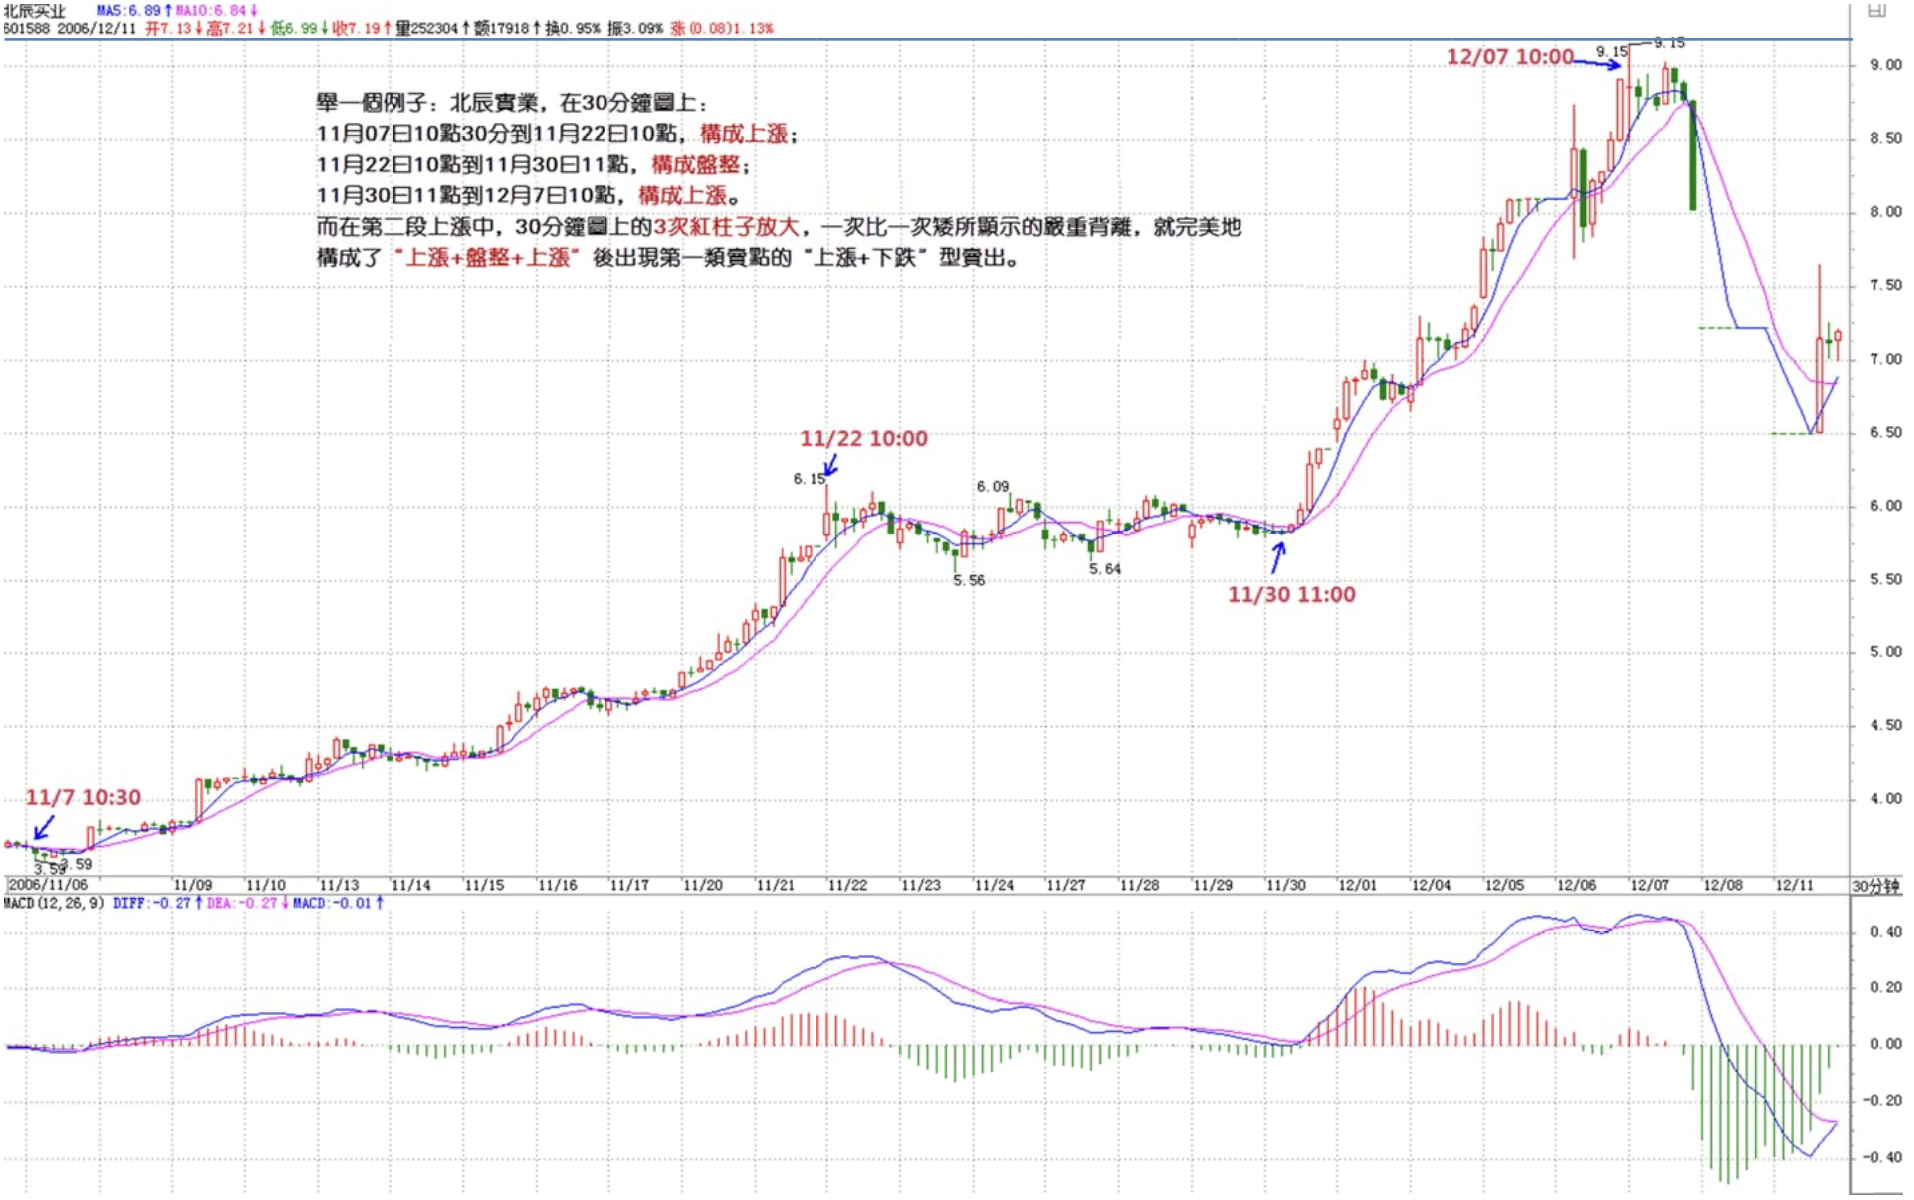
This method, reversed, also works well for selecting sell points. That is, when an "uptrend + consolidation + uptrend" pattern has preceded, once a first-type sell point appears in the second upward leg, you must exit, because what follows is very likely the classic "uptrend + downtrend" pattern. Here's another example: Beichen Real Estate—on the 30-minute chart, 10:30 AM November 7 to 10:00 AM November 22 constituted an uptrend; 10:00 AM November 22 to 11:00 AM November 30 constituted consolidation; 11:00 AM November 30 to 10:00 AM December 7 constituted an uptrend. In the second upward leg, the three red bar expansions on the 30-minute MACD chart, each getting shorter than the last—showing severe divergence—perfectly constituted a first-type sell point after "uptrend + consolidation + uptrend," triggering an "uptrend + downtrend" sell. If you later learn the concept of time windows, you'll have an even better grasp of this stock's sell point. Did you notice the relationship between 10:30 AM November 7 and 10:00 AM December 7?
This method, whether for buying or selling, is extremely suitable for small and medium capital. If mastered well, it's highly efficient. But you must look at many charts, reflect seriously, and make it second nature. Also, please read more of the follow-up comments to the articles—this ID's replies address detailed points not covered in the main posts and are tailored to various questions posed by everyone. Also review previous chapters and make sure all questions are resolved. Participating in the market requires absolute clarity—you can't afford even the slightest confusion.
Replies
缠中说禅 2006/12/14 12:28:10
[Anonymous] 快
2006-12-14 12:24:34
Blogger, at the current point level, is it better to hold diversified or concentrated positions? Capital around 500,000.
===========
Hold no more than 3 stocks. With your capital, if you master this method well, using 30-minute or daily charts, and don't achieve 300% returns in a year, that'd be quite poor.
缠中说禅 2006/12/14 12:34:06
Yesterday's assignment was mainly for everyone to figure out how to properly use MACD to identify divergence. It's not about comparing bar lengths every time you see bars—it must be done in conjunction with the trend. Remember: no trend, no divergence. Understand this sentence well. Divergence is only meaningful when comparing between two trends—comparing within consolidation is useless.
Nobody got the correct answer yesterday. After reading today's article, please continue analyzing 580991 using today's method. Here's a hint: on its daily chart, there is only one divergence point, meaning only one first-type buy point. It would be easy for this ID to just give the answer, but it's more effective for everyone to discover it through your own research—that's how you truly understand.
The final answer will be revealed tomorrow.
Pay attention to this point:
Divergence is only meaningful when comparing between two trends—comparing within consolidation is useless.
缠中说禅 2006/12/14 12:38:11
[Anonymous] ataoo0
2006-12-14 12:31:06
Chán Zhōng Shuō Chán
2006-11-29 15:14:38
From the perspective of a healthy market, this ID's recommendation for the broader market is: first let the Shenzhen Component Index break through its historical high of 6103 points, then Shanghai follows, and after the breakthrough, then correct—this would be healthier. I wonder if the market is interested in listening to this ID's opinion.
Blogger, do you think the market listened to your advice?
============
Actually, it doesn't matter whether Shanghai or Shenzhen breaks through first. The market is only in the first phase of a bull market—the key is to have the right mindset. Don't get scared just because the market shakes a bit.
Let this ID repeat something said before: in a bull market, a dip is your daddy.
And I must seriously, repeatedly, again emphasize: the main force in the first phase is component stocks. Look at the rise from 1000 points—isn't that exactly what happened?
缠中说禅 2006/12/14 12:39:41
[Anonymous] 阿Q
2006-12-14 12:35:12
Chan sister, could you please talk about rational capital allocation? For example, how much to use when building a position, how much to sell at the first sell point, how much to add when adding to positions, and when finally selling, does it have to be all at once? This aspect is quite hard for me to grasp. Thanks!
==========
These topics will all naturally be addressed. The key is to first master the basic methods. Looking at things now, most people haven't even figured out divergence yet.
No trend, no divergence. Divergence is only meaningful when comparing between two trends—comparing within consolidation is useless.
Understand it well.
缠中说禅 2006/12/14 12:45:06
[Anonymous] nn
2006-12-14 12:36:19
Thank you, blogger. You've worked hard. I have a question: should small-medium and large capital be differentiated in terms of position splitting (or allocation)? That is, the position management issue. Also, can someone with a day job utilize capital as efficiently as you describe? Compared to your method, mine is just waiting for a rabbit by the stump—completely inefficient. Thanks for any guidance!
==========
If you have a day job, just look at daily charts.
缠中说禅 2006/12/14 12:46:38
[Anonymous] 缠绵不觉
2006-12-14 12:44:49
Teaching someone to fish—truly virtuous.
How do you identify trends? By K-lines?
=========
You need to thoroughly research the previous material. This question was already explained very clearly in lesson 15. You can't have fallen so far behind on earlier lessons and expect to keep up now.
缠中说禅 2006/12/14 12:55:55
[Anonymous] 无言
2006-12-14 12:54:08
Chan sister, when a first-type buy point appears on the daily chart, the K-line combination always looks awful. How can you judge the strength of the stock's medium-term move? By looking at the positions of various moving averages on the weekly chart? Could you explain in detail? Thanks.
=============
This topic will be addressed later. First master this method thoroughly. Whoever masters this method will be better than 95% of people.
缠中说禅 2006/12/14 13:00:04
[Anonymous] 心易
2006-12-14 12:55:56
Assignment for 580991: On the daily chart, the first-type buy point is around October 23 at the 0.50 level. Is this correct? Please evaluate.
=================
Now tell me: how did you identify the divergence? That's the key. You need divergence to have a first-type buy point—get the logical chain clear.
Market opening, signing off for now. See you later.
缠中说禅 2006/12/14 13:01:27
[Anonymous] 朗月无花
2006-12-14 12:56:07
The blogger has recently become all about stocks. Even the Analects replies are about stocks. For us illiterates in stocks, it's really frustrating. Can you also cater to us a bit?
===========
The thing is, you don't raise questions about the Analects or other topics. Look at previous posts—when someone asked about the RMB, this ID also answered. You can ask about other topics here too.
Signing off now. See you later.
缠中说禅 2006/12/14 15:10:16
Worrying about creating historical highs—don't overthink such trivial things. As the rally unfolds, prices keep going up and naturally keep breaking historical highs. Stay calm. If you can't handle the first round of a bull market, then in the third round when junk stocks are flying everywhere, you won't even know where to stand.
缠中说禅 2006/12/14 15:18:14
[Anonymous] Leisurely
2006-12-14 15:14:57
Big sister, I have a question: how long does something need to consolidate before it counts as consolidation?
============
This proves you fundamentally haven't understood what consolidation is. As soon as a consolidation pattern is formed, it's consolidation—it has absolutely nothing to do with time. There are stocks abroad that consolidate for 8 or 10 years, and that's not unusual at all. The key is the pattern.
缠中说禅 2006/12/14 15:25:45
[Anonymous] 想飞
2006-12-14 14:51:21
Blogger, for Chiho-Tiande's daily chart from 2004/6/2 to 2004/9/10, without the subsequent movement, couldn't it also be seen as a "downtrend + consolidation + downtrend" pattern, with the first buy point appearing on 2004/8/23?
=============
Both right and wrong. What's wrong is that on the daily chart, it's NOT a "downtrend + consolidation + downtrend." But on the 30-minute chart, it is. So it's both right and wrong. That segment on the daily chart only constitutes a single downtrend. Please carefully appreciate the subtlety here.
缠中说禅 2006/12/14 15:31:32
[Anonymous] 想飞
2006-12-14 14:43:48
"Consolidation: the most recent high is higher than the previous high, AND the most recent low is lower than the previous low; OR the most recent high is lower than the previous high, AND the most recent low is higher than the previous low."
Blogger, this seems simple but it's still tricky to apply in practice. Could you use Chiho-Tiande as an example and point out two points to illustrate? That would be more intuitive and easier to understand.
Please don't find this bothersome. Without understanding this, I won't be able to submit my assignment again.
=============
You can visually identify downtrends, consolidation, etc.—unless you can't even tell highs from lows. Note: this doesn't require prediction—just look at the movement already drawn on the chart.
Study these two passages by this ID carefully:
Chiho-Tiande: On the daily chart, June 2, 2004 to September 10, 2004 constituted a downtrend; September 10, 2004 to March 14, 2005 constituted consolidation; March 14, 2005 to July 27, 2005 constituted a downtrend. That is, from June 2, 2004 to July 27, 2005, a standard "downtrend + consolidation + downtrend" pattern formed...
Chán Zhōng Shuō Chán
2006-12-14 15:25:45
[Anonymous] 想飞
2006-12-14 14:51:21
Blogger, for Chiho-Tiande's daily chart from 2004/6/2 to 2004/9/10, without the subsequent movement, couldn't it also be seen as a "downtrend + consolidation + downtrend" pattern?
=============
Both right and wrong. What's wrong is that on the daily chart, it's NOT a "downtrend + consolidation + downtrend." But on the 30-minute chart, it is... That segment on the daily chart only constitutes a single downtrend. Please carefully appreciate the subtlety here.
缠中说禅 2006/12/14 15:40:47
Leisurely
2006-12-14 15:27:37
For example, when a range breaks—especially during the market maker era—they usually come back to confirm. If it's a slow market maker, they consolidate again. If I chase, I get trapped. If I see consolidation and leave, it runs up. Isn't that getting played to death? You also have to consider whether it's a real breakout or a bull trap...
Leisurely
2006-12-14 15:29:51
Also, you can't tell the real intention until closing. A single washout move can break all indicators. Then by closing or the next day or two, they pull it back. What then? Isn't that getting played to death too?
============
The fact that you're still asking these questions shows you fundamentally haven't understood the concept of levels. If you're operating on the daily chart, why are you worried about the closing price? If you're operating on the 30-minute chart, just look at the 30-minute chart—what does the closing price matter? Sort this out first, otherwise your thinking will never straighten out.
缠中说禅 2006/12/14 15:43:19
[Anonymous] ruifeng0021
2006-12-14 15:35:35
580991 assignment:
On the daily chart, from 9.22 a downtrend starts. The 5-day and 10-day moving averages show male-on-top entanglement. Taking 10.17 as the dividing point, the area after is noticeably smaller than before, which can be judged as divergence. On MACD, the green bars shorten, and the yellow/white lines are below zero—all supporting the divergence judgment. The best buy point is the low during the decline on 10.23, a first-type buy point in Chan Theory.
On the 30-minute chart, it's even clearer. From 9.22 at 11:00 to 10.23 at 11:00, it's an obvious "downtrend + consolidation + downtrend" pattern. 10.23 at 11:00 is the best buy point.
Is this analysis on the right track?
============
Completely wrong. Please carefully reflect on this: no trend, no divergence. Divergence is a comparison between two trends. If you don't first identify two separate trends, where is there any divergence to speak of?
缠中说禅 2006/12/14 15:50:32
[Anonymous] 摄影之友
2006-12-14 15:33:14
Blogger:
The market has now achieved staged progress. Please once again show us clearly the next operational move. These past few days without your clear guidance, it's been truly depressing and performance has been poor. Consider it "a boost after already getting on the horse"...
Light position today. Hope my thinking is correct.
=========
Yet another wrong mindset. Let me ask: is it a bull market or a bear market? If it's a bull market, opportunities are all over the street—why go light? Since the rise from 1000 points, has your position constantly shifting back and forth outperformed just holding component stocks without moving? If not, then your operations have serious problems.
If you're in the market, capital that returns should immediately be deployed into the next suitable target—for example, finding stocks that meet criteria on 30-minute or daily charts, or finding rotation stocks. That's how you increase capital utilization. Or simply hold some stocks long-term and continuously trade short swings based on market fluctuations to lower your cost basis—that also improves capital utilization. Not making money in a bull market is related to having a bear market mindset.
缠中说禅 2006/12/14 15:58:37
Chán Zhōng Shuō Chán
2006-12-14 15:43:19
[Anonymous] ruifeng0021
2006-12-14 15:35:35
580991 assignment...
============
Completely wrong. Please carefully reflect on this: no trend, no divergence. Divergence is a comparison between two trends. If you don't first identify two separate trends, where is there any divergence to speak of?
========
One more thing: for the segment of movement you identified, on the 5-minute chart, it IS "downtrend + consolidation + downtrend," but on the 30-minute chart, it's just a single downtrend. Please think carefully about this distinction.
缠中说禅 2006/12/14 16:02:18
[Anonymous] 翅膀的痕迹
2006-12-14 15:55:13
Chan MM: Before October 27
, a downtrend + consolidation + downtrend pattern. On the 27th, a new historical low but with shortened green bars—judged as divergence.
=========
Wrong. Analysis cannot be this rough—it must be rigorous. If you truly master this method, you'll understand its rigor.
Let this ID give you another Chan Theorem: any non-consolidation type turning-point uptrend is formed after a "downtrend + consolidation + downtrend" of some level. The reverse applies to downtrends.
Understand it well.
缠中说禅 2006/12/14 16:03:48
[Anonymous] Night雨
2006-12-14 16:00:46
Beautiful big sister, thank you for your explanation on 038004. I got another reminder from you. I made swap operations this afternoon and if there are gains, I'll share with everyone. I wonder if my guess is right, haha.
The above was prompted by yesterday's beautiful sister's answer about 038004, so yesterday afternoon I entered 030002. The blogger has already tipped us off on several bull stocks—600839 and 000927. I had them before coming here, and after reading the blogger's articles, I'm more confident in holding. Everyone should search carefully—it's like a treasure hunt game!
Thank you again, beautiful big sister!
===========
This is a place for discussing technique—not treasure hunting. Master the technique first.
缠中说禅 2006/12/14 16:12:56
[Anonymous] 中间体
2006-12-14 16:06:08
2006.6.2-7.12 downtrend.
2006.7.12-10.19 consolidation
10.19 onward, second downtrend, divergence appears.
Is this correct?
===========
First you need to clarify what chart you're discussing on. On the daily chart, for a downtrend to form, you need to clearly see at least two highs and two lows. What you call a downtrend doesn't meet this requirement, and the same goes for what you call consolidation.
缠中说禅 2006/12/14 16:31:27
[Anonymous] 在路上
2006-12-14 16:14:28
I thought I understood what consolidation is, but after seeing the Chiho-Tiande example I'm confused again. Please enlighten, Chan sister.
On the daily chart, June 2, 2004 to September 10, 2004 constituted a downtrend—this is obvious.
But September 10, 2004 to March 14, 2005 being consolidation—I don't quite understand. Compared to the previous period, it also made a new low and didn't exceed the previous high, so how can it be consolidation?
Please enlighten, Chan sister!!!
=============
Consolidation can form various different patterns. This is a special type of consolidation called a trending platform—the weakest form of consolidation.
Since we haven't discussed the concept of the value center yet, the most rigorous definition of trends versus consolidation can't be given yet. This definition is exclusive to this ID—I'll discuss it later.
缠中说禅 2006/12/14 16:49:31
[Anonymous] ruifeng0021
2006-12-14 16:36:28
===========
Completely wrong. Please carefully reflect on this: no trend, no divergence...
========
One more thing: for the segment of movement you identified, on the 5-minute chart, it IS "downtrend + consolidation + downtrend," but on the 30-minute chart, it's just a single downtrend...
Not clear yet—may I ask: on the 30-minute chart of 580991, doesn't the period from September 28 at 14:30 to October 20 at 11:30 count as consolidation?
I see the same pattern on the 30-minute and 5-minute charts from September 22 to October 23. Please explain the difference.
Also, on the daily chart, is it the comparison between the two trends of 5.31-7.11 and 9.21-10.23?
=============
Do you know why? Because its decline on the 30-minute chart doesn't produce any visible highs or lows at all—it's basically a straight line down, barely breaking the 5-day to 30-day lines. This can only count as a decline at a lower level.
Note: within a trend at any level, there must be obvious highs and lows. On the 30-minute chart, there aren't any—while on the 5-minute or 1-minute charts, they're obvious. So on the 5-minute chart, it's "downtrend + consolidation + downtrend," while on the 30-minute chart, it all counts as a single downtrend.
缠中说禅 2006/12/14 16:51:17
[Anonymous] 雨中荷
2006-12-14 16:39:30
Hello blogger!
For 580991, is the divergence because the area formed by the 5-day and 10-day crossover from June 2 to July 14 is far larger than the area formed from September 2 to October 17, so divergence can be determined? And then on October 23, the price makes a new low while MACD green bars shrink, indicating the first buy point forms. Please evaluate, thanks!!!
==========
First, don't jump to judging divergence. Divergence is expressed through the strength between two trends—first identify the trends, their levels, and only then is there a basis for identifying divergence.
This line of thinking must be clear! Understand it well.
缠中说禅 2006/12/14 16:58:56
[Anonymous] 阿Q
2006-12-14 16:37:52
Another Chan Theorem: any non-consolidation type turning-point uptrend is formed after a "downtrend + consolidation + downtrend" of some level. The reverse applies to downtrends.
I looked at the chart and understand it this way: the non-consolidation type uptrend on the 30-minute chart is formed by the "downtrend + consolidation + downtrend" on the 5-minute chart. Correct?
==========
No—it's not necessarily a lower level; it could be the same level or even a higher level. That's why it says "some level."
缠中说禅 2006/12/14 17:03:01
[Anonymous] 获益匪浅
2006-12-14 16:54:56
Looking at the chart again, I seem to have a new discovery. Please advise. On the daily chart, a downtrend begins from June 1. The first low appears on July 12, then a reversal forms the first kiss—a wet kiss. A second decline starts on September 21 and the second low appears on October 23, lower than the first. Comparing MACD green bars and the area formed by moving averages, trend strength is noticeably weakened—forming divergence.
==========
This reasoning is muddled. If you get used to thinking this way, you'll have great difficulty dealing with complex real-time situations.
It should be: first determine at what level the trend appears, and that there are two sequential trends, then—and only then—can you begin discussing divergence.
Once more: no trend, no divergence. First identify the trend clearly.
Divergence is a comparison between two sequential trends.
You must shift your thinking. The framework here is completely different from elsewhere. Don't think you can identify divergence just by seeing green bars—that's only an auxiliary tool. First, identify the trend.
缠中说禅 2006/12/14 17:09:59
General Secretary
2006-12-14 16:59:16
Blogger, when looking at charts, should you pick one level and always stick with that level, or look at multiple levels? Like first looking at daily, then 30-minute, then 5-minute? Thanks.
============
You enter and exit based on a specific level's chart, but first you need to understand how the movement at your level is produced. Moreover, trend changes often start from other levels, so of course you need to look at different level charts. But for entries and exits, decide the level based on your capital and other factors.
This is very straightforward. For example, with 1 billion in capital, a 30-minute buy point is obviously meaningless to you—so there's no need to look at 30-minute charts for entries and exits. Say you enter and exit based on daily charts—you must constantly monitor the 30-minute chart. Why? Because changes on the daily chart start from the 30-minute chart first. You must know what's happening on the 30-minute level. Of course, 5-minute is too short—no need to watch that.
缠中说禅 2006/12/14 17:12:32
Announcement
It seems everyone is still quite confused about levels, trends, divergence, and consolidation. Next Monday, this ID will upload a more systematic and detailed article about these concepts. In the meantime, think them through on your own first—understanding them yourself is the best approach.
缠中说禅 2006/12/14 17:15:50
[Anonymous] 面甲
2006-12-14 17:10:16
May I ask, sister: in a major bull market, how do you find stocks at the first buy point? Go look at the biggest losers list? After all, most stocks are between buy and sell points.
============
Your question shows you haven't read the previous lessons at all. First thoroughly digest the previous lessons�—then you won't ask questions like this.
One hint: buy and sell points are level-dependent. A first-type buy point on the daily chart might appear only once in two years, while on the 5-minute chart it might appear every two days. It all depends on what you want to do.
缠中说禅 2006/12/14 17:22:04
I Am Ah Q
2006-12-14 17:17:50
Chán Zhōng Shuō Chán
2006-12-14 16:37:52
Another Chan Theorem: any non-consolidation type turning-point uptrend is formed after a "downtrend + consolidation + downtrend" of some level...
I understand: the non-consolidation type uptrend on the 30-minute chart is formed by the "downtrend + consolidation + downtrend" on the 5-minute chart. Correct?
==========
No—it's not necessarily a lower level; it could be the same level or even a higher level. That's why it says "some level."
==========
So this is only a necessary but not sufficient condition for a non-turning-point uptrend (downtrend)?
==========
No—your thinking again forgets about levels. A "downtrend + consolidation + downtrend" at some level necessarily leads to a non-consolidation type turning-point uptrend at some level.
But the key is the level. For example, if this uptrend only appears on the 1-minute chart, it may not be meaningful—that's what matters. It has nothing to do with necessary versus sufficient conditions.
Everyone: watch out for levels. This has been emphasized repeatedly from the very beginning. Discussing trends without specifying levels is meaningless. A trend on the 30-minute chart may be mere consolidation on the daily chart. You must be absolutely clear about this.
缠中说禅 2006/12/14 17:33:18
This ID is signing off. Here are the most important statements listed—each one must be thoroughly understood before you can truly get it:
-
Without specifying the level, there is no trend.
-
No trend, no divergence. Divergence is a comparison between two sequential same-direction trends—meaning having two same-direction trends visible on the same level chart is the prerequisite for divergence.
-
Trends, consolidation, etc., all require obvious highs and lows on the chart. Without obvious highs and lows, it can only constitute one segment within a trend or consolidation.
Get these simplest issues sorted out first—only then can you go deeper.
Because these are the most foundational things.
For example, the first-type buy point appears after divergence. If you can't even figure out what divergence is and are looking for first-type buy points within consolidation, you'll definitely run into problems.
Here's a question for everyone to think about. If you can answer correctly, then you'll have a rough understanding of levels, trends, consolidation, etc.:
How is the low point in consolidation at a given level formed?
The answer to this question also constitutes a Chan Theorem.
缠中说禅 2006/12/14 17:36:37
Everyone, stop rushing to answer the 580991 question. First sort out the basic questions above.
Signing off now. See you later.
缠中说禅 2006/12/14 17:46:49
I Am Ah Q
2006-12-14 17:40:57
Assignment:
How is the low point in consolidation at a given level formed?
The answer to this question also constitutes a Chan Theorem.
=============
Answer: The low point in consolidation at a given level is formed by a buy point at a lower level; similarly, the high point in consolidation at a given level is formed by a sell point at a lower level.
==========
A quick hint before I go—this answer is a classic case of seeming right while being wrong. To answer correctly, you must think through all the concepts carefully and rigorously, because some relationships are particularly subtle.
So this ID must assign homework—only this way can I know whether you've truly understood.
缠中说禅 2006/12/14 12:14:34
This method is highly effective—study it well. Also, please read more of the follow-up comments to the articles. This ID's replies address detailed points not covered in the main posts and are tailored to various questions posed by everyone.