Teaching You to Trade Stocks 61: Standard Illustration of Nested Interval Positioning (Analysis Demonstration Six)
2007/6/21 8:13:21
Some people often worry: what if everyone learns this ID's theory—would it still be useful? Anyone asking such a question fundamentally doesn't understand this ID's theory. Moreover, the idea that everyone could learn this ID's theory is itself a false proposition. For liberal arts students like Kong the Man, this ID has always felt their chances of learning it are rather slim. Note that this ID is using a qualifier here—not attacking all liberal arts students, but speaking specifically about liberal arts students like Kong the Man. Of course, if anyone wants to voluntarily shove themselves into the category of "liberal arts students like Kong the Man," this ID has no objections.
Some tedious questions keep getting raised, such as: what is the significance of a hub? For a practical operator, the significance of a hub is that it has no significance—and having no significance is itself the greatest significance. Because you only need to react according to the actual movement around the hub. The key is that you see clearly the decomposition of the trend rather than pondering the hub's meaning. What's more important is taking correct action based on the trend's decomposition. If liberal arts students like Kong the Man want to explore the meaning of hubs, let them have at it—just as Christian priests have been fantasizing about the meaning of God for millennia. For this ID, whatever garbage meaning God has isn't important; the key is that if there really were some God, it would merely be an object to be toyed with. Stocks are meant to be operated on, not to be philosophized about.
Still others keep asking: why does a 1-minute top divergence sometimes lead to a big drop and sometimes a small one? When exactly should I exit? This kind of question is a classic garbage question. If your operation level is the 1-minute level, then you should exit at a 1-minute top divergence. As for whether the subsequent decline is large or small, what does that have to do with you? You just need to patiently wait for the market to produce a new 1-minute bottom divergence. Conversely, if your operation level is the monthly chart, what does a 1-minute top divergence have to do with you? Since you've already decided to trade on a monthly basis, all fluctuations at the 1-minute level are acceptable and can be ignored. Never mind 1-minute fluctuations—even the so-called "great crash" of 530, if you were truly operating at the monthly level, you wouldn't even need to look at it. That magnitude of fluctuation is entirely within the tolerable range for monthly-level trading. Only liberal arts students like Kong the Man would think this ID's theory can only be applied to 1-minute charts. This ID has said many times: if you operate on the yearly level, you'd be more Buffett than Buffett himself. The key is whether you have that kind of patience.
Alright, no need to waste time on liberal arts students like Kong the Man. Look at the chart below—a standard illustration of nested interval positioning. If you took a basic mathematical analysis course in school, you shouldn't have much trouble understanding nested interval positioning. If you haven't studied it, then put in some extra effort. Although previous lessons have already covered this repeatedly, when the market actually produced this pattern around 13:30 on June 20, 2007, how many people could understand it in real time? Therefore, please study the following analysis carefully.
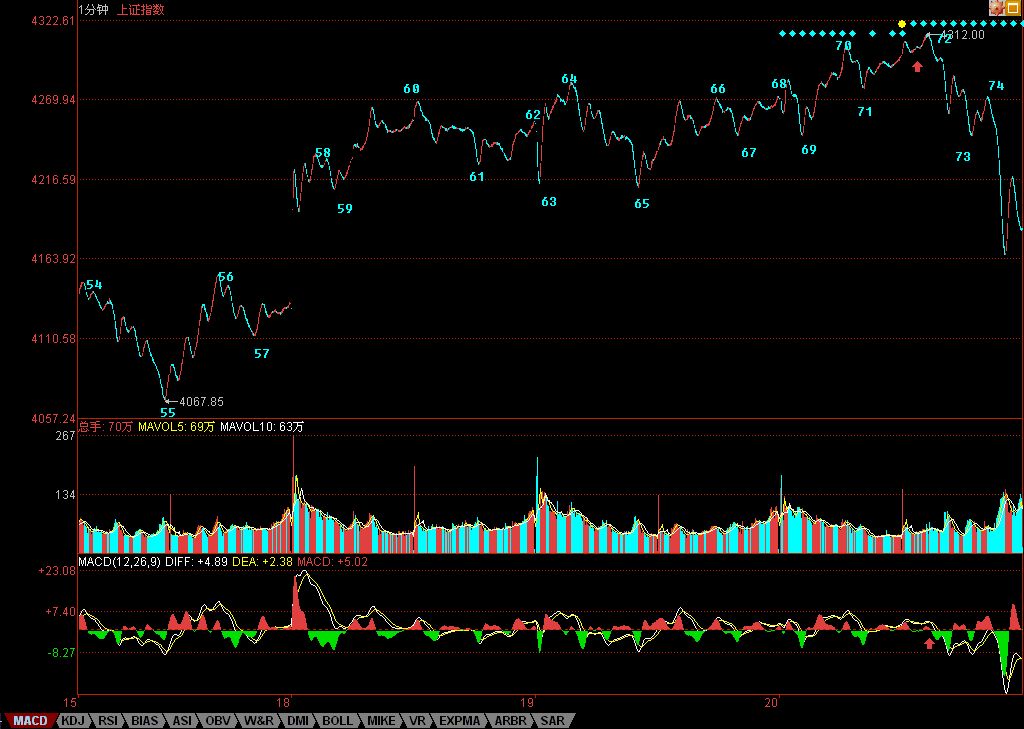
To compare momentum and discover divergence, you first need to clarify which two segments are being compared. Actually, any two segments of movement around a single hub can have their momentum compared. Obviously, for the 1-minute hub from points 60 to 65, the segments 55-60 and the segment starting from 65 can be compared. In actual operation, since the movement starting from 65 hasn't fully materialized, when comparing it with 55-60, you can first assume it's entering the divergence segment. When the movement actually plays out, once the momentum exceeds the former, you can determine that the divergence segment doesn't hold, meaning divergence won't occur. Before there's evidence denying divergence, you should observe the internal structure of the segment starting from 65 for divergence conditions. This method can be applied progressively downward—this is the nested interval positioning method. This approach can precisely locate turning points in real time.
For the internal movement starting from point 65, when it reaches point 69, it doesn't constitute any divergence. Why? Because divergence doesn't exist if there's no new high. So only when point 70 appears does the market enter a genuine danger zone for divergence. Since the 69-70 segment doesn't show consolidation divergence compared with the 67-68 segment, there's no reason to exit at point 70—unless you're operating at sub-line-segment levels. Point 71 then constitutes a third-type buy point for the 1-minute hub from 66-69. According to this ID's theory, what follows can only be one of two scenarios: hub level expansion, or the formation of a new upward-shifting hub. For the latter, a most basic requirement is that the upward segment starting from point 71 (the third-type buy point) must not show consolidation divergence. In practice, it's not hard to notice that the momentum of the movement starting from point 71 is clearly weaker than the 69-70 segment, and relative to the 65-66 segment, the momentum starting from 69 is also clearly weaker. This can be assisted by comparing the combined area of the corresponding MACD red bars below.
Therefore, the movement starting from 65 is the first layer of divergence, starting from 69 is the second layer (the divergence segment of the divergence segment starting from 65), starting from 71 is the third layer (the divergence segment of the divergence segment of the divergence segment starting from 65), and finally examining the movement starting from 71 in real time—from the red arrows on the price chart and the red arrows on the MACD, you can tell in real time that internal divergence within 71 has also appeared, meaning the fourth layer of divergence has emerged. Thus, the precise positioning of point 72 as a divergence point is constituted by the divergence segment of the divergence segment of the divergence segment of the divergence segment starting from 65. This forms a nested interval for precise positioning, and all of this can be done in real time.
For actual operations, once the quadruple-divergence point at 72 appears, selling is the only choice—the only difference is how much to sell. Of course, if you're operating at the 5-minute level or below, you sell everything, because afterward at least a 5-minute hub oscillation will form. In fact, 60-69 is already a 5-minute hub. For large-level operators, obviously you can't liquidate your entire position because of a 5-minute oscillation, so you can conduct hedging operations based on the capacity of the 5-minute oscillation. Under the same operational skill level, the profit rate for small capital is obviously far higher than for large capital. For example, at a sell point like this, small capital can go all-in on the trade, while large capital cannot.
If the judgment at point 72 has some difficulty, requiring knowledge of nested interval precise positioning, then the second-type sell point at 74 has zero difficulty whatsoever. The only thing that requires some discernment is that this second-type sell point is simultaneously a third-type sell point of a 1-minute hub—but which hub? Obviously not the 70-73 one, because the associative law must be satisfied here. A third-type buy/sell point requires at least 5 sub-level segments: the first three form the hub, the fourth leaves the hub, and the fifth constitutes the third-type buy/sell point. Actually, the answer here is very simple: point 74 is the third-type sell point of the 69-72 hub. In other words, point 74 is both a second-type sell point and a third-type sell point. As previous lessons have mentioned, when second and third-type buy/sell points appear simultaneously, the subsequent momentum is often worth paying attention to. In reality, the larger-magnitude decline that followed point 74 is not surprising at all.
For the 5-minute hub from 60-69, the 4244 level at point 69 is a key position. If a third-type sell point appears below it, the movement will at least expand into a 30-minute hub, and the magnitude and pressure of the correction would be significant. For the movement starting from point 72, point 73 is very important—to resume strength, it must break through point 73, which happens to also be at the 4244 level. Therefore, the short-term 4244 level is extremely critical. If it stabilizes above, the market will at most undergo extended oscillation within the 5-minute hub. Otherwise, even if it doesn't evolve into a 5-minute level decline, it will at least expand into a 30-minute level hub oscillation.
No matter what you're learning or whether you're willing to learn, first get what you're studying clear in your head. Otherwise, you're wasting your own time, and you'd be better off not learning at all. This ID's theory—take it or leave it. Just as regardless of whether you believe in gravity, regardless of whether you're God or George W. Bush, what exists continues to exist. This ID's theory is the same: regardless of whether anyone studies it, regardless of whether you're a market maker, a regulator, or whatever else, it neither gains nor loses a single fraction—it remains the same.
So, whatever you do, don't become a liberal arts student like Kong the Man. As for what kind of creature a liberal arts student like Kong the Man actually is, take a look at the two links below and you'll understand.
Appendix:
If after reading the lesson above you still can't understand or operate on today's market movement, then you probably face two choices: 1. Go join Kong the Man's company; 2. Wash your heart clean, reform yourself, and study hard. The technical significance of the 4244 level mentioned above was fully revealed in today's movement. The morning's panic selloff to fill the gap—this time it was a clear nested interval bottom divergence positioning. If you still can't understand, keep doubling your study efforts or go abandon yourself to Kong the Man. The choice is yours.
Tomorrow it's still about this 4244 level. Stabilize above it and the market strengthens; otherwise, the 5-minute hub oscillation continues, and you need to watch out for a third-type sell point. Tomorrow is the weekend again, and bearish news is ready to fly everywhere. This ID said long ago that oscillation here is necessary to dissolve the technical, psychological, and policy pressure. If every week it's the same cycle—Monday sees no news so it gaps up, then continuous oscillation until Friday, then waiting for weekend news—going around in circles like this will never produce a firm and powerful rally. So the key is still mentality. The entire market's mentality must be repaired through oscillation. Today's low was 4147, not far from the 1/2 line at 4144 that this ID has repeatedly mentioned. The medium-term key is still this line—as long as it's not broken, it's bullish.
On individual stocks, this ID laid out the script for those 16 stocks early in the morning. This ID said 16 stocks—already 8 have hit new highs, and 3 more hit the daily limit today. Why not have all 16 rise together? First, that would be too hard to manage; second, this approach maximizes capital utilization. If you rotate your trades according to this rhythm, for small capital, if your return during this rebound is less than 100%, then something is seriously wrong with you. Why should you watch for buy and sell points? Why emphasize rhythm? Ultimately, it's all about capital safety and utilization. This applies equally to large capital, and for small capital, mastering the rhythm makes you even more efficient.
Note: this ID doesn't mean you must buy this ID's 16 stocks. It's just that this ID announces and live-broadcasts the trading rhythm in advance, so everyone can grasp the principles of capital deployment within it. To be efficient, you must have rhythm; to have rhythm, you must first grasp the buy and sell points. Please think through this logical relationship carefully.
This afternoon there's a gathering—have a heart-to-heart, align our thinking. Must sign off now. See you tomorrow morning.
Replies
缠中说禅 2007/6/21 15:25:18
If after reading the lesson above you still can't understand or operate on today's market movement, then you probably face two choices: 1. Go join Kong the Man's company; 2. Wash your heart clean, reform yourself, and study hard. The technical significance of the 4244 level mentioned above was fully revealed in today's movement. The morning's panic selloff to fill the gap—this time it was a clear nested interval bottom divergence positioning. If you still can't understand, keep doubling your study efforts or go abandon yourself to Kong the Man. The choice is yours.
Tomorrow it's still about this 4244 level. Stabilize above it and the market strengthens; otherwise, the 5-minute hub oscillation continues, and you need to watch out for a third-type sell point. Tomorrow is the weekend again, and bearish news is ready to fly everywhere. This ID said long ago that oscillation here is necessary to dissolve the technical, psychological, and policy pressure. If every week it's the same cycle—Monday sees no news so it gaps up, then continuous oscillation until Friday, then waiting for weekend news—going around in circles like this will never produce a firm and powerful rally. So the key is still mentality. The entire market's mentality must be repaired through oscillation. Today's low was 4147, not far from the 1/2 line at 4144 that this ID has repeatedly mentioned. The medium-term key is still this line—as long as it's not broken, it's bullish.
On individual stocks, this ID laid out the script for those 16 stocks early in the morning. This ID said 16 stocks—already 8 have hit new highs, and 3 more hit the daily limit today. Why not have all 16 rise together? First, that would be too hard to manage; second, this approach maximizes capital utilization. If you rotate your trades according to this rhythm, for small capital, if your return during this rebound is less than 100%, then something is seriously wrong with you. Why should you watch for buy and sell points? Why emphasize rhythm? Ultimately, it's all about capital safety and utilization. This applies equally to large capital, and for small capital, mastering the rhythm makes you even more efficient.
Note: this ID doesn't mean you must buy this ID's 16 stocks. It's just that this ID announces and live-broadcasts the trading rhythm in advance, so everyone can grasp the principles of capital deployment within it. To be efficient, you must have rhythm; to have rhythm, you must first grasp the buy and sell points. Please think through this logical relationship carefully.
This afternoon there's a gathering—have a heart-to-heart, align our thinking. Must sign off now. See you tomorrow morning.
缠中说禅 2007/6/21 8:14:25
Today's market commentary will be appended to this post after 3 PM.
Signing off first, see you later.