Teaching You to Trade Stocks 82: Psychological Factors of Fractal Structures
2007/9/24 21:31:06
Trends reflect human greed, anger, delusion, doubt, and arrogance. If you can observe the psychological manifestations of participants through the present-moment display of the trend, you've essentially seen through the inner hearts of market participants. Psychology is not ethereal and intangible — ultimately it must leave traces, which are the market trends themselves. And certain structures with self-similarity serve precisely as scientific instruments for probing market psychology.
Note: fractals (分型) are not fractals (分形) in the mathematical sense. Fractal theory is a branch of mathematics. Some people forcibly apply research results from this branch to market trends, but the conclusions drawn have little significance. The logic of this ID's theory comes directly from market trends themselves, not from some a priori mathematical theory external to the market. As for the fact that the real market logic manifests mathematical structural patterns — that's another matter entirely.
The world is inherently mathematical. But this ID's theory is not an application of any existing mathematical theory; rather, it is the direct manifestation of the market's own real-world logic. This is an extremely critical distinction.
Clearly, the reason a top fractal forms is that the selling force ultimately defeats the buying force, and within this process, the buying force makes three attempts while the selling force conducts three interceptions. Using the most standard three-K-line model already processed for inclusion: the high of the first K-line is intercepted by the selling force, causing a pullback — this pullback appears in the upper shadow of the first K-line or the lower shadow of the second K-line. On the second K-line, a higher high appears, but this high must show divergence in force at a smaller level compared to the buying force that appeared at the first K-line's high, thereby at minimum creating the upper shadow of the second K-line. Finally, on the third K-line, the buying force launches yet another attack, but this attack is completely defeated by the selling force, failing to create a new high. At the smaller level, this roughly manifests as a second-type sell point pattern.
From the above, we can see that the emergence of a fractal structure, like a hub, undergoes a three-fold psychological contest process — except a hub uses three sub-level movements. As the saying goes, "once, twice, thrice — and the momentum is spent." This is how a top fractal emerges, and for bottom fractals, just reverse everything.
Now, we can deeply analyze the different situations of these three K-lines. First, a fractal structure with absolutely no inclusion relationships means that both sides of the market are straightforward, without much hesitation. Inclusion relationships (as long as it's not a case of a long bearish candle directly engulfing a bullish candle) indicate hesitation, a sense of uncertain observation, etc. — at smaller levels, there will generally be hub extensions, expansions, and the like.
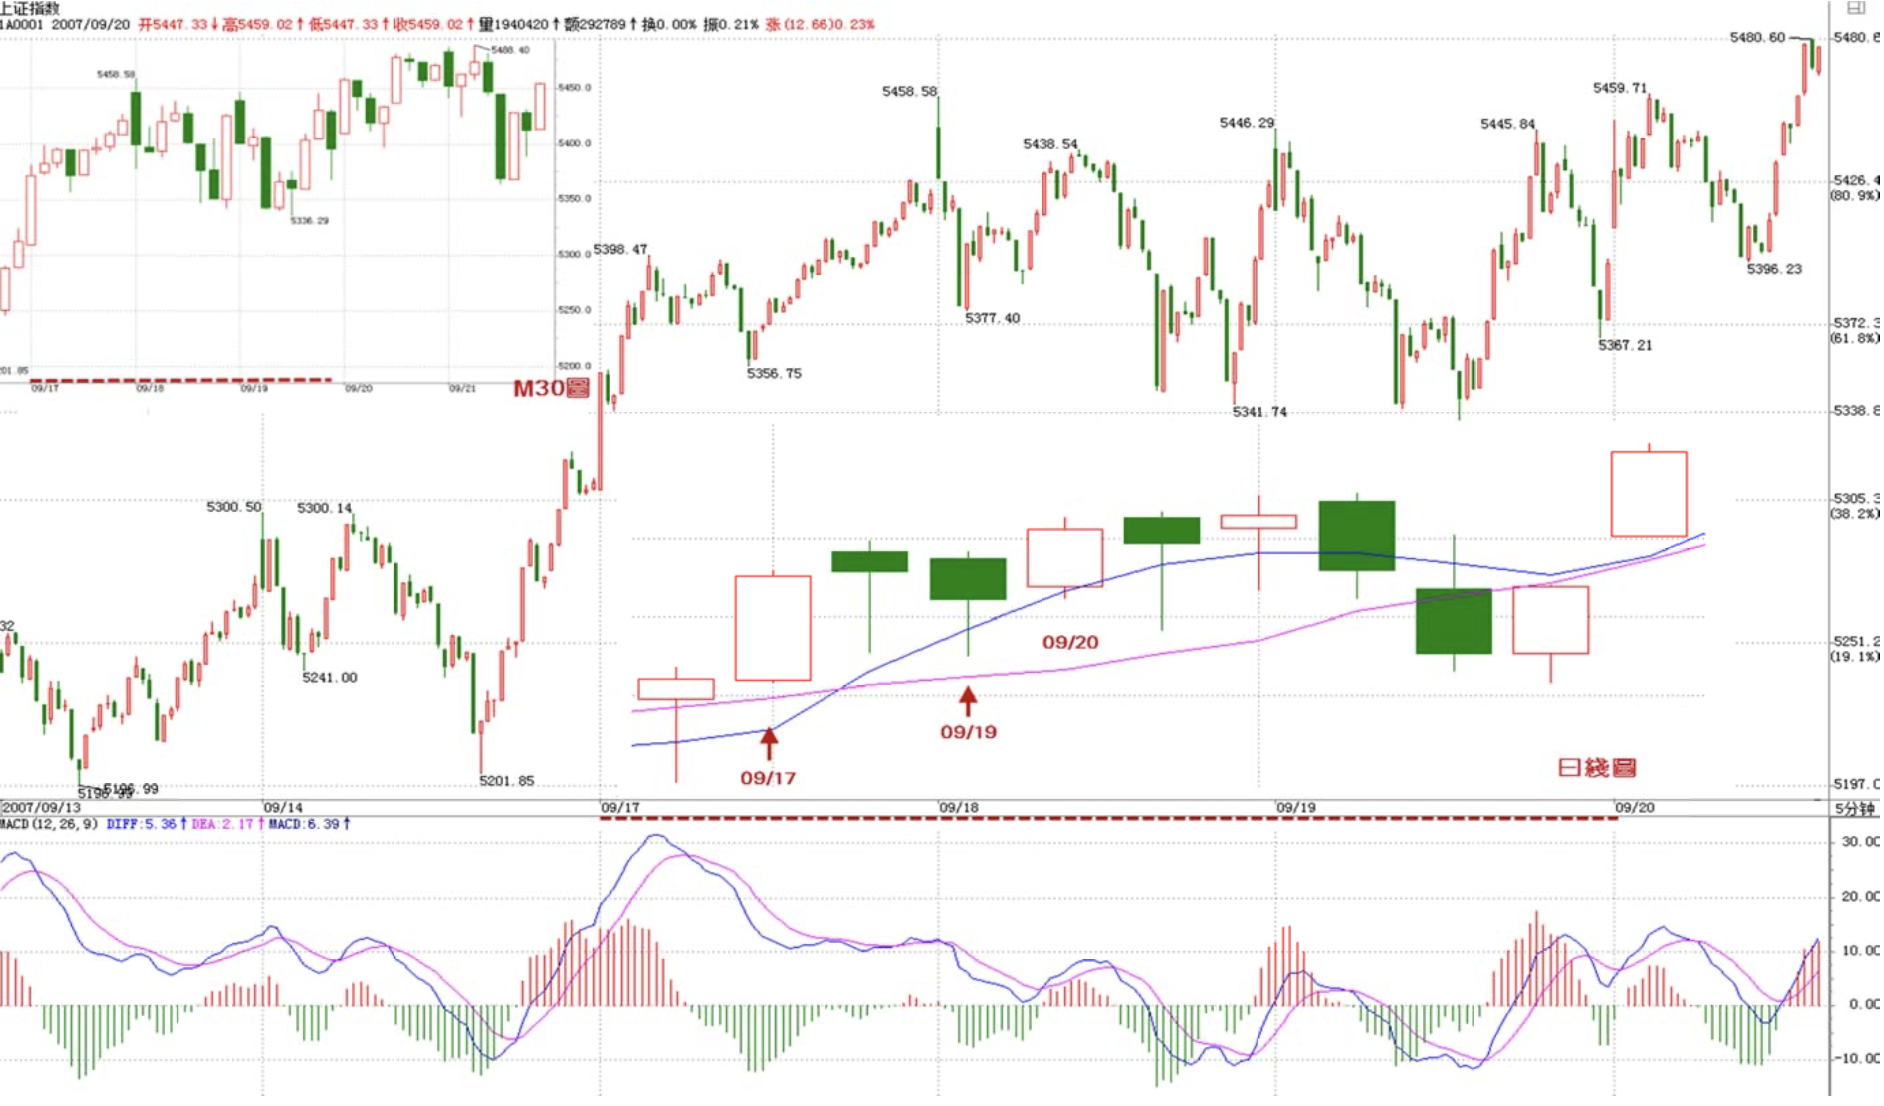
Second, still using the non-inclusion-relationship top fractal as an example: if the first K-line is a long bullish candle while the second and third are small bearish or small bullish candles, then this fractal structure has little significance. At the smaller level, it must manifest as the formation of a new smaller-level hub after a smaller-level hub moves up. Generally speaking, this kind of top fractal has very low probability of becoming a real top — the vast majority are continuations. For example, the Shanghai daily chart's three K-lines on September 17, 18, and 19 forming a top fractal structure:
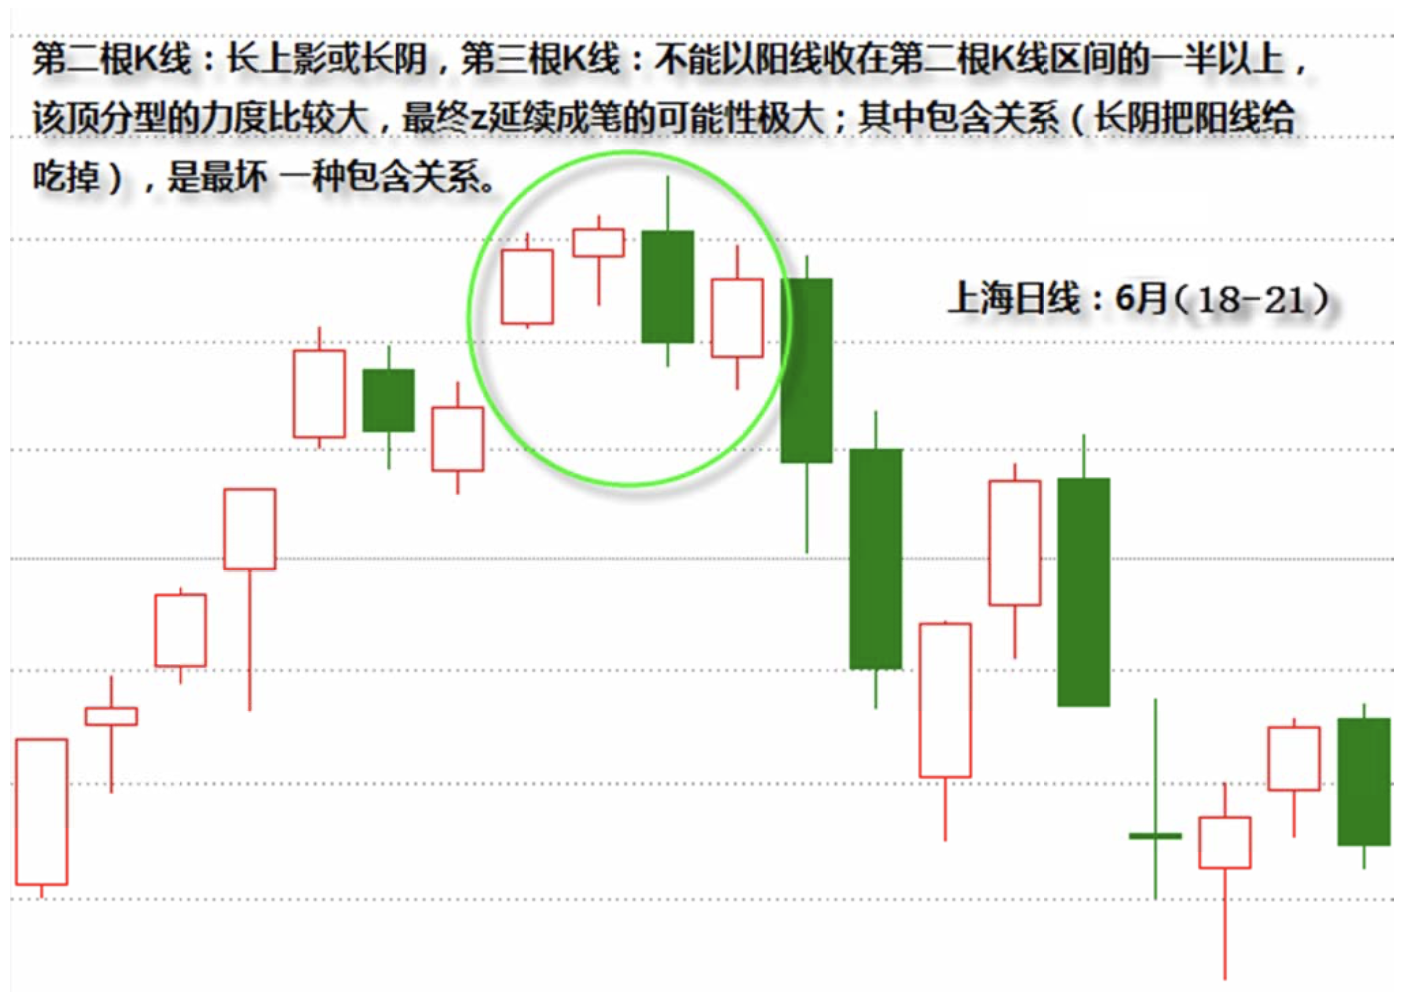
However, if the second K-line has a long upper shadow or is directly a long bearish candle, and the third K-line cannot close as a bullish candle above the midpoint of the second K-line's range, then the strength of this top fractal is relatively powerful, and the probability of it eventually extending into a stroke is extremely high. For example, the Shanghai daily chart on June 18, 19, 20, and 21 — which contains an inclusion relationship, but this inclusion is the worst kind, where a long bearish candle directly engulfs a bullish candle.
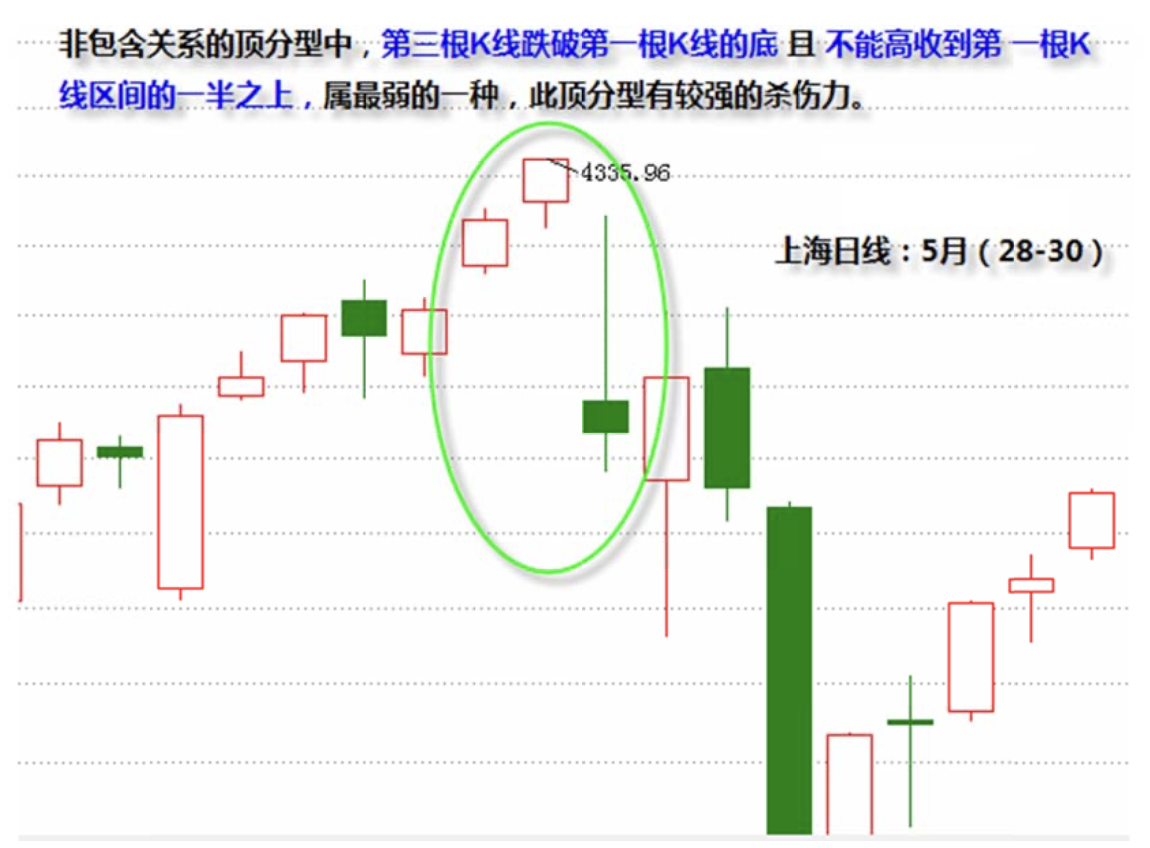
Generally speaking, in a post-inclusion-processed top fractal, if the third K-line breaks below the bottom of the first K-line and cannot close above the midpoint of the first K-line's range, this is the weakest type — meaning this top fractal has relatively strong killing power. For example, the Shanghai daily chart on May 28, 29, and 30:
After a fractal forms, there are only two possible structures: first, it becomes a continuation type that ultimately doesn't extend into a stroke; second, it extends into a stroke. For the latter, that's the most ideal scenario — for example, after completing operations on the daily chart, just wait for the opposite fractal to appear before operating again. In between, you can go dote on other stocks — this is the most efficient approach. For the first situation, as mentioned earlier, you can check whether the 5-period moving average is effectively broken. For example, for a daily top fractal, whether the 5-day moving average is effectively broken is an excellent operational basis for judging similar top fractal patterns.
However, there's an even more precise and simpler method: within the smaller-level hub corresponding to this fractal, check whether a third-type buy/sell point appears and whether hub movement follows. For example, after a top fractal forms, the fractal's range must form a hub of some level in the smaller timeframe. Select the largest one — for instance, after a daily top fractal, you can find corresponding 5-minute or 1-minute hubs. Generally, the largest is the 5-minute one; 30-minute isn't possible because there isn't enough time. If this 5-minute or 1-minute hub produces a third-type sell point, and that sell point doesn't result in hub expansion, then you can be almost 100% certain that a stroke will form on the daily chart.
What can be 100% confirmed is: for a stroke not to form and for the top fractal to be effectively destroyed, a third-type buy point of some level must appear. Otherwise, even if there's a brief new high, it's definitely a false breakout. So by combining with smaller-level hub judgment, whether a top fractal extends into a stroke can be determined at a glance in the present moment.
If you can effectively distinguish continuation fractals, your operations will make significant progress.
Generally speaking, you can combine fractals with smaller-level trend types for operations — for example, combining daily charts with 5-minute charts. If during a smaller-level hub oscillation, not even a daily K-line top fractal structure appears, then there's no need to exit this hub oscillation. Even if you're playing short-term trades, you need to control the quantity, because without a fractal, it means the trend hasn't ended — a new high can come at any time. What's your rush? Once a top fractal is established, it necessarily corresponds to first or second-type sell points on the smaller level. After that, the key is watching for the third-type buy/sell point situation in the newly formed hub: generally, if it's a continuation, there will be a third-type sell point followed by hub expansion — meaning there'll be an exquisite consolidation divergence opportunity for you to re-enter. This way, you use the fractal to capture a beautiful short-term spread without missing the subsequent trend — this constitutes a reasonably competent operation. We've all experienced this exact operation — the Shanghai weekly chart's top fractal around September 7, a perfect continuation top fractal completed under the combined effect of the false breakdown below the 5-week moving average and the corresponding smaller-level divergence.
Note: when using fractals — for example, after selling on a top fractal — you must pay attention to whether you should buy back. Once confirmed as a continuation, you should buy back; otherwise, wait for the stroke to complete before acting.
But be absolutely aware: after a continuation top fractal, if the subsequent trend shows divergence or consolidation divergence at the corresponding smaller level, then the next top fractal has a drastically reduced probability of being a continuation. Continuation fractals are somewhat like braking — one press might not stop the car completely, but if the car speed has clearly decreased after the first brake, it proves the braking system is effective, and the probability of stopping on the second press is extremely high — unless you press the wrong pedal and hit the gas instead.