Teaching You to Trade Stocks 57: Another Demonstration of Real-Time Chart Analysis
2007/5/31 22:35:44
Partly due to management's midnight serenade, this week has already been four straight days of stock talk. This ID will go for a grand slam and make it five, though this won't become a precedent — talking stocks every day, five days a week, even if you all don't get aesthetic fatigue, this ID is tired of it.
Seeing that many are still confused, I'll use these two days' 1-minute charts to continue demonstrating how to perform chart analysis. Of course, all these analyses can be performed in real-time. Looking at replies today, it seems someone wants this ID to broadcast real-time tips on QQ or something — absolutely not. For this ID, QQ is only for 419 purposes; using it for stocks would be far too wasteful. Moreover, this ID's 4-hour window is sacred — not even the Heavenly King himself can disturb it. To put it somewhat bluntly, this ID's capital is probably more than the sum of all capital belonging to everyone who comes here. If this ID is busy on QQ and something goes wrong, who takes responsibility? So this format is the maximum — much of this requires self-practice. At most, this ID is just a sparring partner.
It must be emphasized once again: inexperienced investors must absolutely not operate with full positions. The basic position should hold mid-to-long-term stocks, with a portion of the position available for practice. Otherwise, operating at full position, a few stumbles from half-baked maneuvers, and you'll have no principal left. And you must pay attention: sell points appear during rallies, not through panic selling. If you dumped at the floor price, it certainly wasn't at a sell point. As long as you make money, you haven't sold wrong — better to sell too early than too late. If you sold wrong, stop watching that stock unless a new buy point appears.
Also, some people misunderstand, thinking this ID's method is about frantically doing short-term trades. These people probably learned Chinese from Confucius Boy, which explains their level. Using this ID's method, if you choose to operate at the yearly level, you'd be more Buffett than Buffett — after a yearly buy point, you'd probably have to wait decades for a sell point. So hold for decades — I just worry you can't hold that long. Furthermore, if you operate on the weekly level, then over these past two years, at least on the index level, you've had no sell point at all. As for those operating on the 30-minute level, after a 30-minute third-type buy point during an upward hub shift — if this shift starts from 10 yuan, as long as no new 30-minute hub forms, even if it reaches 100,000 yuan you'd still have to hold. Why? No sell point. So those who say studying this ID's theory makes them unable to hold stocks, reflect carefully — what exactly did you learn?
Enough idle talk, let's look at the charts.
Looking at the chart, first determine the minimum analysis level — meaning everything below this level can be treated as line segments. From the minimum analysis level's perspective, each line segment is a sub-level trend type, and three overlapping line segments constitute a hub at the minimum analysis level.
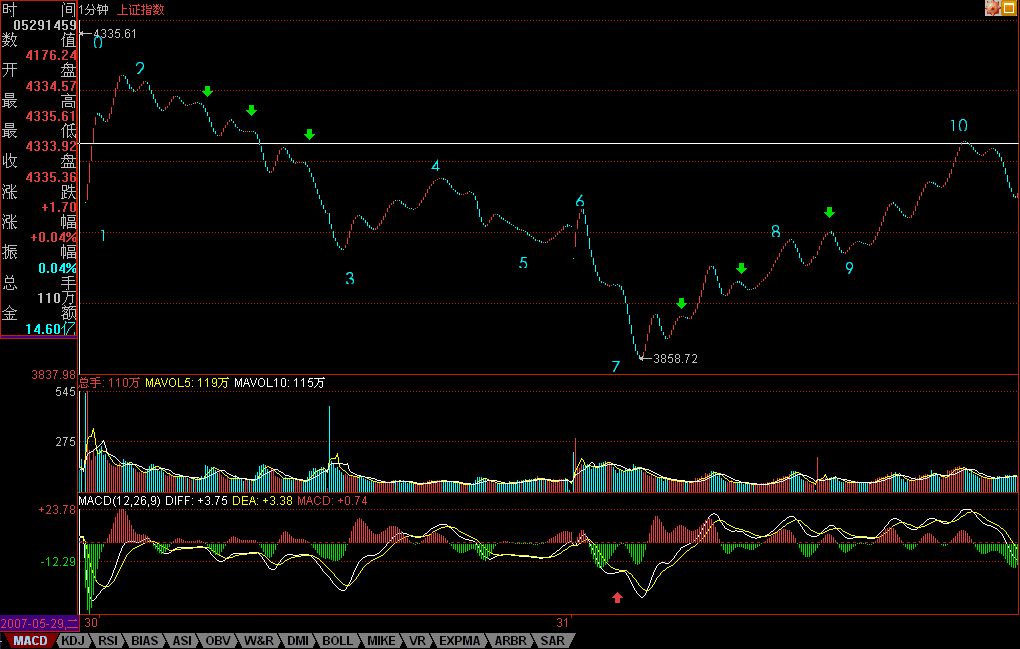
Of course, these line segments themselves may belong to different levels — this was discussed previously. For example, in this chart, the minimum analysis level is set at the 1-minute level, so all sub-1-minute levels are line segments, marked with numbers on the chart. Every [N, N+1] is a line segment. Someone might ask: segment 0-1 is a gap, while segment 2-3 goes up and down with great complexity — how can both be line segments? Because neither is a 1-minute trend type; neither contains a 1-minute hub, so both are sub-1-minute level. Although the gap is of the lowest possible level and naturally lower than segment 2-3, under the 1-minute level microscope there's no distinction — both can be treated as line segments with no internal structure. Of course, if you want to examine 2-3's internal structure, you can, but that would no longer be from the 1-minute level basis.
From this, the chart above can be seen as consisting of 10 line segments, and fluctuations within segments can be ignored — at least from the perspective of analyzing the 1-minute level. There's one potentially questionable area: in segments 2-3 and 7-8, at the five spots marked with green arrows, they might appear to be one line segment each. But why aren't they? Because in what appears to be a three-segment structure, the third leg in each is too weak — shrinking the chart makes them nearly invisible. Compare this to the green arrow spot in segment 8-9, where the third leg is clearly different — so that one is a sub-1-minute up-down-up structure, while the earlier ones are not. Of course, if you insist that the arrow spot in 7-8 is quite clear, then 7-8 and 8-9 would merge into one line segment forming an upward trend — that's also valid. But if you use that standard, then all spots of similar weakness to 7-8's arrow position must be treated the same way. This ID will stick with the markings on the chart.
Once the line segments are determined, everything becomes easy to analyze. Of course, in real-time — say at 9:30 AM today — the later segments wouldn't exist yet, but the standards for determining line segments remain the same. You can analyze segment 5-6 quite precisely: it has an up-down-up internal structure where the down segment is a gap. Regardless, it's one line segment. However, since the hub formed by 1-2, 2-3, 3-4 is only 1-minute level, the sub-level that constitutes its third-type sell point is a sub-1-minute line segment. At this point, you need to examine a sub-1-minute structure that has an up-down-up formation, and segment 5-6 clearly meets this requirement with its obvious up-down-up. Segment 4-5 also meets the sub-1-minute requirements. Note: when examining the 1-minute sub-level, you can no longer broadly treat all sub-1-minute movements as the 1-minute sub-level, because the perspective has shifted. Clearly, these 4-5 and 5-6 constitute a standard sub-level departure from the hub and pullback to the hub, and this 1-minute hub's range is [4087, 4122]. Since segment 5-6 only reached 4077, this is a third-type sell point.
Of course, in actual operations, one can analyze this problem with even greater precision. Within segment 5-6's up-down-up, the latter up's strength relative to the former up can be determined by comparing the MACD bar areas below — the insufficiency can be identified, meaning there's a very small-level divergence here. All of this can be analyzed in real-time. Of course, such precision requires the operator to be extremely proficient with very fast reactions and trading channels. Not everyone has this capability, and this is purely for analytical purposes. For larger levels, the principle is identical.
By the same logic, segment 6-7's internal down-up-down structure shows the latter down's strength is weaker than the former's — this can be seen from comparing the green bar areas pointed to by the two red arrows below. So there's internal divergence here. Note that the up within 6-7 is very weak in amplitude, but quite long in time — a small time-for-space rebound. So it can be counted as an up, and more importantly, this up causes the green bars to retract to the zero axis, further proving this is a technically significant rebound that cannot be ignored.
When the movement reaches point 6, segments 3-4, 4-5, 5-6 can be seen as a 1-minute hub. Of course, this decomposition differs from the original [4087, 4122] hub decomposition, but from the perspective of multiplicity, it absolutely complies with the associative law and is certainly a valid decomposition method. This decomposition makes 2-3 and 6-7 oscillations of this hub, allowing strength comparison methods to detect divergence. For the total green bar area below 2-3 versus 6-7, the latter is clearly smaller. So you know that 6-7 is merely an oscillation around the [3-4, 4-5, 5-6] hub that must at least pull back near the hub. Using the interval nesting method on 6-7's internal structure for precise positioning, the specifics are in the previous paragraph's analysis. Using this method, grasping the buy point at 7 is quite straightforward. Note that all of this can be analyzed in real-time — based on the current movement, you can naturally grasp it. If you treat point 7 as a first-type buy point, then point 9 would be a second-type buy point — this fits the definition of sub-level up, sub-level down, no new low or consolidation divergence. Compare points 2 and 9: one a sell point, one a buy point, both second-type. Of course, within 7-8, the down there is also a second-type buy point, but that buy point's level is lower than point 9's.
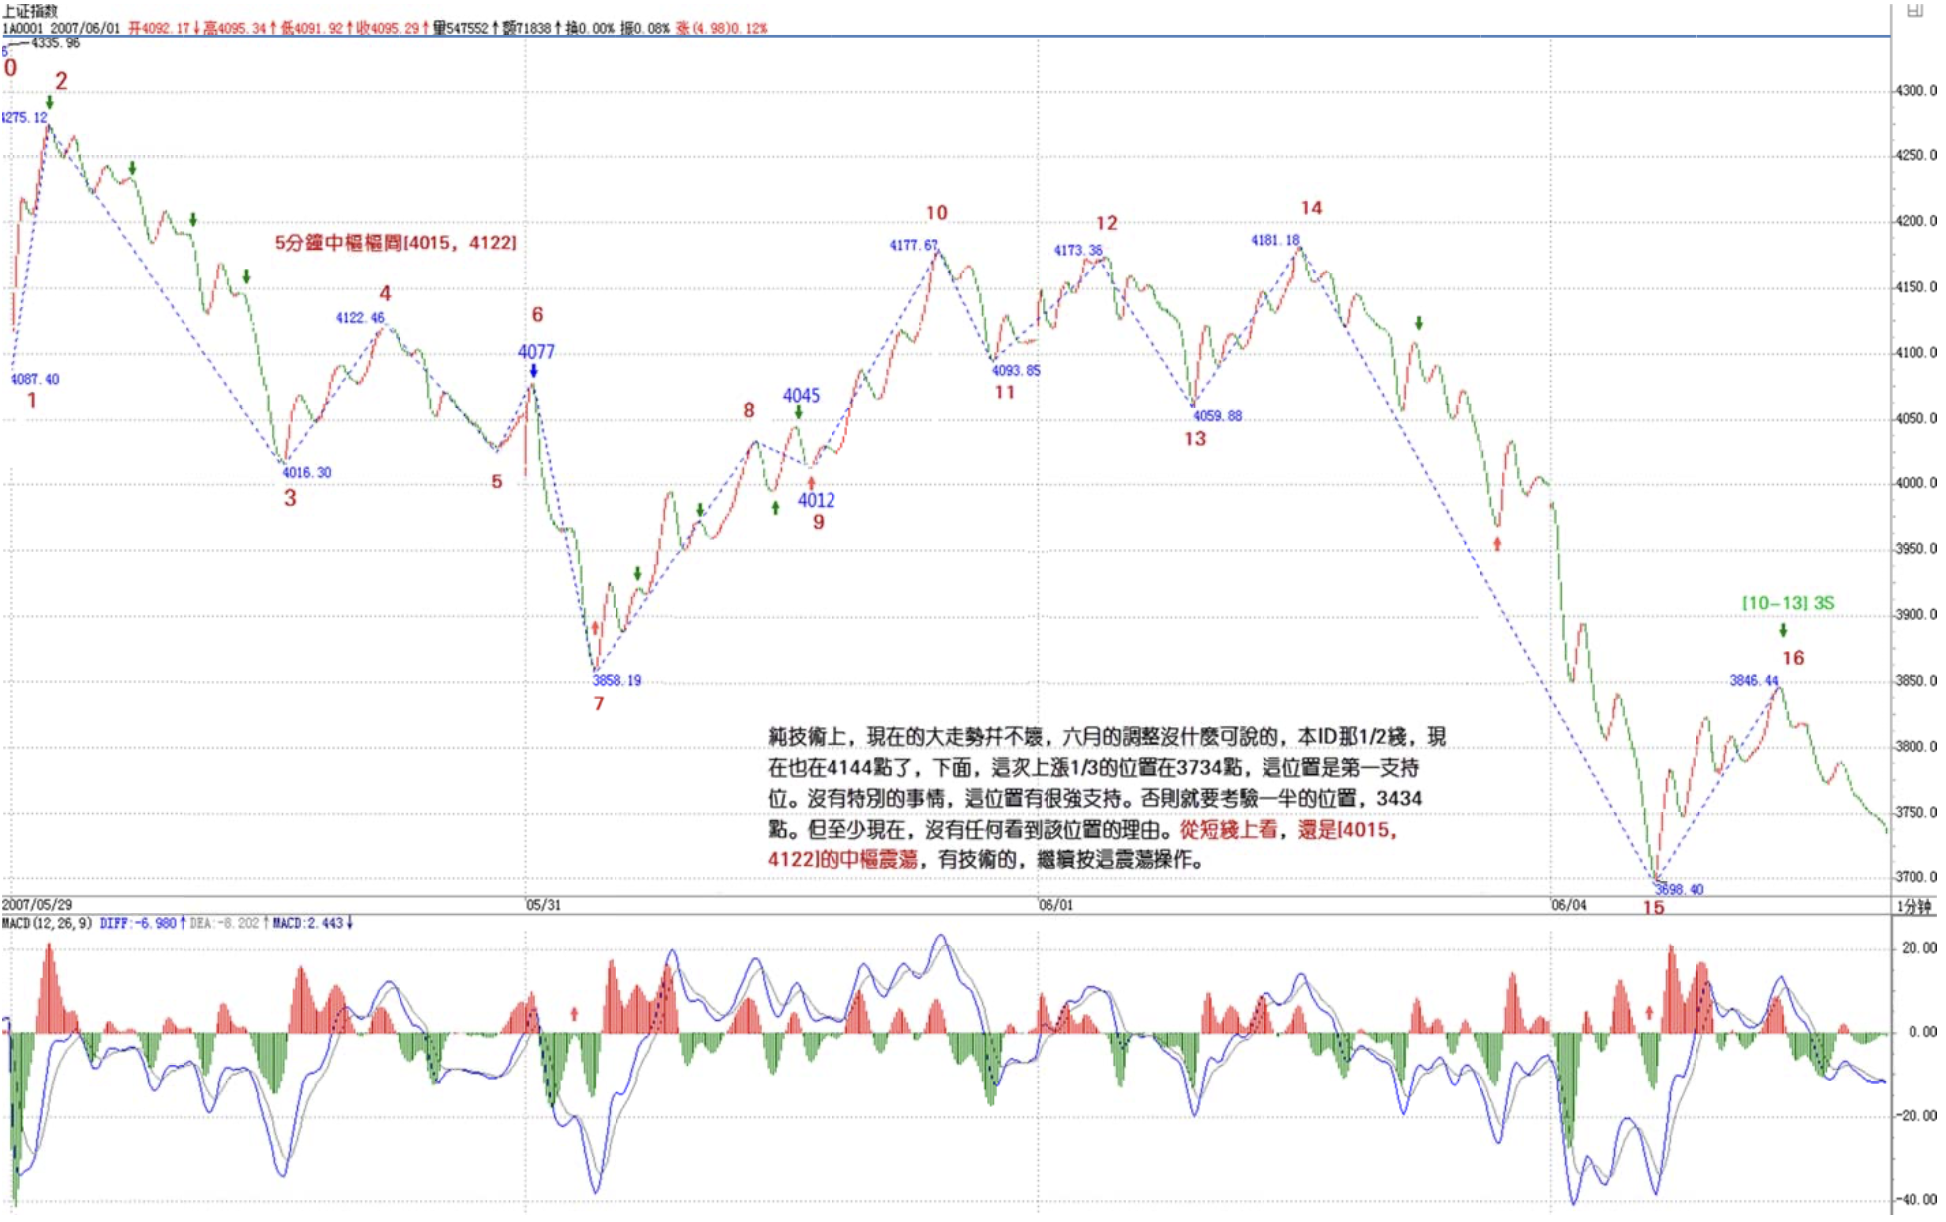
Clearly, these 10 line segments have already formed a higher-level 5-minute hub, combined as follows: (1-2 + 2-3 + 3-4) + (4-5 + 5-6 + 6-7) + (7-8 + 8-9 + 9-10), with the hub's range being [4015, 4122]. This point was actually already knowable from the existence of the third-type sell point at 6 and the subsequent divergence — the expansion of this hub's level was inevitable.
Note that this 1-minute chart is analyzed purely for demonstration purposes. These charts are the most complex — generally speaking, the larger the level, the simpler the chart. For operations, those without good technique or trading channels generally shouldn't use 1-minute charts. Increase the level — this must be made clear.
Appendix:
Today's movement was [4015, 4122] hub oscillation — at least the index shouldn't be hard to understand. Friday's movement like this is perfectly normal. Various people with hidden agendas spreading this rumor and that — retail investors are naturally like frightened birds. But today's movement is favorable for the future. The issue this time isn't what the government announced, but how it was announced. Such tactics must be severely punished — a most direct pressure must be borne by those who used such despicable methods: infamy. Starting Friday, public opinion will gradually shift, and a new round of reflection will begin. Note, the management isn't a monolithic voice. Also note that what was simultaneously announced these days was the Ministry of Finance's treasury bond issuance — so after this lesson in risk education, it should divert some people to buy treasury bonds.
However, retail investors truly need some education. Didn't someone recently boast that retail investors had already come to dominate the market? Yet after two days of drops, retail investors wilted. Large capital will always be the market's backbone. Without large capital, without these days' gatherings, could the movement in Beijing-region stocks have occurred? Let's see whether those policies attempting to restrict large capital will still come out. Some large capital operations — management has changed multiple times, yet they still stand unshaken, growing ever stronger. These brain-dead policies, besides hurting retail investors, who can they really hurt? This weekend, let management clean up their own mess. If they still enjoy this game of suppressing on one side then rescuing the market on the other, then let them play. This game has been going on for over ten years — truly skilled players only become more skilled through such games.
But for retail investors, these days have really been psychologically stressful — but this is actually nothing. This ID has repeatedly mentioned this historical precedent: in 1996, the index hit daily limit-down for three consecutive days, then later made new highs. So when the news was announced, this ID came up before 7 AM to tell everyone to sell at the second and third-type sell points. If you didn't sell, then forget it — why would you sell now? A major rebound is inevitable, future levels will definitely be higher than current ones. The key is: when it's time to leave, don't harbor illusions.
Note: selling stocks that have already dropped 30% to chase so-called "strong stocks" that haven't fallen — have you heard of the concept of catch-up decline? In a chaotic market, you should be even more focused. Let's discuss this rationally: a stock drops 40%, first rebound recovers 20%, sell half or two-thirds, buy back on the pulldown, rebound again, and the price you eventually exit at will be roughly the same as before the drop. If you currently have cash and buy into a stock that's dropped 40% — and it's not some busted manipulated stock — then this kind of operation has basically very small risk. With slightly better technique, hitting some buy and sell points, it's essentially as if you exited at the highs. Of course, in the future when encountering such situations again, you must exit at the second and third-type sell points. That day, how many people let down this ID who came up to post before 7 AM?
Actually, from a purely technical standpoint, the current major trend isn't bad. June's adjustment is nothing to talk about. This ID's 1/2 line is now at 4144 points. Below, the 1/3 position of this rally is at 3734 points — this is the first support level. Without special circumstances, this position has very strong support. Otherwise, the half position at 3434 points would need to be tested. But for now at least, there's no reason whatsoever to see that level.
Short-term, it's still [4015, 4122] hub oscillation. Those with skill, continue operating based on this oscillation. Next week's biggest opportunity is the major rebound of heavily beaten-down stocks — pay particular attention to stocks that have fallen to key positions like the annual or semi-annual moving averages. The rebound strength there will be more impressive.
The great tide washes away the sand — those who can face this week's situation with composure have completed an important lesson in their investing career. Treasure it and reflect deeply.
Weekend, go indulge.
Replies
缠中说禅 2007/6/1 15:47:14
Today's movement was [4015, 4122] hub oscillation — at least the index shouldn't be hard to understand. Friday's movement like this is perfectly normal. Various people with hidden agendas spreading this rumor and that — retail investors are naturally like frightened birds. But today's movement is favorable for the future. The issue this time isn't what the government announced, but how it was announced. Such tactics must be severely punished — a most direct pressure must be borne by those who used such despicable methods: infamy. Starting Friday, public opinion will gradually shift, and a new round of reflection will begin. Note, the management isn't a monolithic voice. Also note that what was simultaneously announced these days was the Ministry of Finance's treasury bond issuance — so after this lesson in risk education, it should divert some people to buy treasury bonds.
However, retail investors truly need some education. Didn't someone recently boast that retail investors had already come to dominate the market? Yet after two days of drops, retail investors wilted. Large capital will always be the market's backbone. Without large capital, without these days' gatherings, could the movement in Beijing-region stocks have occurred? Let's see whether those policies attempting to restrict large capital will still come out. Some large capital operations — management has changed multiple times, yet they still stand unshaken, growing ever stronger. These brain-dead policies, besides hurting retail investors, who can they really hurt? This weekend, let management clean up their own mess. If they still enjoy this game of suppressing on one side then rescuing the market on the other, then let them play. This game has been going on for over ten years — truly skilled players only become more skilled through such games.
But for retail investors, these days have really been psychologically stressful — but this is actually nothing. This ID has repeatedly mentioned this historical precedent: in 1996, the index hit daily limit-down for three consecutive days, then later made new highs. So when the news was announced, this ID came up before 7 AM to tell everyone to sell at the second and third-type sell points. If you didn't sell, then forget it — why would you sell now? A major rebound is inevitable, future levels will definitely be higher than current ones. The key is: when it's time to leave, don't harbor illusions.
Note: selling stocks that have already dropped 30% to chase so-called "strong stocks" that haven't fallen — have you heard of the concept of catch-up decline? In a chaotic market, you should be even more focused. Let's discuss this rationally: a stock drops 40%, first rebound recovers 20%, sell half or two-thirds, buy back on the pulldown, rebound again, and the price you eventually exit at will be roughly the same as before the drop. If you currently have cash and buy into a stock that's dropped 40% — and it's not some busted manipulated stock — then this kind of operation has basically very small risk. With slightly better technique, hitting some buy and sell points, it's essentially as if you exited at the highs. Of course, in the future when encountering such situations again, you must exit at the second and third-type sell points. That day, how many people let down this ID who came up to post before 7 AM?
缠中说禅 2007/6/1 15:47:30
Actually, from a purely technical standpoint, the current major trend isn't bad. June's adjustment is nothing to talk about. This ID's 1/2 line is now at 4144 points. Below, the 1/3 position of this rally is at 3734 points — this is the first support level. Without special circumstances, this position has very strong support. Otherwise, the half position at 3434 points would need to be tested. But for now at least, there's no reason whatsoever to see that level.
Short-term, it's still [4015, 4122] hub oscillation. Those with skill, continue operating based on this oscillation. Next week's biggest opportunity is the major rebound of heavily beaten-down stocks — pay particular attention to stocks that have fallen to key positions like the annual or semi-annual moving averages. The rebound strength there will be more impressive.
The great tide washes away the sand — those who can face this week's situation with composure have completed an important lesson in their investing career. Treasure it and reflect deeply.
Weekend, go indulge.
缠中说禅 2007/6/1 16:04:20
[Anonymous] 新手
2007-06-01 15:57:36
[Anonymous] Sina User
2007-06-01 14:50:15
Master Chan must have lost several hundred million these past few days, right?
You're way underestimating her! She definitely didn't lose! She knows all the news in advance — wouldn't she have finished trading long ago?
====
We retail investors are in agony — been following Miss Chan all along, and 915 hit three consecutive limit-downs. What do we do? Save us, Miss Chan!
==
If you truly followed this ID, you would have exited at the second-type sell point that morning. Think about why you didn't exit then — were you harboring some fantasy? Saying these things now is pointless. This ID can say that these stocks will ultimately have no problems. Short-term, you can operate using the method described above. Actually, if you've truly mastered this ID's theory, using a 30-minute level buy/sell point, operating 3 times, you recover 50%. The key is whether you actually can or can't.
缠中说禅 2007/6/1 16:10:24
[Anonymous] 大五牛
2007-06-01 16:02:52
I understood what you said, and I knew the overall trend would turn unfavorable, but there was a stubborn thought in my heart — I just didn't want to execute trades, so I suffered heavy losses. Master Chan, why is that?
==
Because you didn't truly understand — you haven't thoroughly traced things back to their source.
缠中说禅 2007/6/1 16:11:01
Snow Wolf
2007-06-01 16:05:25
Snow Wolf
2007-05-31 23:57:35
Blogger, hello
So late and still thinking of us — you've worked hard!
Sorry to bother you
The chart you gave seems to be missing a segment in the (9, 10) section — could you redo the analysis?
That section happens to have down-up-down overlap, making it harder to analyze
Could you explain it again?
==
Look at the chart — where is anything missing?
缠中说禅 2007/6/1 16:14:07
[Anonymous] christine
2007-06-01 15:42:03
Wrong. She definitely lost too.
Unless she's completely empty now. The logic is simple — calculate it yourself.
---
You're the one who's wrong! What would Miss Chan lose? Go look — 70% of the stocks Miss Chan holds have zero-cost positions.
==
There's no need to discuss this. This ID works on things every day — of course it's not entirely those 16 stocks. Those 16 that have buy points, this ID naturally manages. Haven't some of them already made new highs? Note: don't chase-buy those. Go find new ones with buy points.
缠中说禅 2007/6/1 16:16:24
[Anonymous] abc
2007-06-01 16:14:23
For stocks hitting daily limit-down, does the MACD become distorted? How do you judge that?
==
Look at larger-level charts. This ID demonstrates using 1-minute charts, but that doesn't mean you must operate on the 1-minute level. Otherwise, this ID suspects you learned Chinese from Confucius Boy.
缠中说禅 2007/6/1 16:21:26
[Anonymous] 蓝色的海
2007-06-01 16:16:30
Sigh, don't even mention how depressed I am today. Yesterday afternoon I bought two stocks — (600900, 14.57) and (600010, 8.1). This morning one went up and one went down, but by afternoon both were done for. Near the midday close I wanted to do a reverse spread on 600010, but I couldn't resist the itch and jumped in without waiting for the best timing — now I'm stuck! My mood hit rock bottom, so the first thing I did was come check Miss Chan's appendix. Refreshed N times before it finally appeared. Reading Miss Chan's words really lifted my spirits. But sadly all my money is in stocks now, so going out for a treat this weekend is impossible — I can only stay home and re-study Miss Chan's posts from the beginning! :(
=
What's there to be depressed about? A stock that's dropped 40% — buy it and there's no way you won't have profit opportunities, unless it's some investigated manipulated stock. Check all historical charts and you'll see. However, the safest approach is still finding the right buy point. But for those without the skill, just buy in proportions and wait.
缠中说禅 2007/6/1 16:23:14
[Anonymous] 冠军杯
2007-06-01 16:19:04
Chan MM, does today's message mean that stocks which rose against the market these past few days will catch-up decline?? For example, 000063 — please reply!! Thank you!!!
==
Didn't it already catch-up decline today? If you chased high and bought today, then you're in trouble — you would've been better off buying at the limit-down something that had already dropped 40-50%.
缠中说禅 2007/6/1 16:27:36
Sorry, this ID needs to go indulge. Everyone, carefully reflect on the week's gains and losses — this is precious wealth. Get your mindset right.
Signing off first, see you Sunday for the music session.
缠中说禅 2007/10/30 0:41:26
Weekend, go indulge.
缠中说禅 2007/5/31 22:38:23
For those who can't see the chart clearly, please find the 5th image in the album.
Nearly midnight, time to rest. Tomorrow's market commentary will be appended after the afternoon close.
Goodbye.