Teaching You to Trade Stocks 14: The Climax Program for Drinking Moutai!
2006/12/5 11:35:20
We've discussed a lot of theoretical material before. Now let's use an actual stock to demonstrate the specific application. Let's use Moutai—sipping Moutai while attending class. Here we first assume everyone reading this can find Moutai's weekly and daily charts since listing. Previously, we discussed three types of "kisses" between two moving averages, among which the "wet kiss" is the most obvious example of entanglement, while "flying kiss" and "lip kiss" are special cases of entanglement. In the moving average operating system, entanglement includes all three types of kisses. From a practical perspective, wet kisses occur most frequently, but in long-term moving average systems—such as weekly and monthly charts—lip kisses also appear quite often. Let's review the relevant definitions:
Flying kiss: the short-term moving average briefly flattens then continues along its original trend.
Lip kiss: the short-term moving average approaches the long-term moving average without breaking below or above it, then continues along its original trend.
Wet kiss: the short-term moving average breaks below or above the long-term moving average, even producing repeated entanglement, like glue.
Female-on-top: short-term moving average above the long-term moving average.
Male-on-top: short-term moving average below the long-term moving average.
First-type buy point: described in more vivid language, it is formed by the divergence-driven decline that occurs after the last kiss in a male-on-top position.
Second-type buy point: formed by the pullback after the first kiss in a female-on-top position.
Now, first open Moutai's weekly chart. On Moutai's nearly 6-year weekly chart, using the 5-week and 10-week moving average system, there is only one first-type buy point and one second-type buy point. This shows that on the weekly chart, buy points formed by the moving average system are rare—once they appear, they must be cherished. Detailed analysis: the week of April 19, 2002, Moutai entered the male-on-top position. Then the week of July 9, 2002, the first kiss in the male-on-top position appeared. As mentioned before, the decline after this first kiss generally doesn't constitute a buy point—it must be at least the second kiss or later. The second kiss appeared the week of February 14, 2003—a classic wet kiss—but the subsequent decline didn't produce divergence, so it didn't qualify as a first-type buy point. Then the week of June 27, 2003, the third kiss formed—a less intense wet kiss—and the subsequent decline showed obvious divergence. On the MACD chart, the green bars were significantly shorter than the previous ones, while the low price was lower than during the previous green bars. How to determine when a divergent trend ends: the simplest way is when the green bars shorten while the price continues making new lows. This clearly occurred the week of September 26, 2003, meaning the bottom appeared, the first-type buy point construction was complete, and one could enter aggressively.
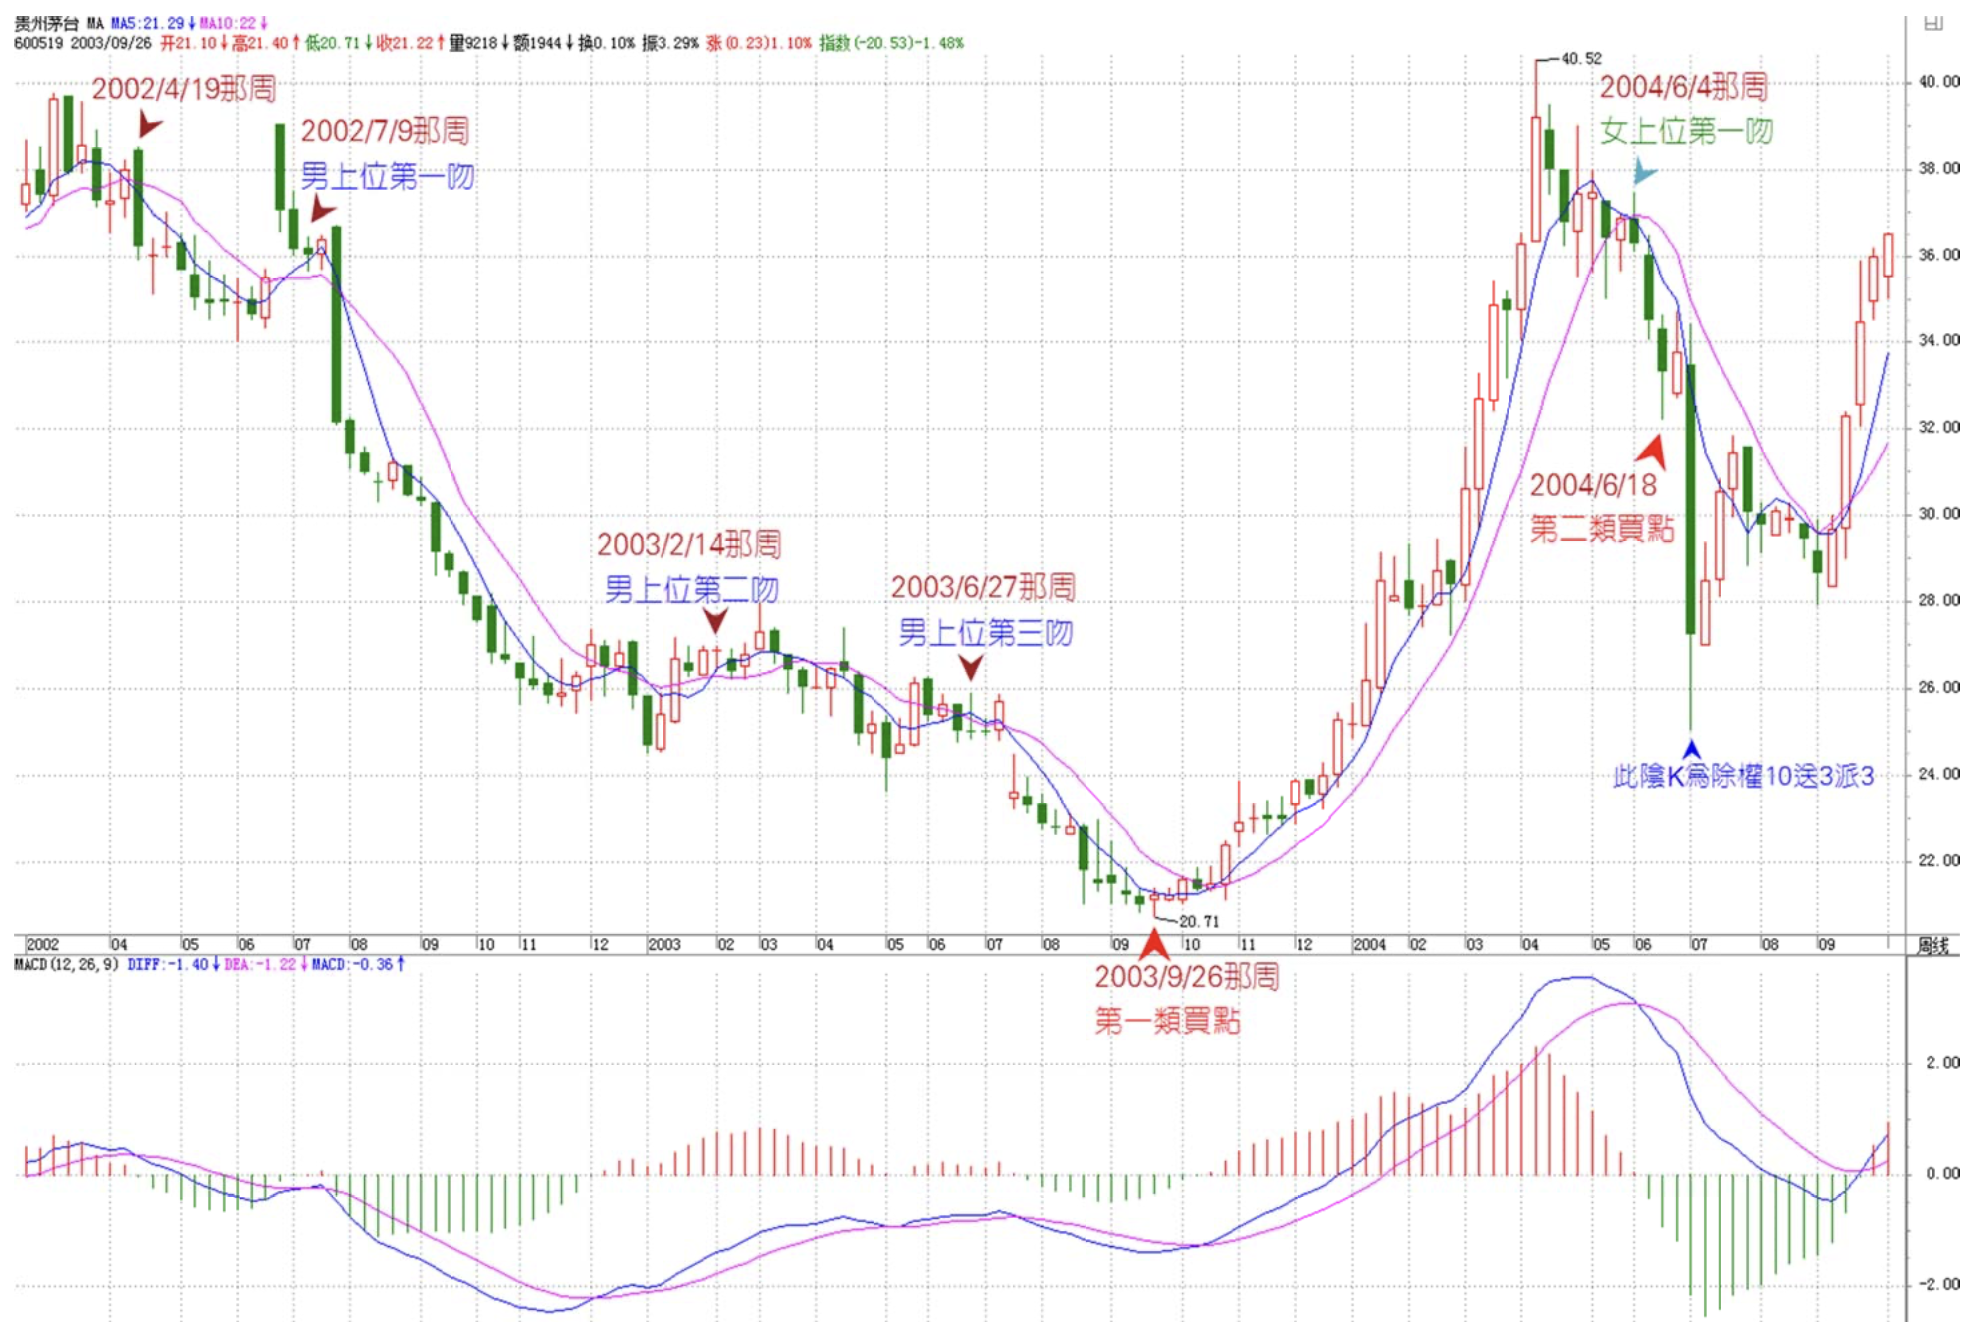
After the first-type buy point appeared, Moutai naturally changed position, entering female-on-top, all the way until the week of June 4, 2004, when the first kiss after female-on-top appeared. The subsequent pullback formed the second-type buy point on the weekly chart. There's a very important technique here: how to precisely capture the second-type buy point. Since the adjustment after the first kiss in the weekly female-on-top doesn't form an obvious downward trend, the divergence approach for the first-type buy point cannot occur. In this case, you need to lower the candlestick level and look for the optimal buy point on the daily chart. Here I present a Chan Buy Point Theorem: A higher-level second-type buy point is formed by the first-type buy point of the corresponding next-lower-level movement (this theorem is patented, and the inventor's rights must be clearly attributed—this point must be made clear, otherwise this ID will never state any more theorems. This theorem has definitely never been discovered by anyone else. The same goes for other theorems this ID has discovered—I'll share a few more when I'm in a good mood someday, but on the condition that no piracy is discovered. Everyone should also help this ID monitor for piracy). For example, the weekly second-type buy point is formed by the daily first-type buy point of the corresponding movement. With this Chan Buy Point Theorem, all buy points can be reduced to first-type buy points.
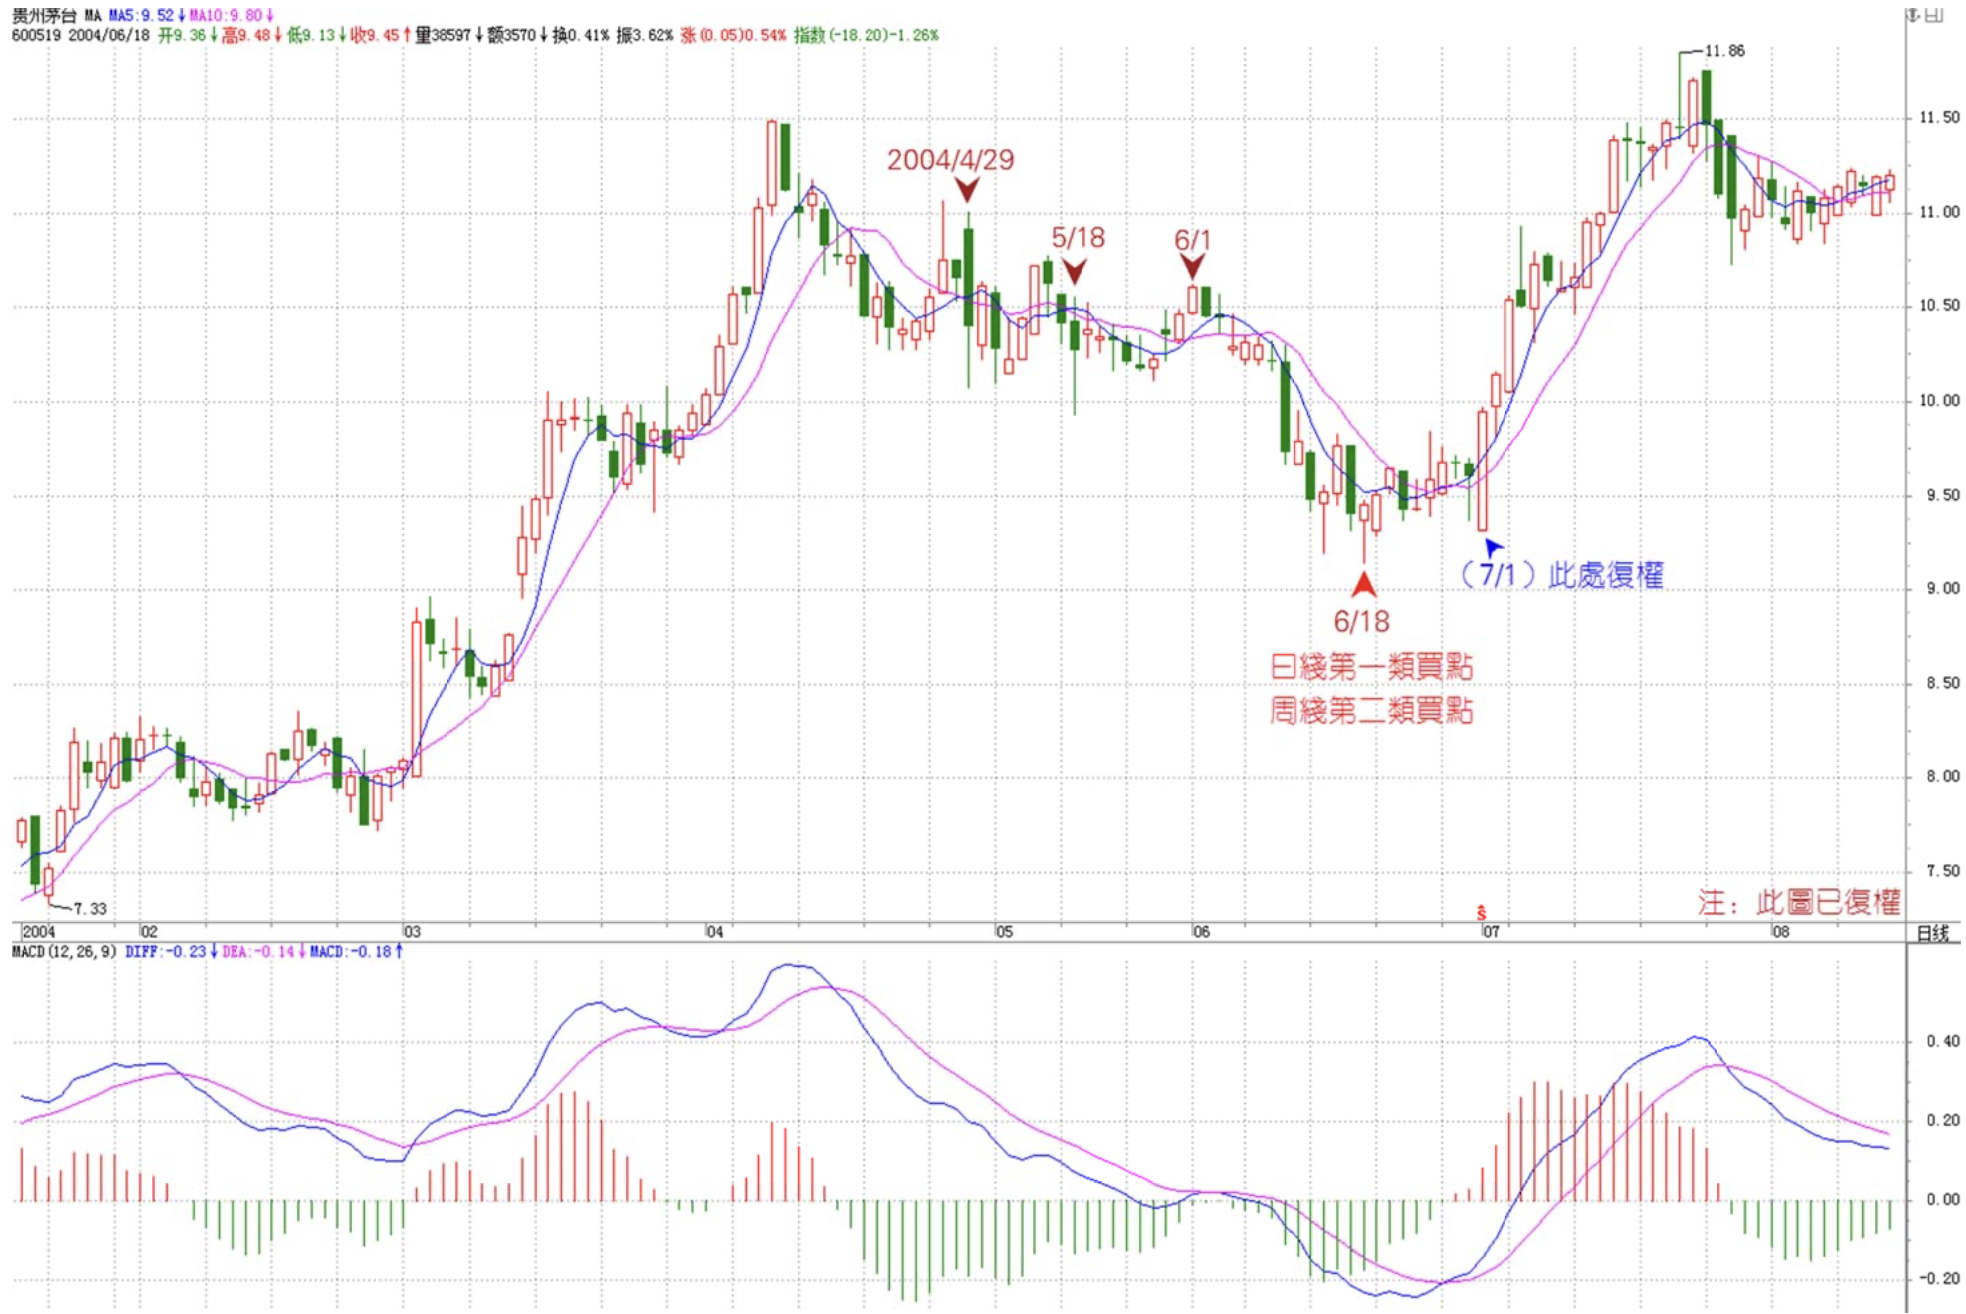
For Moutai, the week of June 4, 2004 saw the first kiss after female-on-top. On the daily chart, this corresponds to an obvious male-on-top movement. This movement produced three kisses, on April 29, May 18, and June 1, 2004, all classic wet kisses. But the declines after the first two didn't produce divergence—only the third one showed obvious divergence. After creating the low on June 18, the MACD green bars were noticeably shorter than before, forming the first-type buy point on the daily chart. This buy point corresponds to the second-type buy point on the weekly chart. Note that later, due to ex-rights adjustment, the price level appears lower, but it actually wasn't.
From the weekly perspective, Moutai had only these two buy points, and no sell point has appeared since. If you entered based on these two buy points back then, you should continue holding until a sell point appears. However, this is a strategy for extremely large capital—say, 5 billion or more. For relatively smaller capital—say, under 1 billion—there's a way to increase capital liquidity: make full use of daily sell points to avoid major corrections that, from the weekly perspective, don't necessarily require participation. The Chan Short-Swing Program is: for positions entered at higher-level buy points, when a next-lower-level first-type sell point appears, you can reduce positions first, then add back when the next-lower-level first-type buy point appears. For positions entered at weekly buy points, you should use daily first-type sell points to reduce positions and daily first-type buy points to add back. For Moutai, the analysis is as follows:
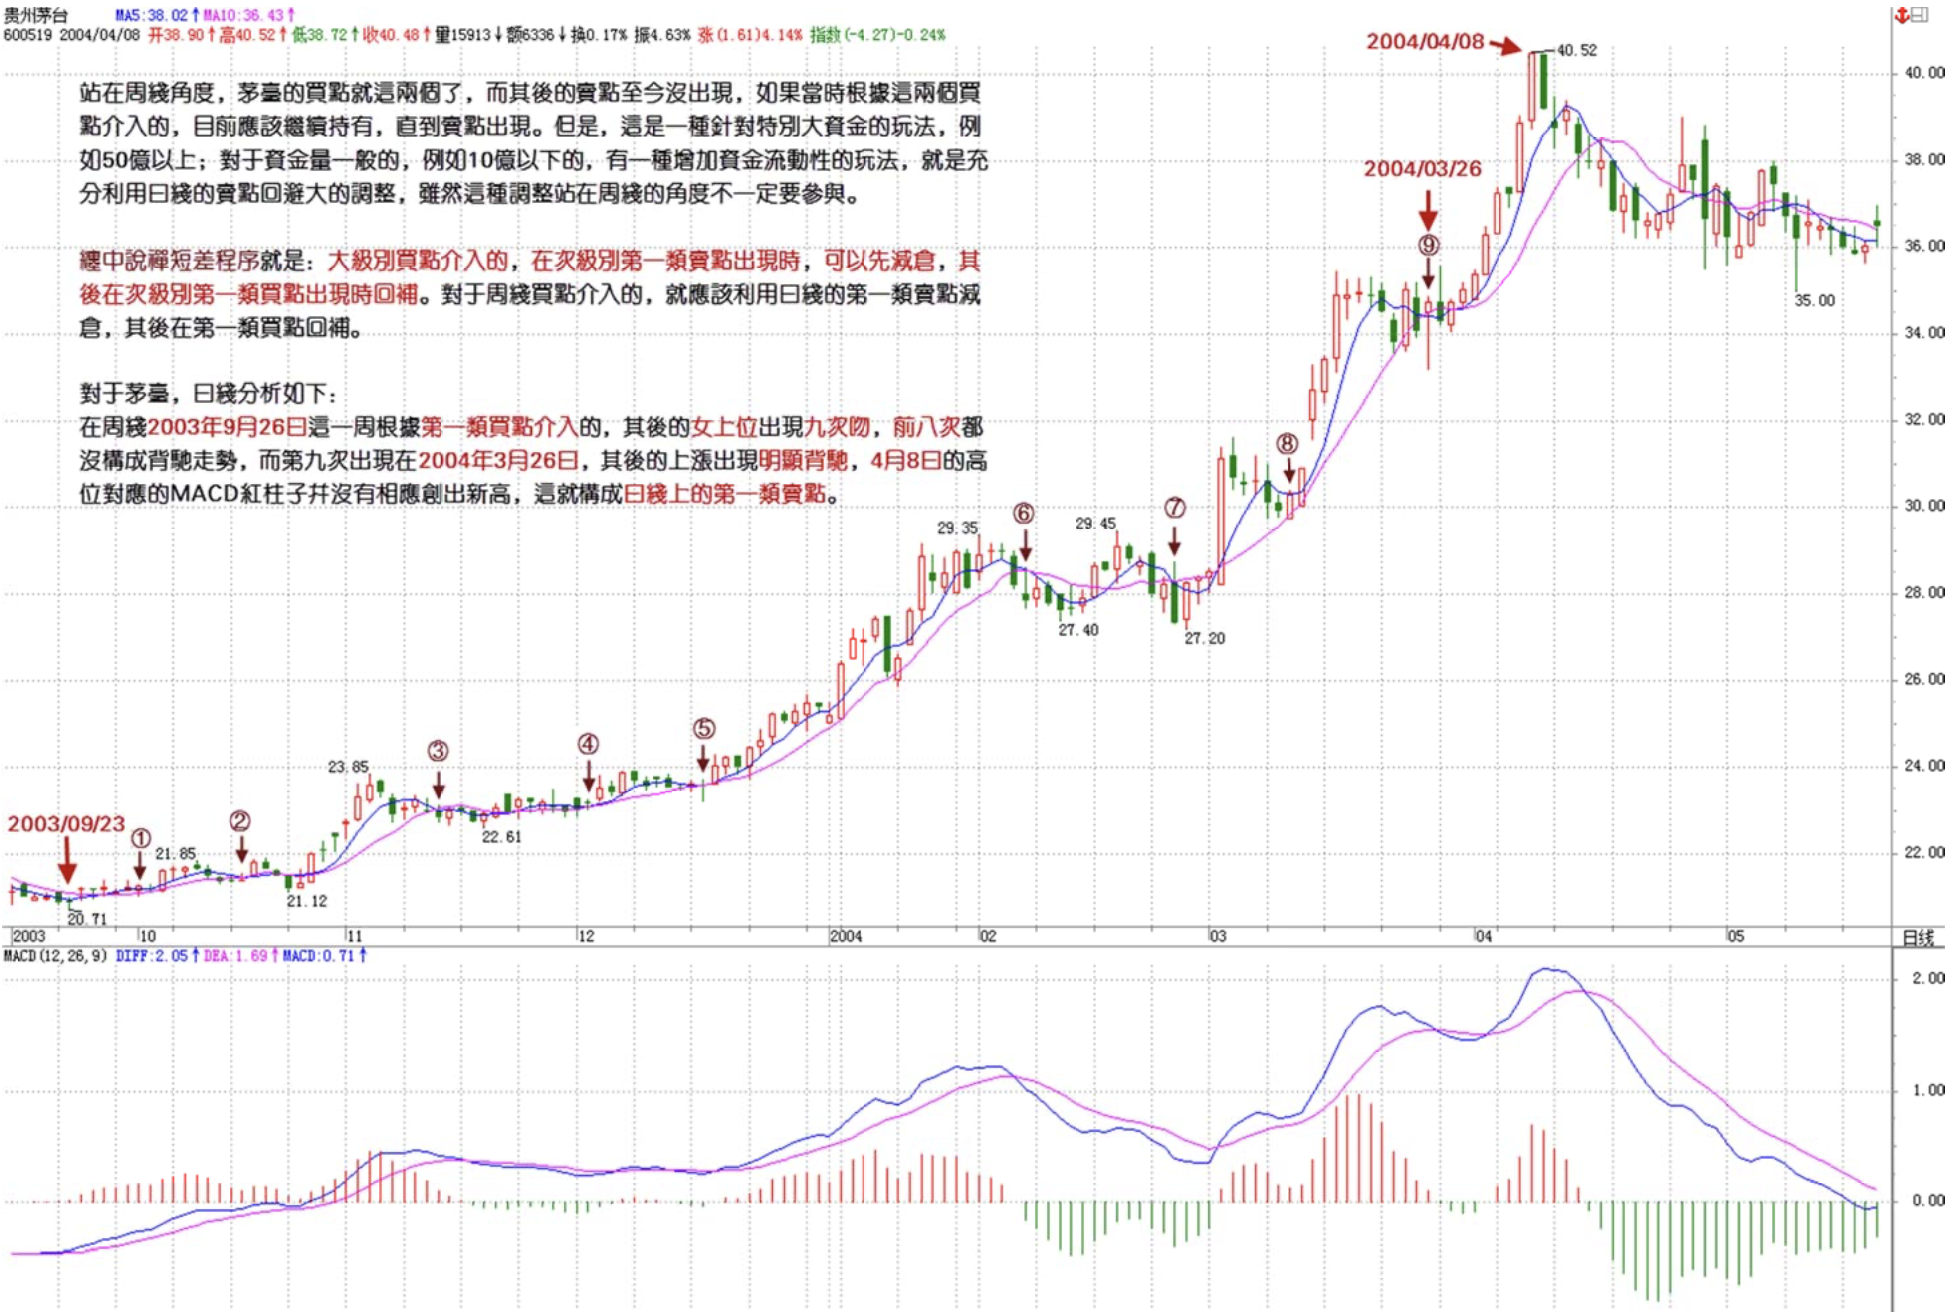
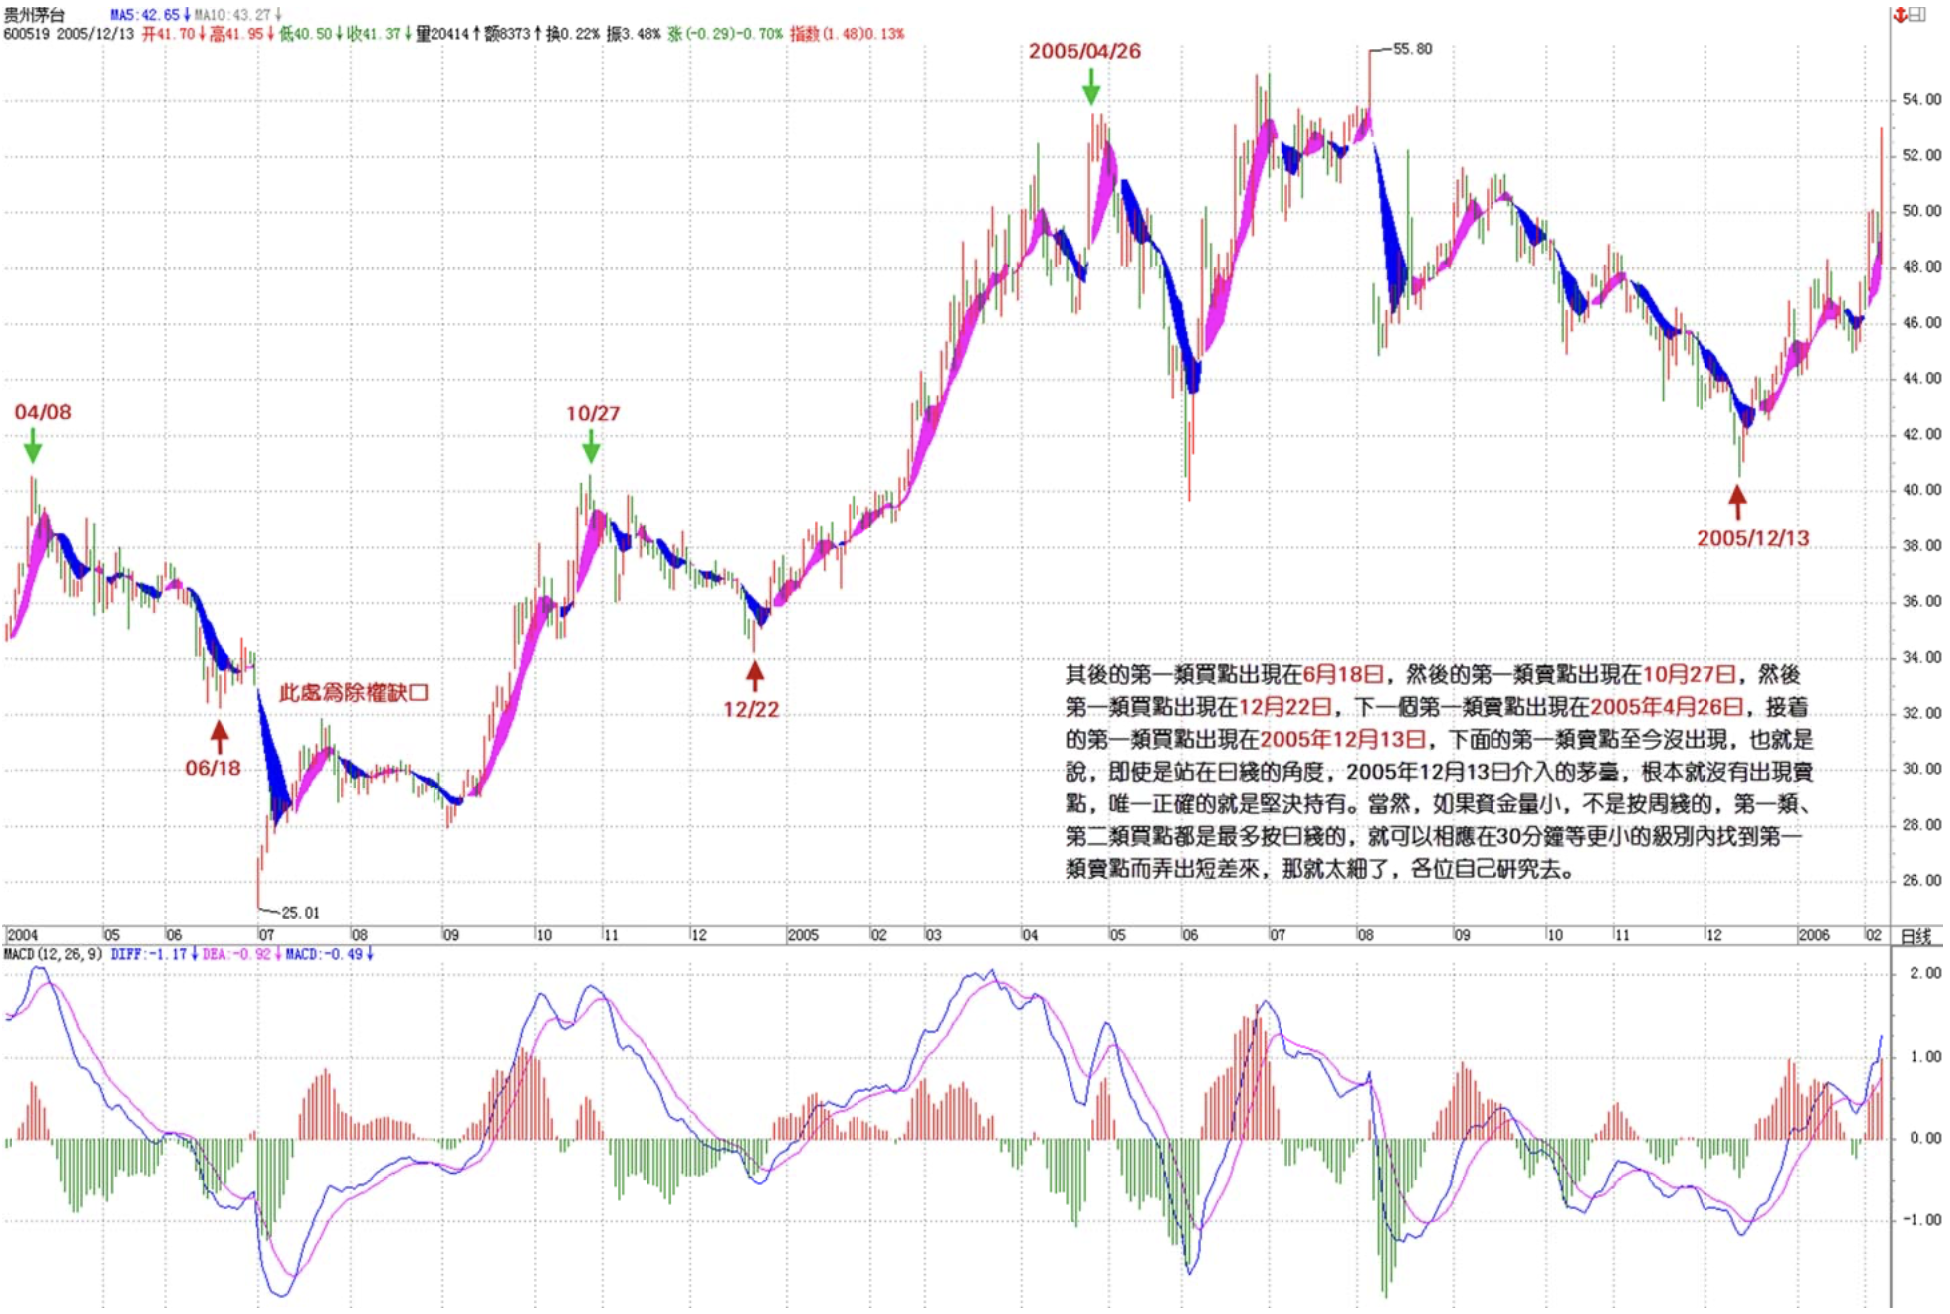
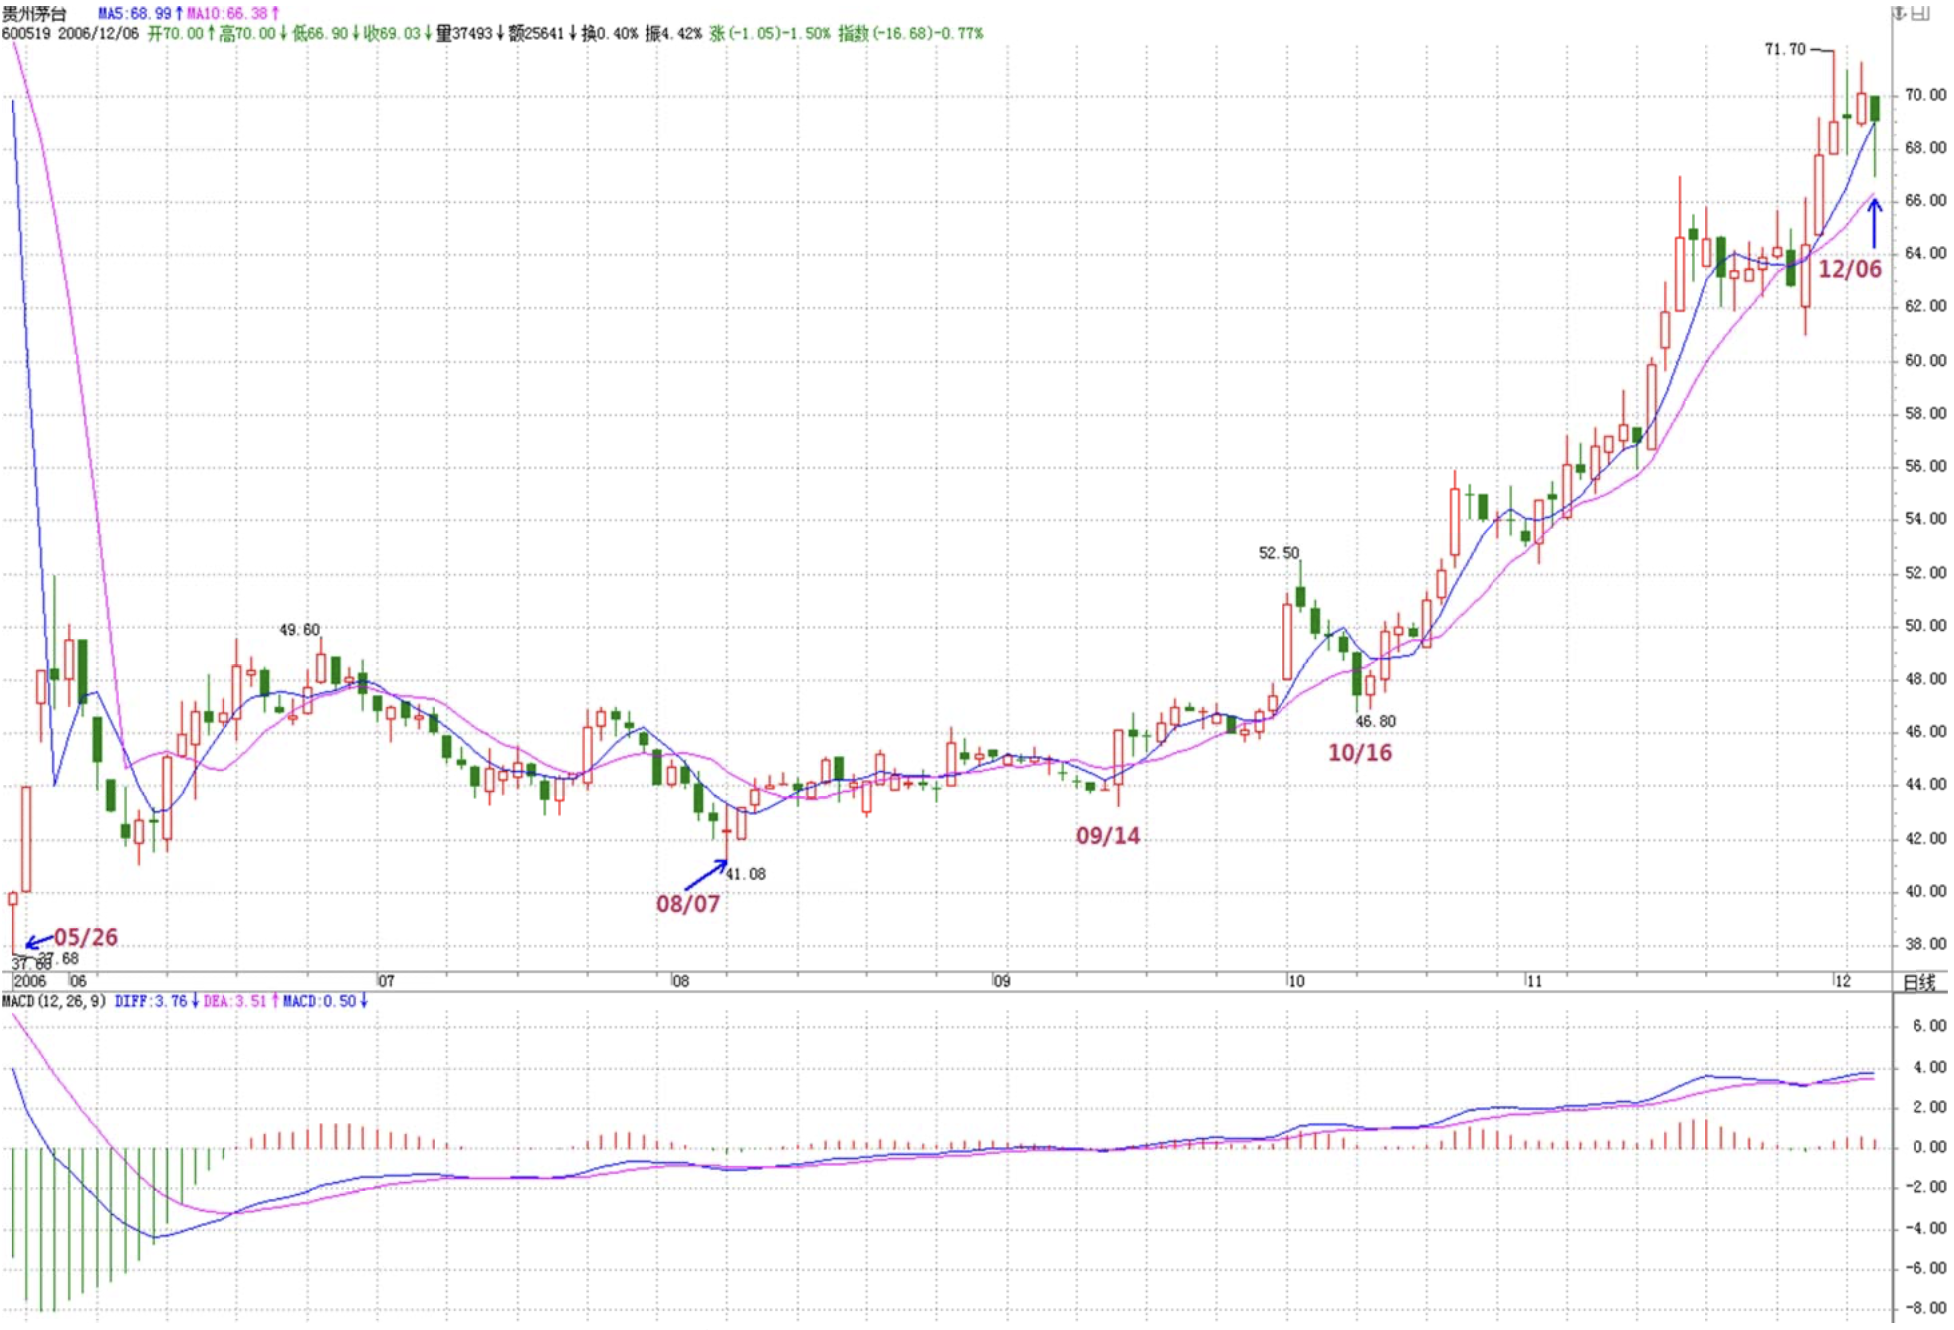
For positions entered based on the first-type buy point the week of September 26, 2003, the subsequent female-on-top produced nine kisses. The first eight didn't form divergence, while the ninth appeared on March 26, 2004. The subsequent rise showed obvious divergence—the MACD red bars at the April 8 high didn't correspondingly make new highs, forming the first-type sell point on the daily chart. The subsequent first-type buy point appeared on June 18, then the next first-type sell point on October 27, then the first-type buy point on December 22, the next first-type sell point on April 26, 2005, then the first-type buy point on December 13, 2005. The next first-type sell point hasn't appeared yet—meaning even from the daily perspective, Moutai entered on December 13, 2005 has shown no sell point whatsoever. The only correct action is to resolutely hold. Of course, if your capital is small and you're not operating on the weekly level—with both first-type and second-type buy points being at most on the daily level—you can find first-type sell points at even smaller levels like 30-minute charts to create short swings, but that's too detailed. Research it yourselves.
To master this moving-average-based buy/sell system, you must deeply understand the Chan Buy Point Theorem: a higher-level second-type buy point is formed by the first-type buy point of the corresponding next-lower-level movement. If your capital isn't extremely large, you should master the Chan Short-Swing Program: for positions entered at higher-level buy points, when a next-lower-level first-type sell point appears, reduce positions first, then add back when the next-lower-level first-type buy point appears. This is how you improve capital utilization. Note: both the theorem and program require copyright awareness. Anyone can use them, and no royalties are charged, but this copyright must be made clear—otherwise this ID will lose interest in sharing any more theorems or programs. Severely punish all those who attempt to pirate and use them to deceive others. Everyone should study charts extensively, determine your own operational level based on your capital size and personality, then practice until proficient—otherwise it's all armchair theorizing, completely meaningless.
Replies
缠中说禅 2006/12/5 12:04:22
Note: this ID has never joined any other circle. Any circle joined in this ID's name has nothing to do with this ID. This ID has also discovered that there is a blog on Sina with the exact same name as this ID, but with a different address. So everyone please be careful and don't confuse them.
This ID only has the one circle just established. This circle welcomes everyone to post their articles for mutual exchange. Apart from that, everything else has nothing to do with this ID. This is hereby declared.
缠中说禅 2006/12/5 12:06:44
[Anonymous] 外科医生
2006-12-05 11:58:23
Little sis, how do we judge the upcoming correction?
I'm too dumb, hehe
Studying hard
===========
Fiercer than the last one, but no mid-term issue. Those that haven't risen will take the opportunity to launch. After second-tier stocks come third-tier stocks—grasp this rhythm.
缠中说禅 2006/12/5 12:08:56
[Anonymous] 听禅
2006-12-05 11:56:43
The 5-day and 10-day moving averages on the daily chart of 000685 have kissed. Is it worth a try?
===========
Study this post carefully. Once you truly understand it, you'll be better than at least 95% of people in the market.
缠中说禅 2006/12/5 12:09:36
Seeking Happiness
2006-12-05 12:08:37
Too profound, can't understand.
==
Find Moutai's chart yourself and read along with it. Very simple.
缠中说禅 2006/12/5 12:13:42
Xiao Ming
2006-12-05 12:10:46
Blogger, 600183 is also a second-tier blue chip—why hasn't it moved yet?
Third-tier stocks are almost up next. Won't it be left behind?
==========
Classic manipulated stock. It'll rise when the market maker is in the mood.
缠中说禅 2006/12/5 12:16:06
[Anonymous] 外科医生
2006-12-05 12:10:50
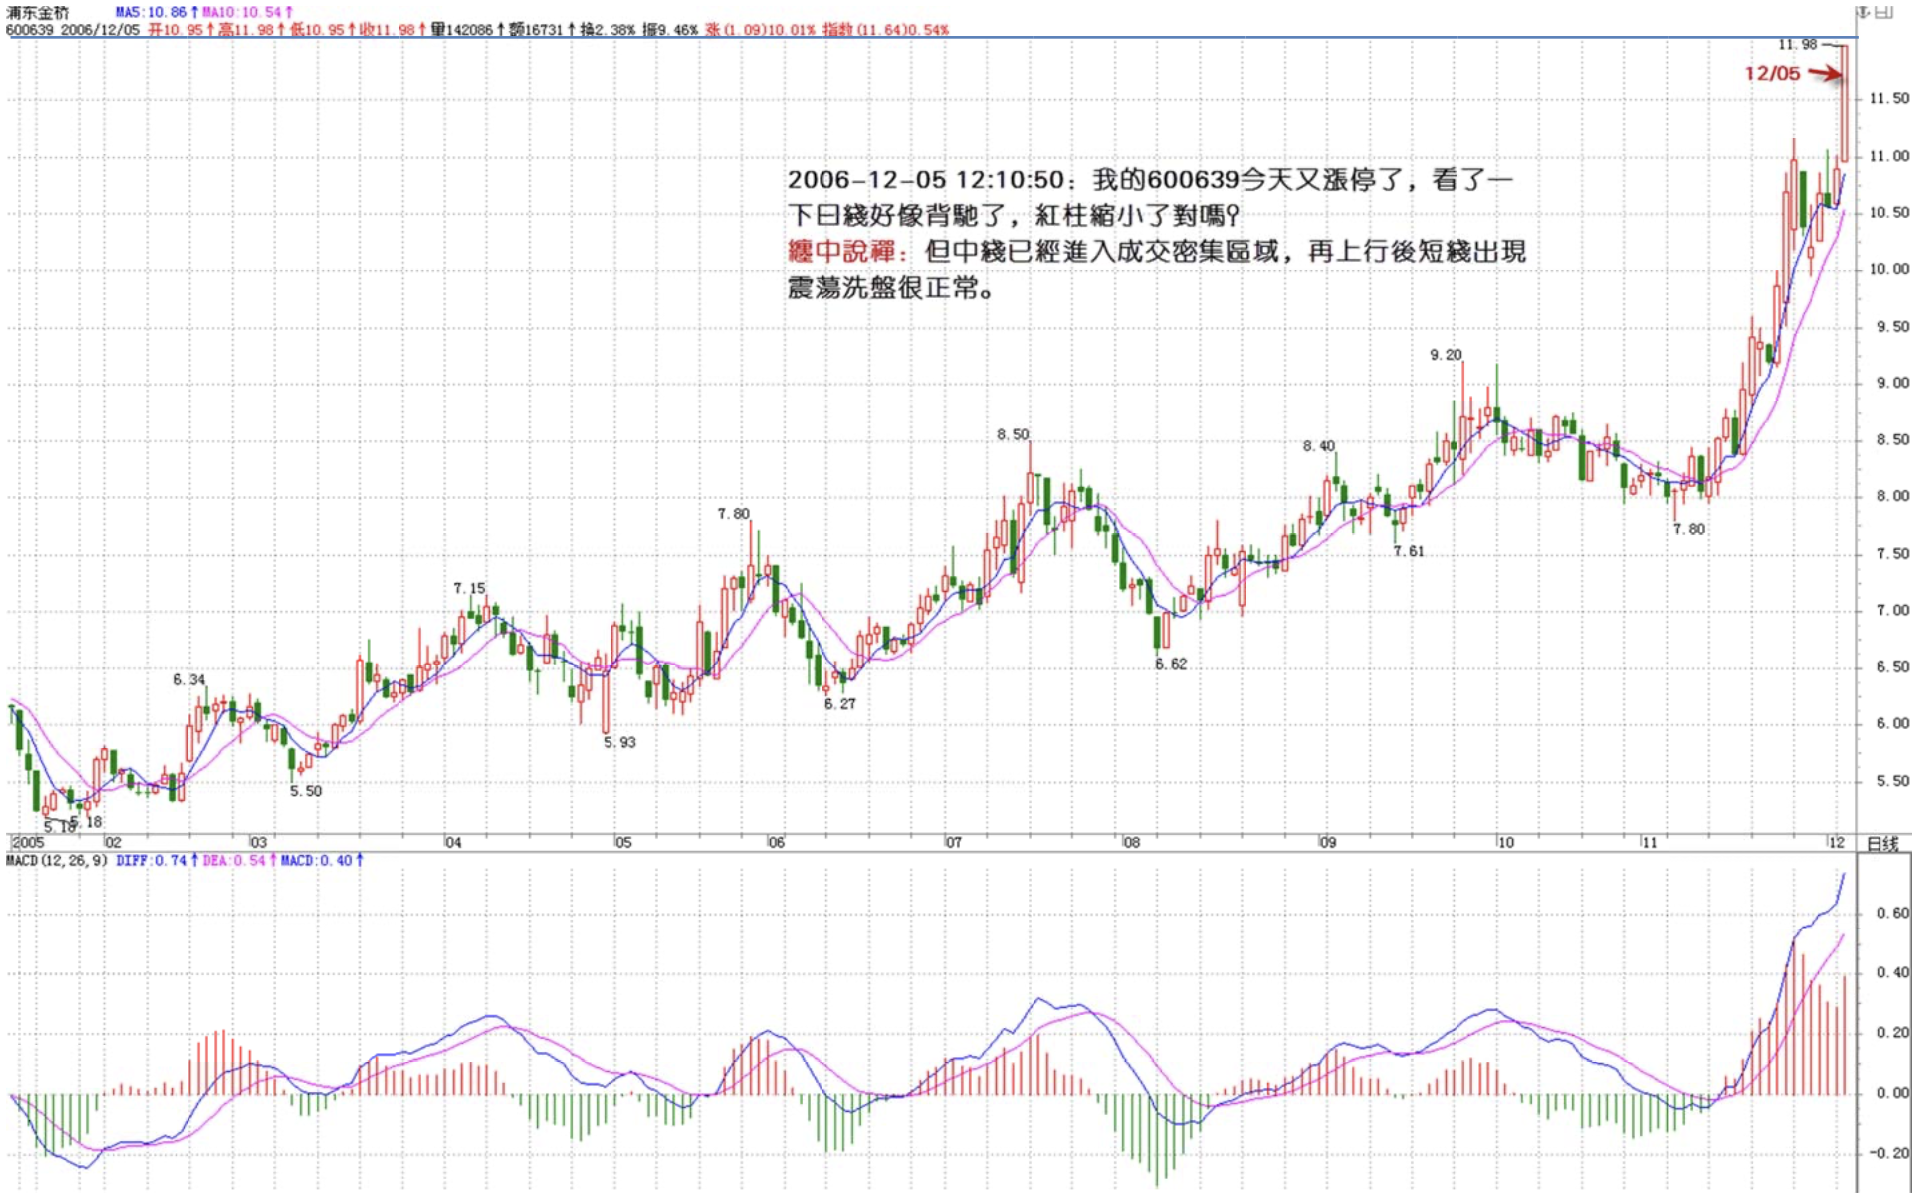
My 600639 hit the limit up again today. Looking at the daily chart, it seems like divergence—the red bars are getting shorter, right?
=============
No.
缠中说禅 2006/12/5 12:19:26
[Anonymous] 外科医生
2006-12-05 12:10:50
My 600639 hit the limit up again today. Looking at the daily chart, it seems like divergence—the red bars are getting shorter, right?
===========
But in the medium term, it has already entered a volume-dense zone. Short-term consolidation and shakeout after further advance would be normal.
缠中说禅 2006/12/5 12:23:04
Xiao Ming
2006-12-05 12:17:51
"Study this post carefully. Once you truly understand it, you'll be better than at least 95% of people in the market."
=====================
Chan mm, are you serious? If so, then I'd better study it thoroughly. But I always feel that for small-cap stocks, this isn't very effective. For large-cap blue chips, it's quite effective. I'm now prepared to be honest and just buy large-cap blue chips. No more chasing hot stocks or explosive gainers. Is this right?
============
First study it carefully—how will you truly understand and apply it without studying? Don't limit your thinking to one scope. It's only during the first phase of a bull market that component stocks dominate. In the second phase, things change. Practice "bu huan er huan" (non-anxiety yet anxiety)—study the Analects.
缠中说禅 2006/12/5 12:25:25
[Anonymous] 妄语
2006-12-05 12:18:29
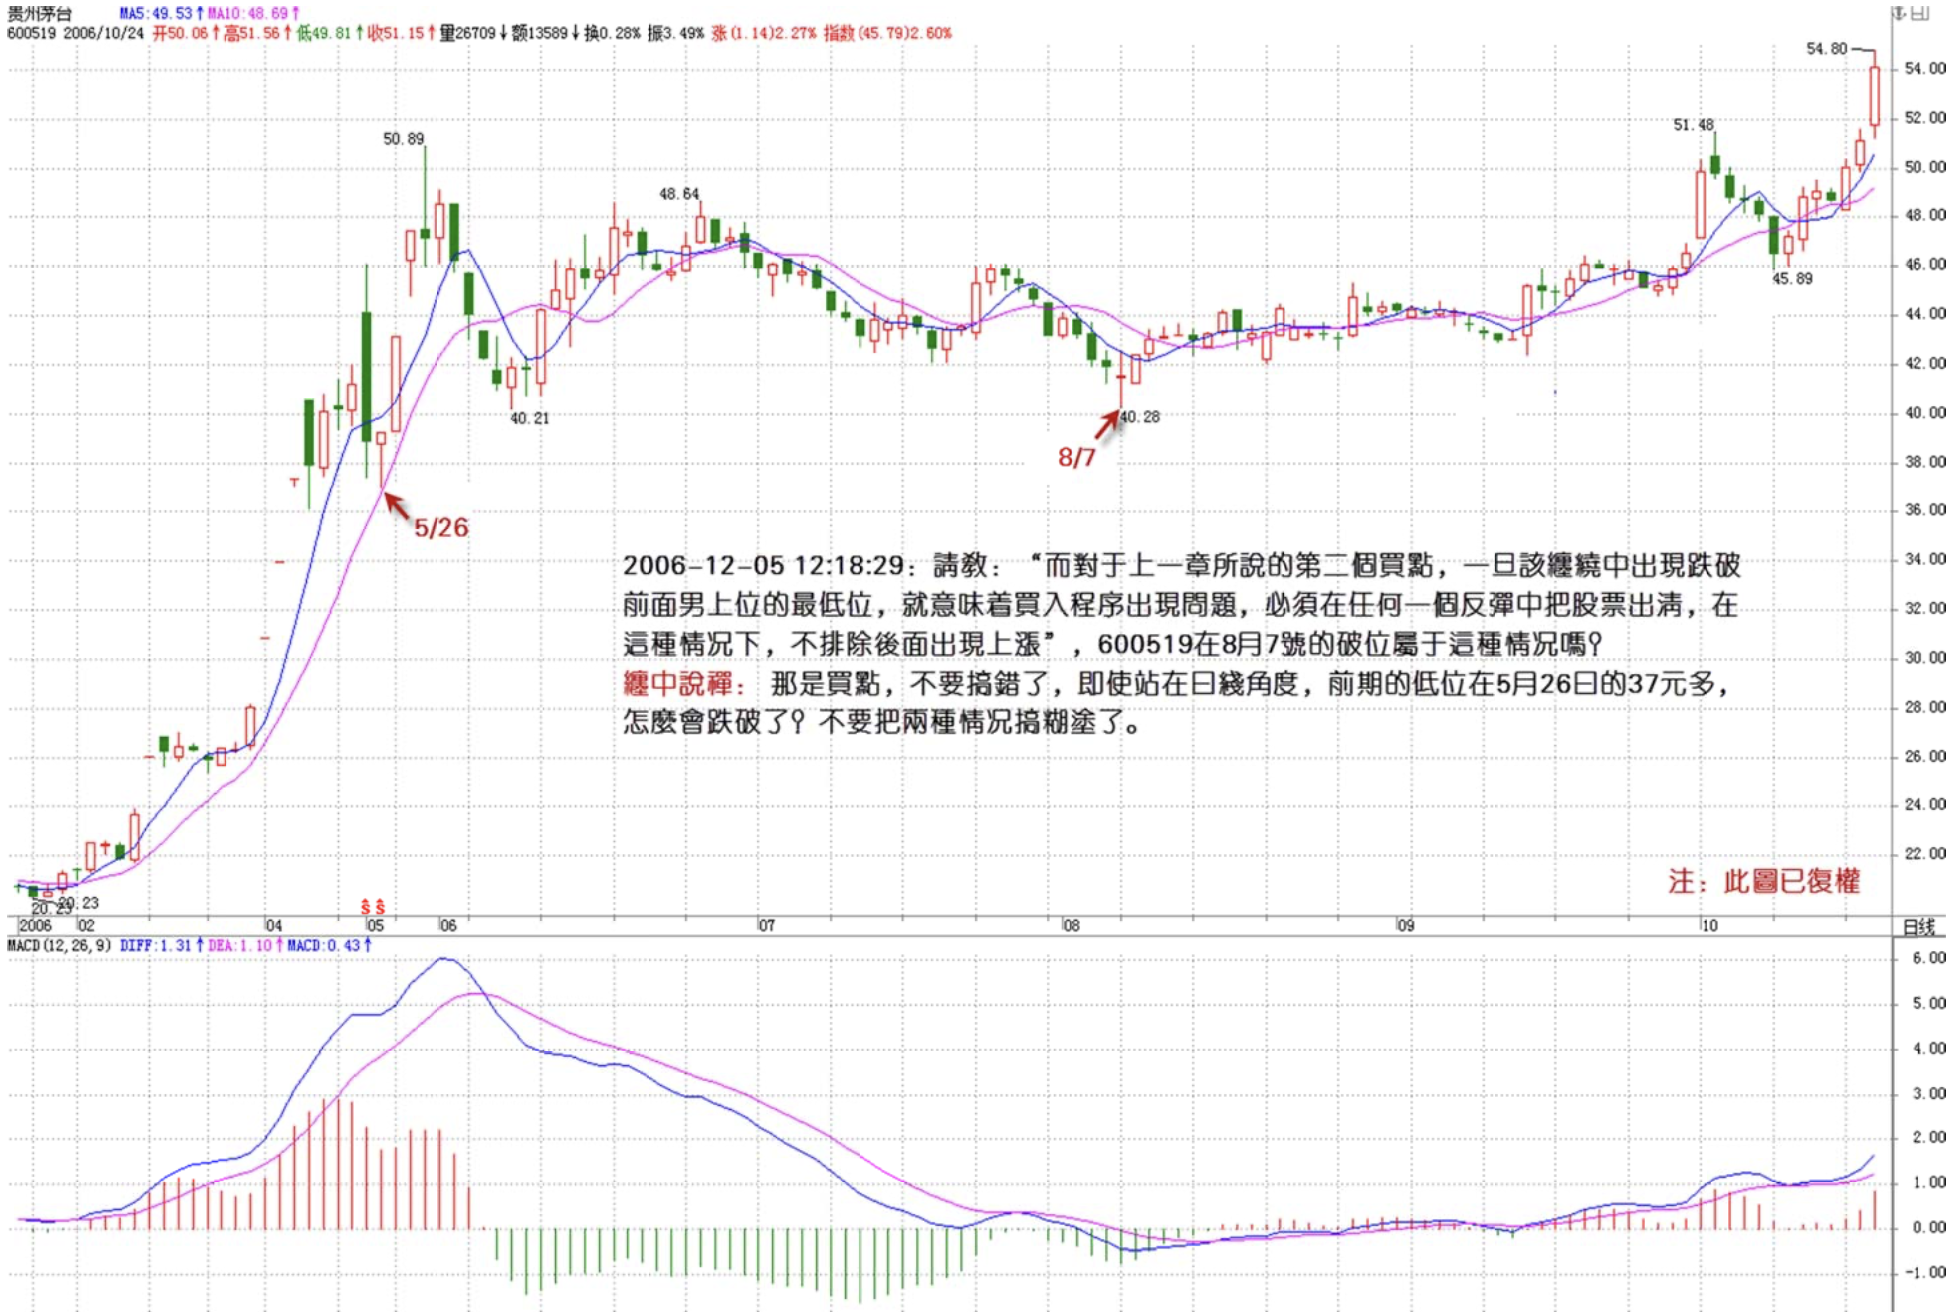
May I ask: "For the second buy point described in the previous chapter, once the entanglement breaks below the lowest point of the preceding male-on-top position, it means the buying program has a problem, and you must clear all shares on any rebound." Does the break on August 7 for 600519 fall under this situation?
=========
That was a buy point—don't confuse things. Even from the daily perspective, the previous low was at 37-something on May 26. How was it broken? Don't mix up the two situations.
缠中说禅 2006/12/5 12:39:31
[Anonymous] 外科医生
2006-12-05 12:32:19
Does MACD have a lag?
Can you see it in real-time?
=============
Of course.
缠中说禅 2006/12/5 12:41:11
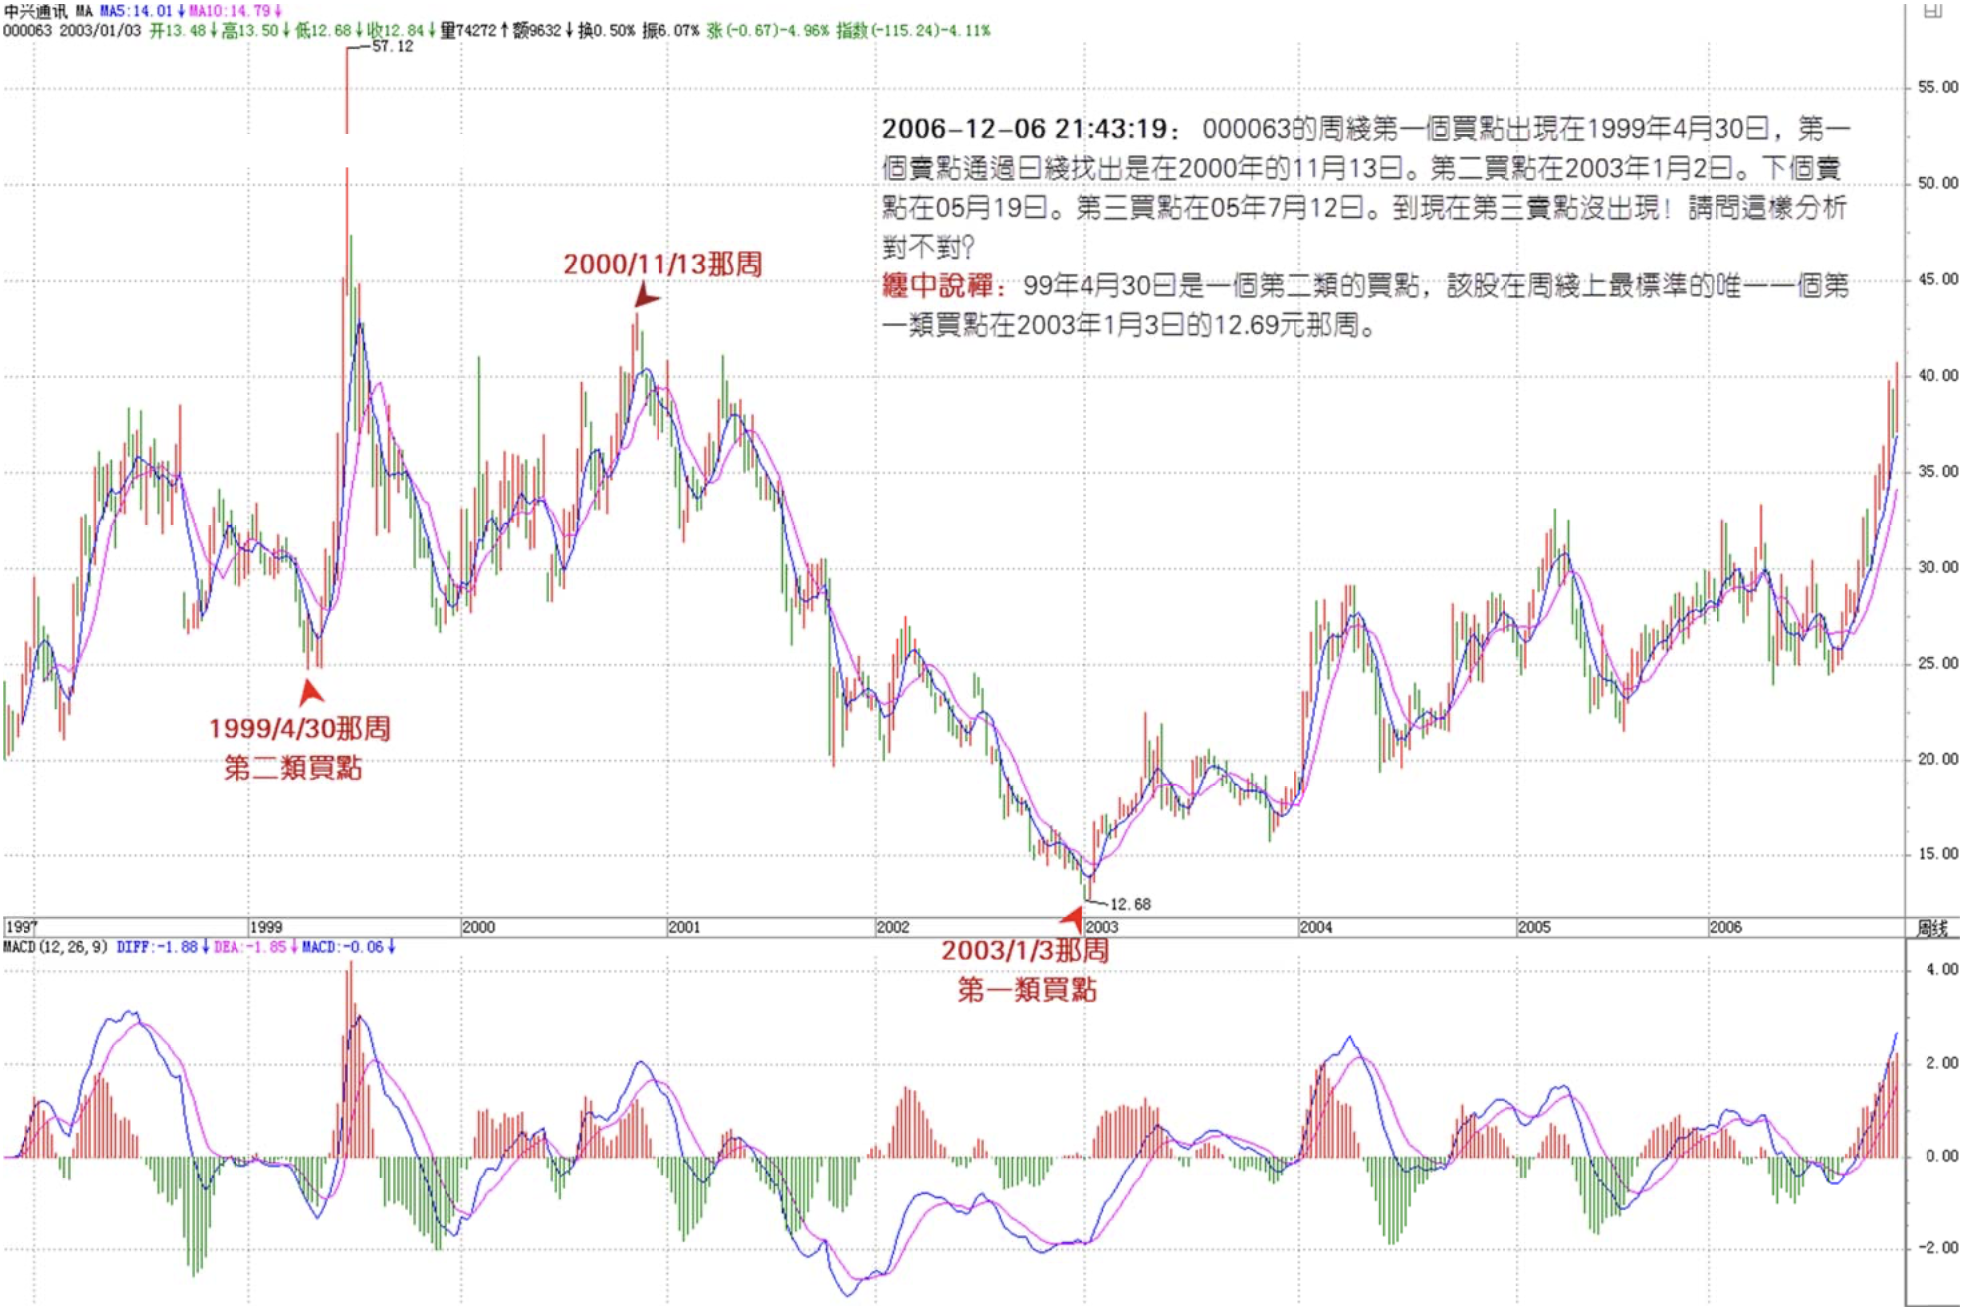
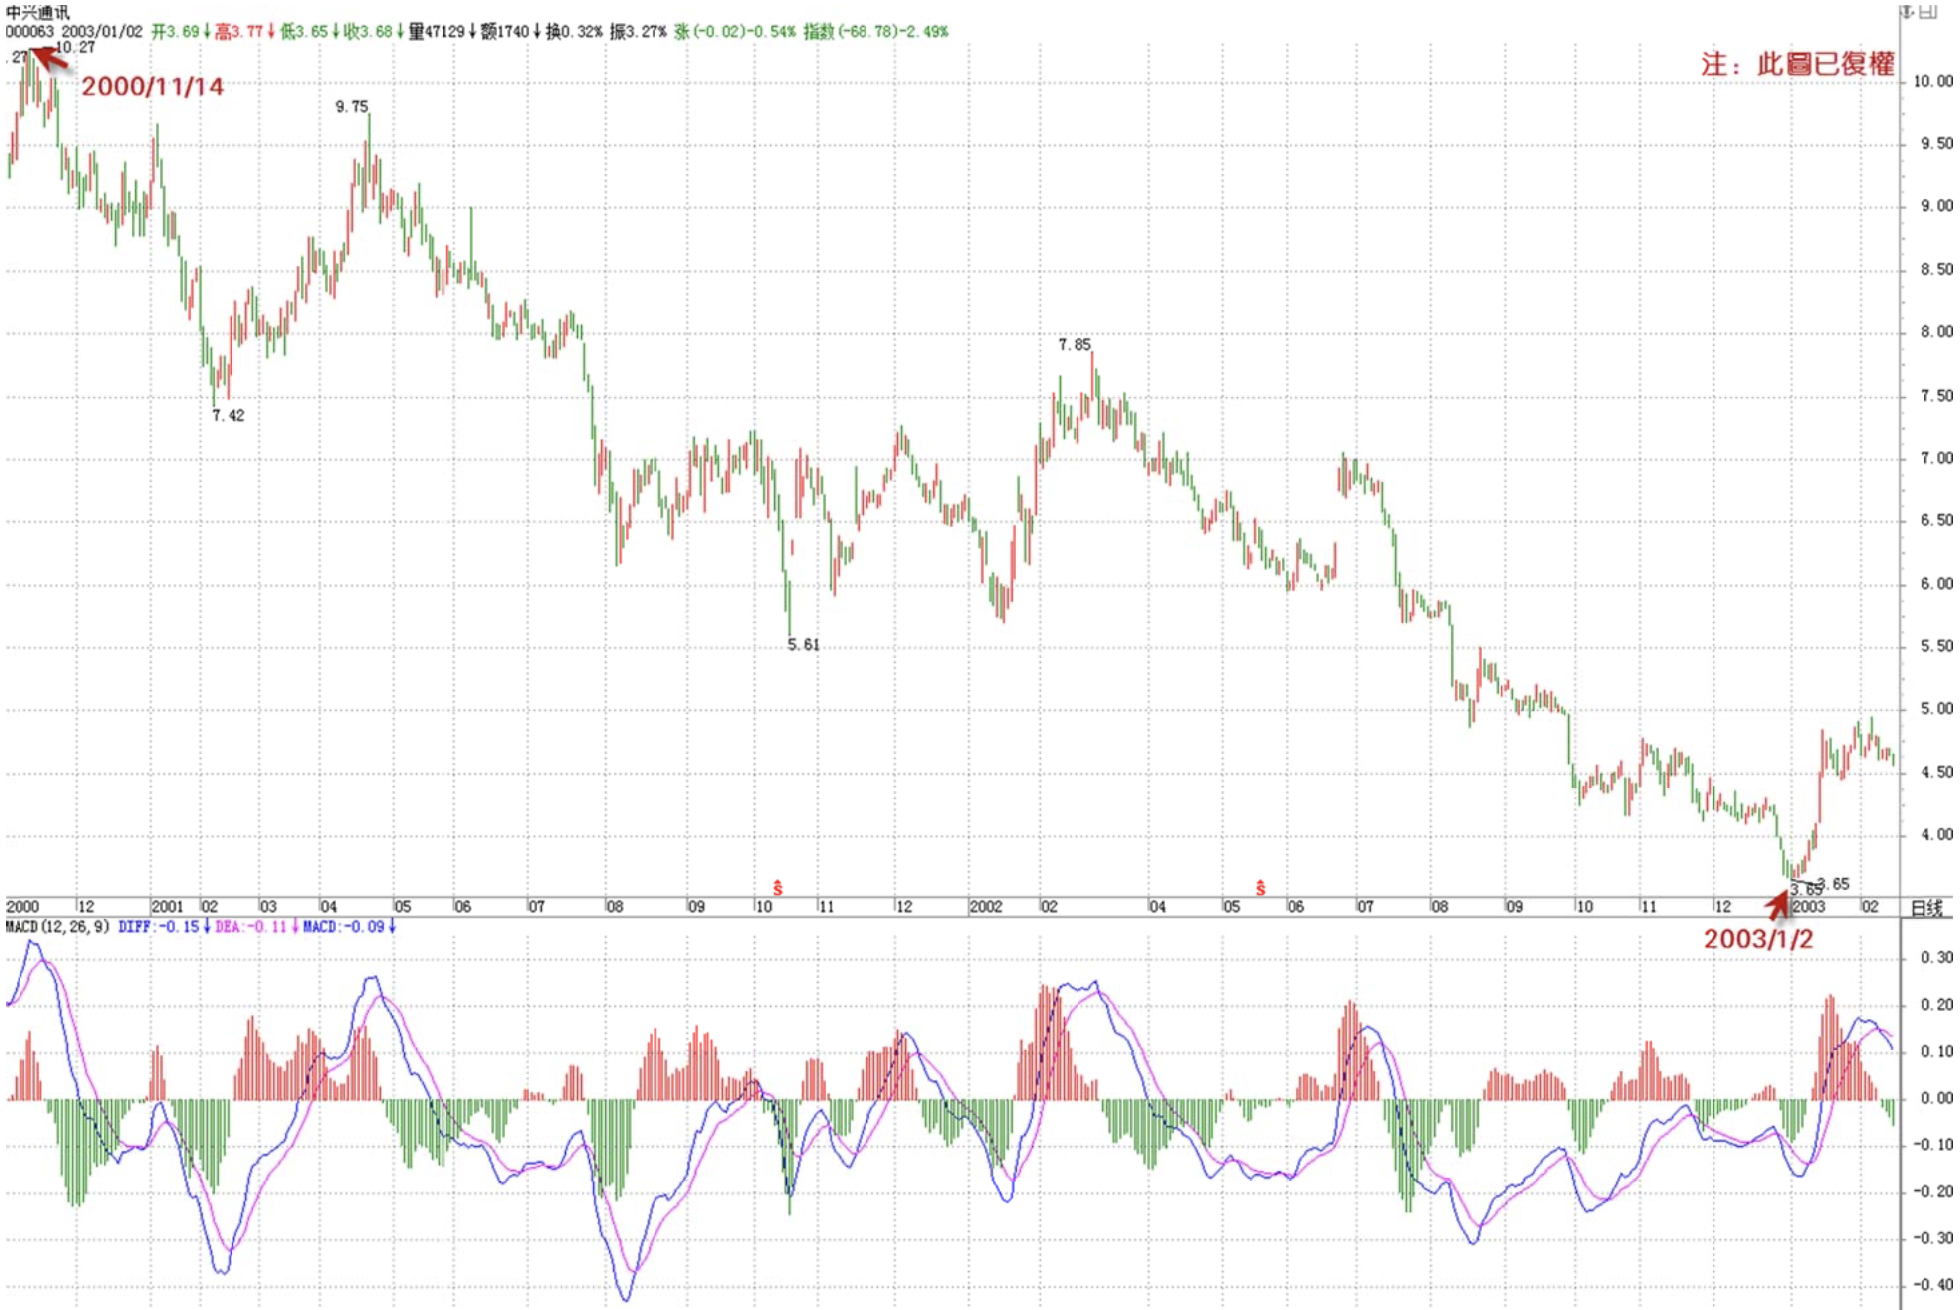
Here's an assignment:
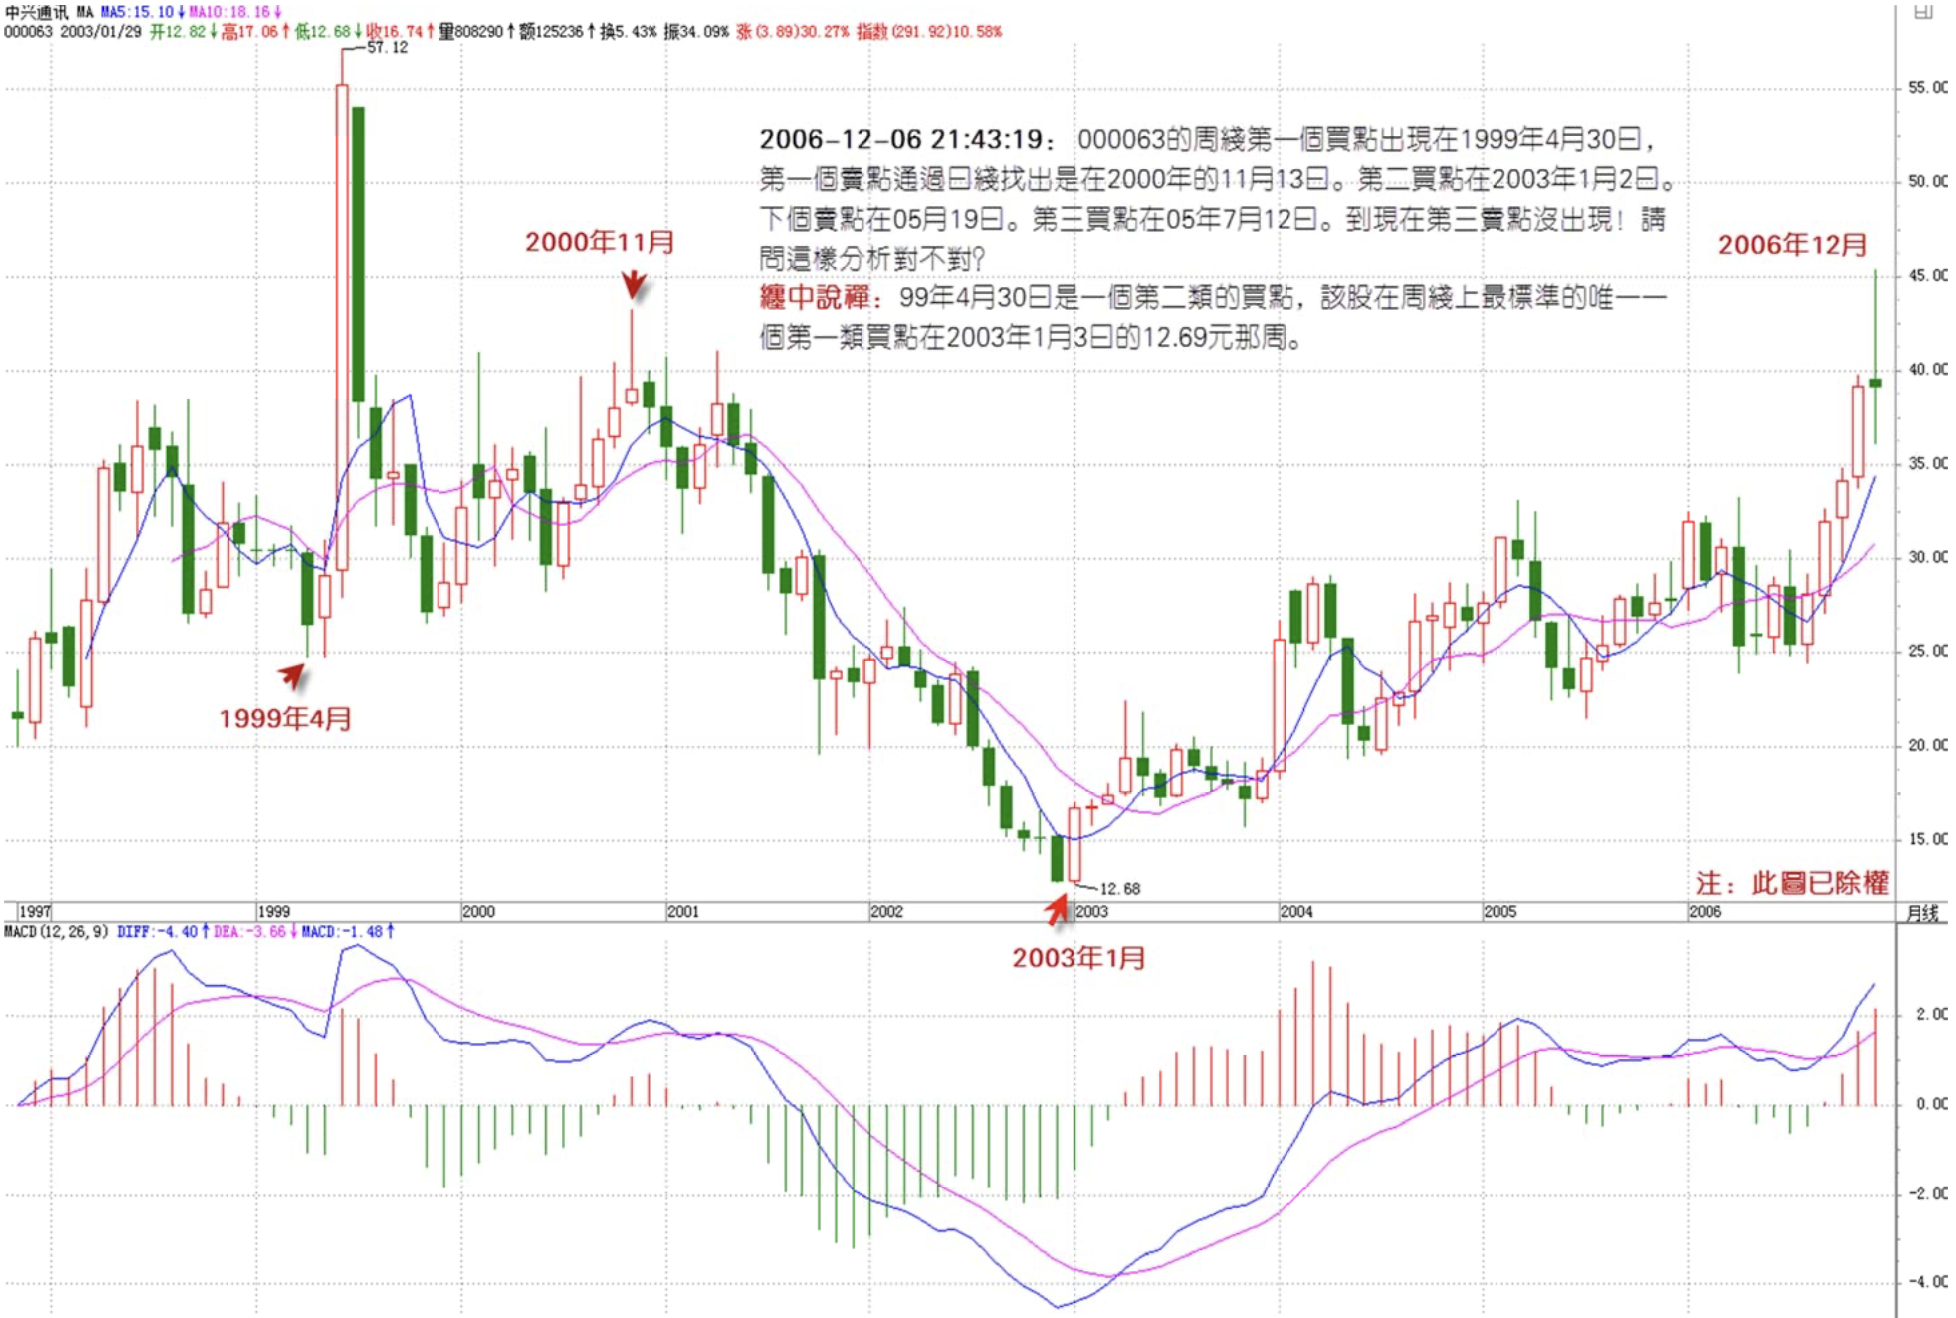
Analyze 000063 using the same method as for Moutai.
缠中说禅 2006/12/5 12:48:32
[Anonymous] 你的粉丝
2006-12-05 12:36:59
What about 000530? These past few trading days it only goes up one or two cents a day. How should I understand this?
============
Don't focus on unimportant information. Find your own solid harbor. Use the method above to analyze this stock from the weekly chart, and you'll know what it's doing in the medium term.
缠中说禅 2006/12/5 12:52:01
[Anonymous] 想飞的猪
2006-12-05 12:41:48
Stumbled into Chan Zen's territory by accident—feels like entering a temple of thought. Studying...
Thank you, Chan Zen, for your selfless sharing and careful guidance.
A question: the correction is inevitable. Facing the upcoming market correction, how should I handle second-tier blue chips that have already gained but are still promising in the medium term? Like 600787—its sell point position isn't obvious yet. Should I exit first or wait for my medium-term target price to sell?
Many tradeable stocks, from their chart patterns combined with your theory, don't seem to have clear sell points. Under such frantic market rallying, with the charts of a few index stocks like 600028 seemingly forming a top, how should I handle medium-term positions that are already profitable?
Thanks, Chan Zen!
============
The methods have all been told to you. Apply them flexibly:
Chan Short-Swing Program: for positions entered at higher-level buy points, when a next-lower-level first-type sell point appears, you can reduce positions first, then add back when the next-lower-level first-type buy point appears.
缠中说禅 2006/12/5 12:53:55
[Anonymous] CCTV
2006-12-05 12:52:59
Blogger, at least I support you. I can't control what others think.
=============
Thank you, but this ID allows all opinions to exist, as long as Sina doesn't delete them.
缠中说禅 2006/12/5 12:54:49
Market is opening, signing off for now. See you later.
缠中说禅 2006/12/5 13:46:42
Have to leave early. Won't be available this afternoon. Will come back online tonight. The following reminder remains valid:
Chán Zhōng Shuō Chán 2006-12-01 15:02:23
Technically, the gap left by the Shenzhen Component Index today is very important. If it's filled quickly, it sends a bad technical signal.
Next Monday will still need consolidation, but individual stock activity will continue. Since November was a massive bullish candle, a significant correction after an upward push in December is inevitable. This must be kept in mind.
缠中说禅 2006/12/5 21:56:43
[Anonymous] 你的粉丝
2006-12-05 12:56:56
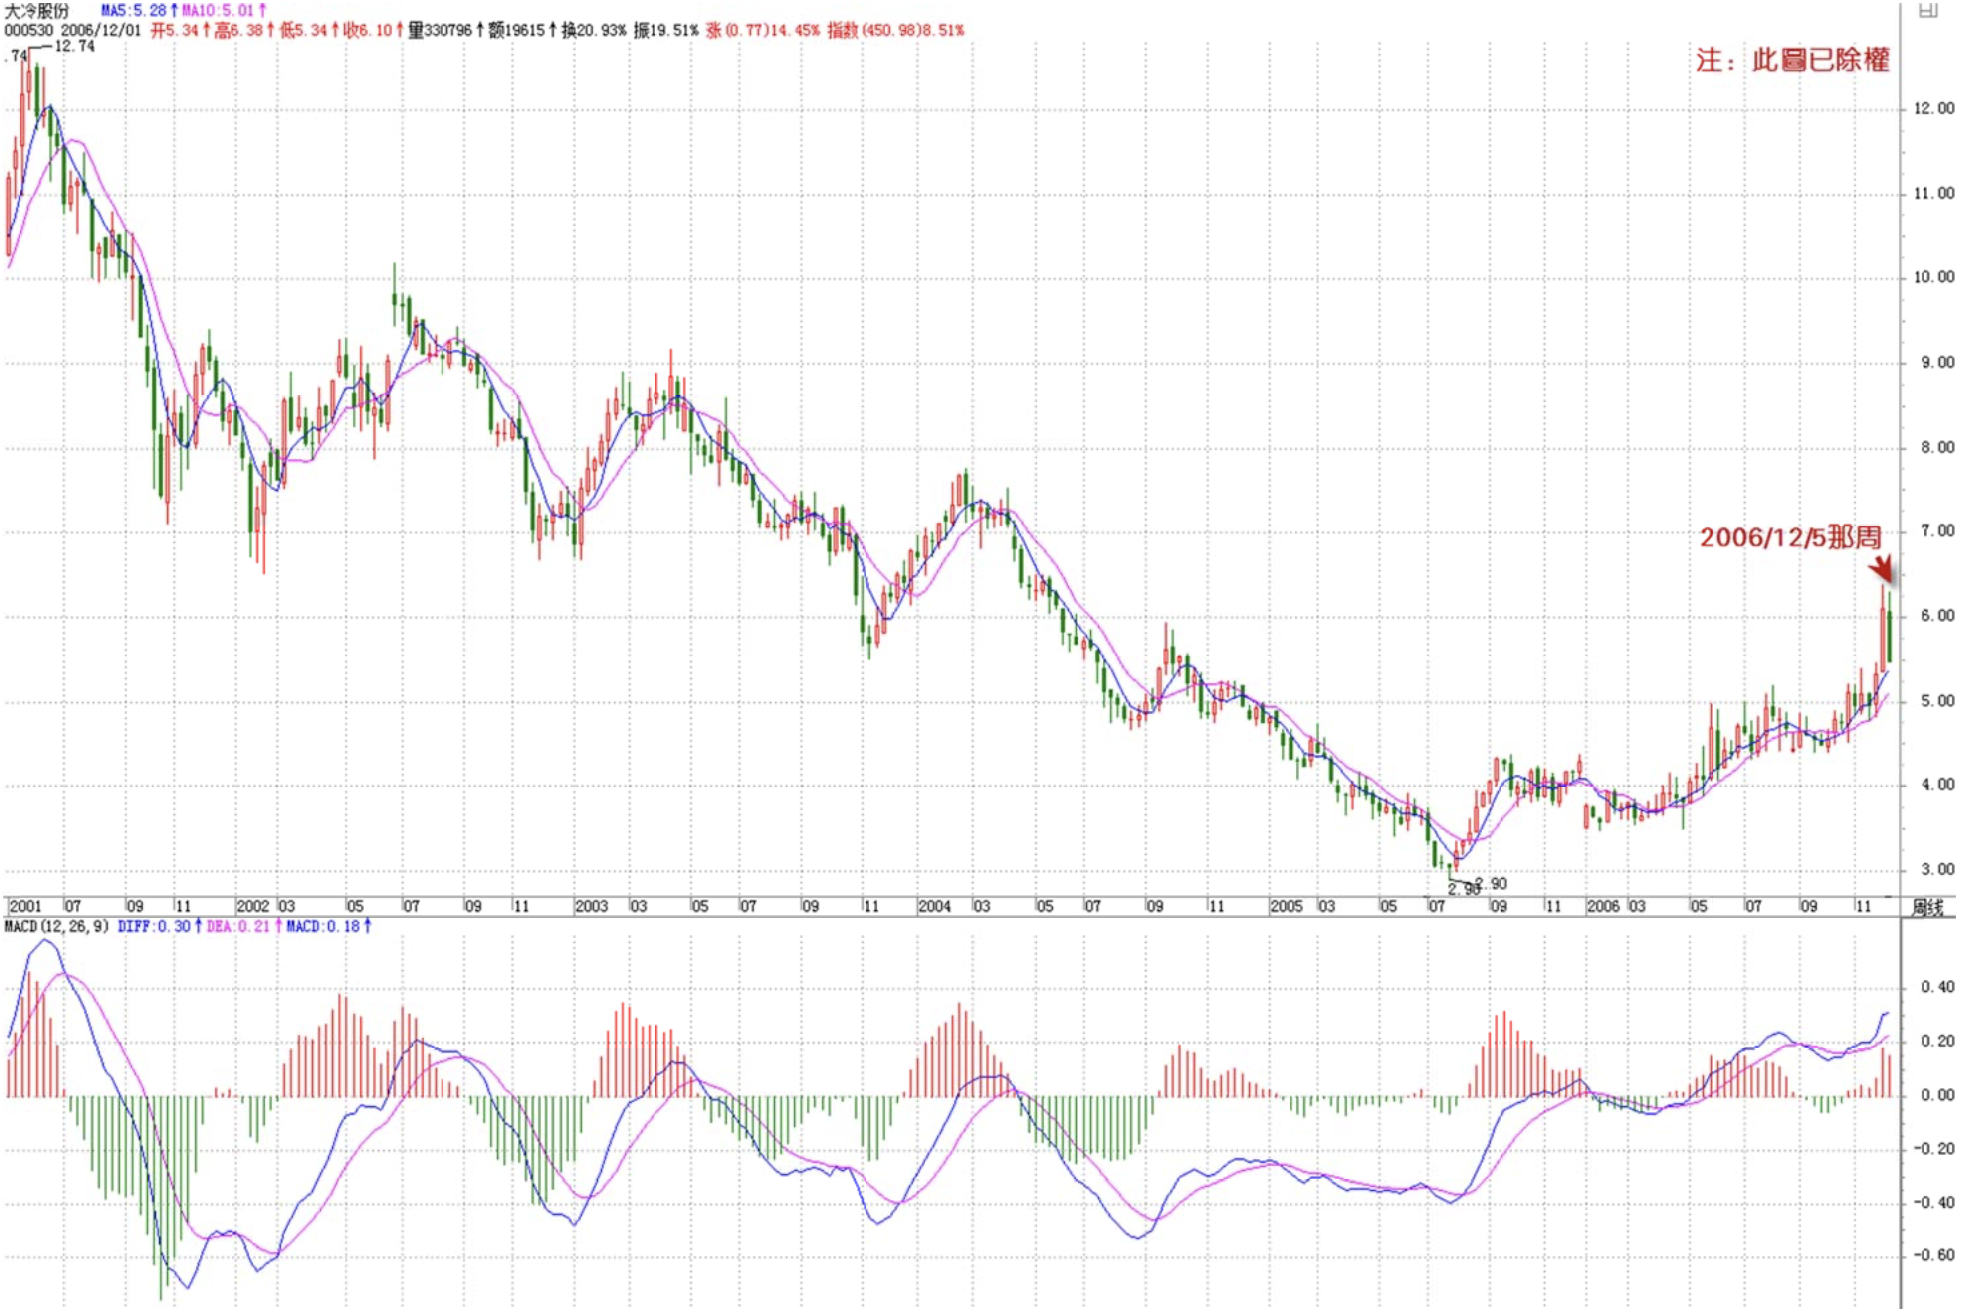
000530: after a weekly flying kiss it moved up, just broke through the 250-day line. Continue holding.
Is my analysis correct, teacher?
===========
Correct, continue holding. The weekly first-type and second-type buy points have long passed. This stock's movement is very standard—worth analyzing and studying.
缠中说禅 2006/12/5 21:58:17
[Anonymous] 妄语
2006-12-05 13:15:51
Seems like I'm starting to understand. Still mulling it over... Chan girl, could you find a stock where this method failed or required a stop-loss, to compare with 600519? That would help deepen the understanding. Thanks in advance.
=========
On the weekly chart, failure examples are actually hard to find. If anyone finds one, please share.
缠中说禅 2006/12/5 22:12:54
[Anonymous] 在路上
2006-12-05 13:52:21
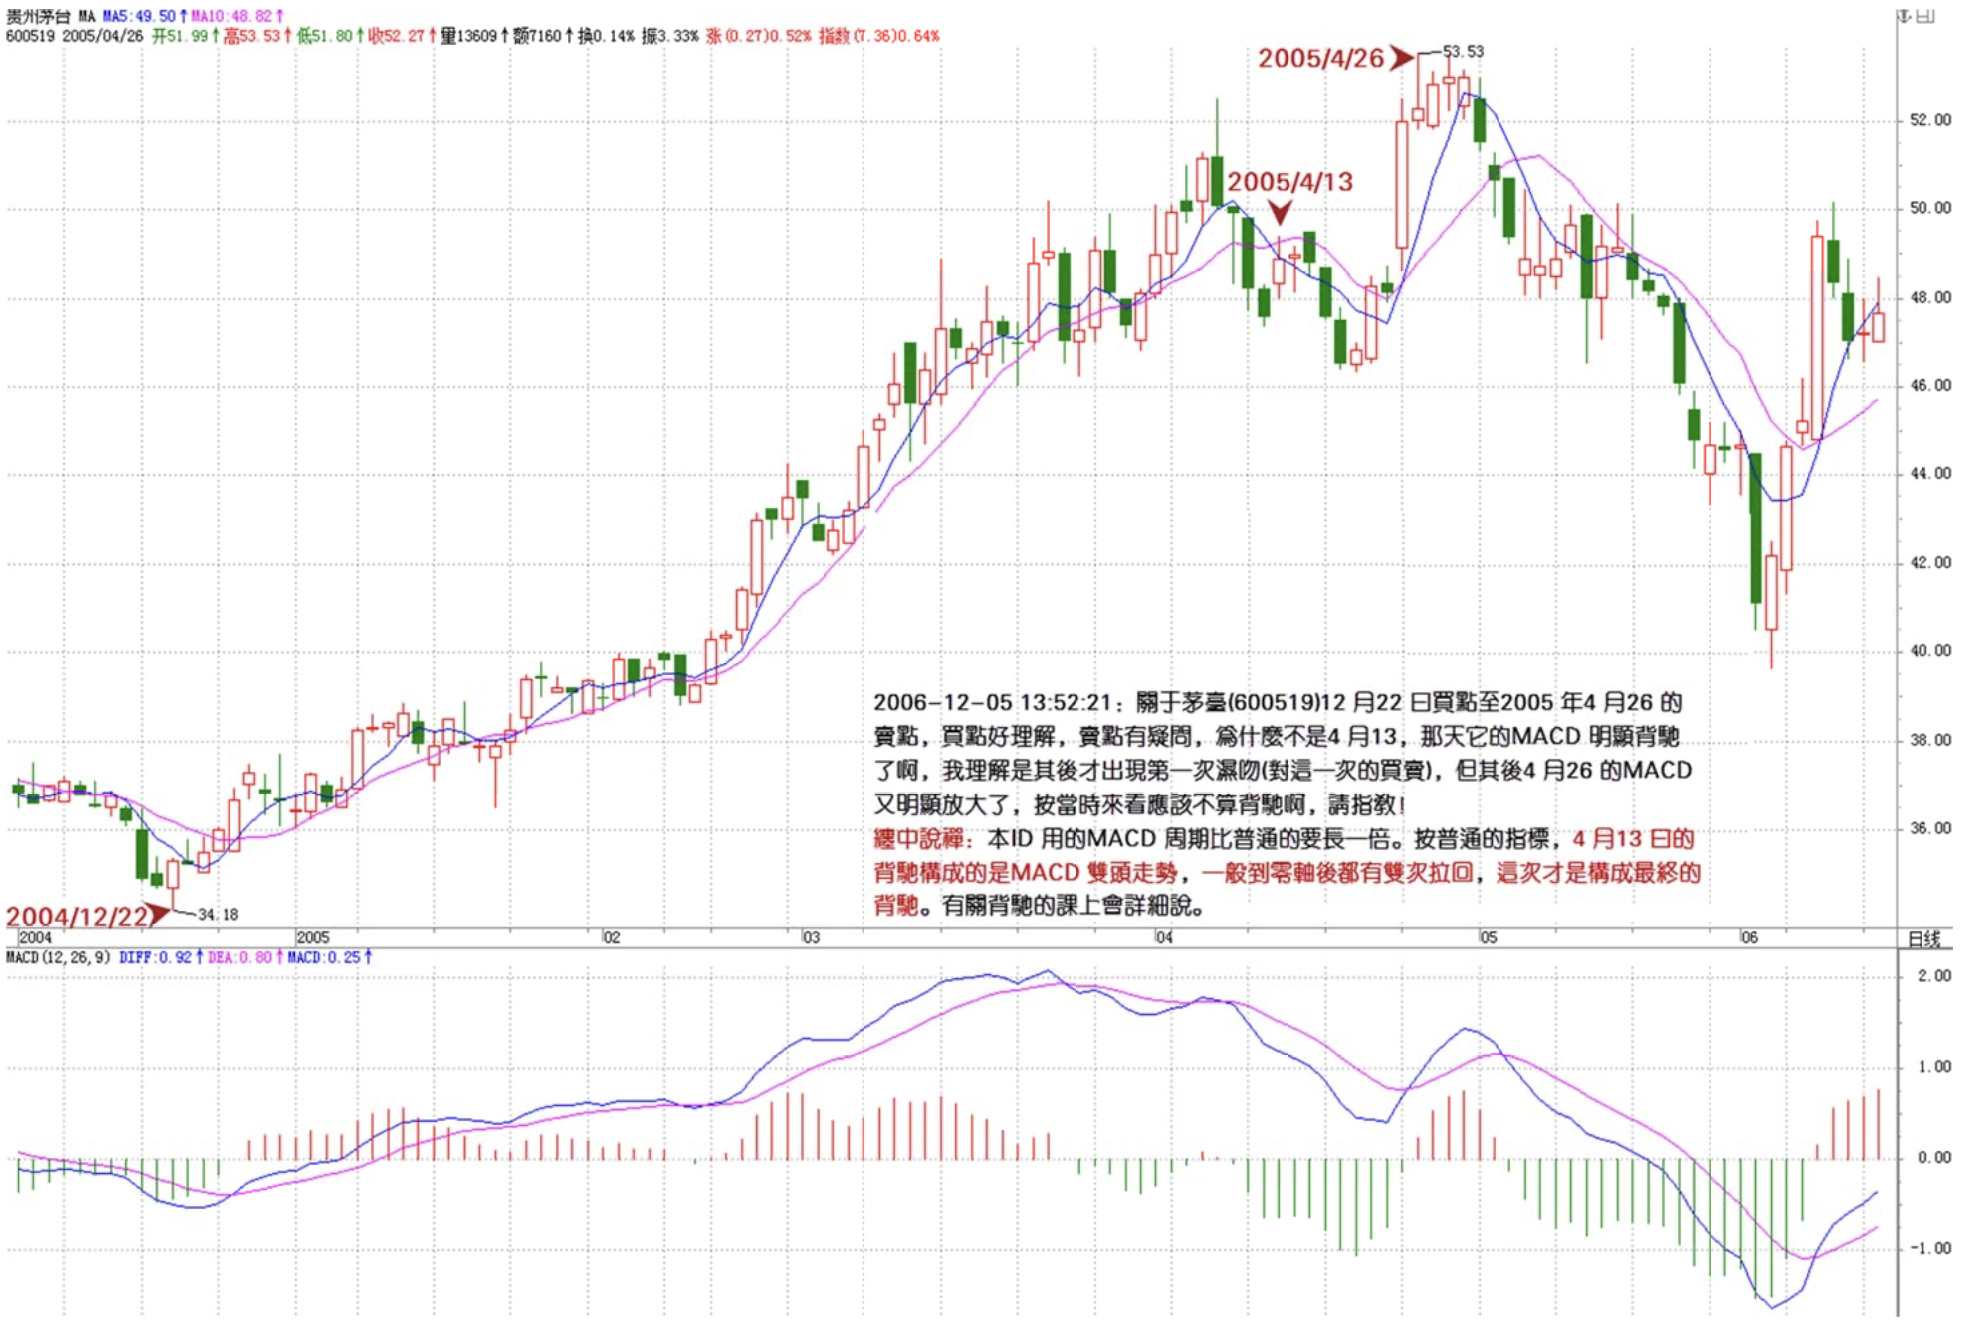
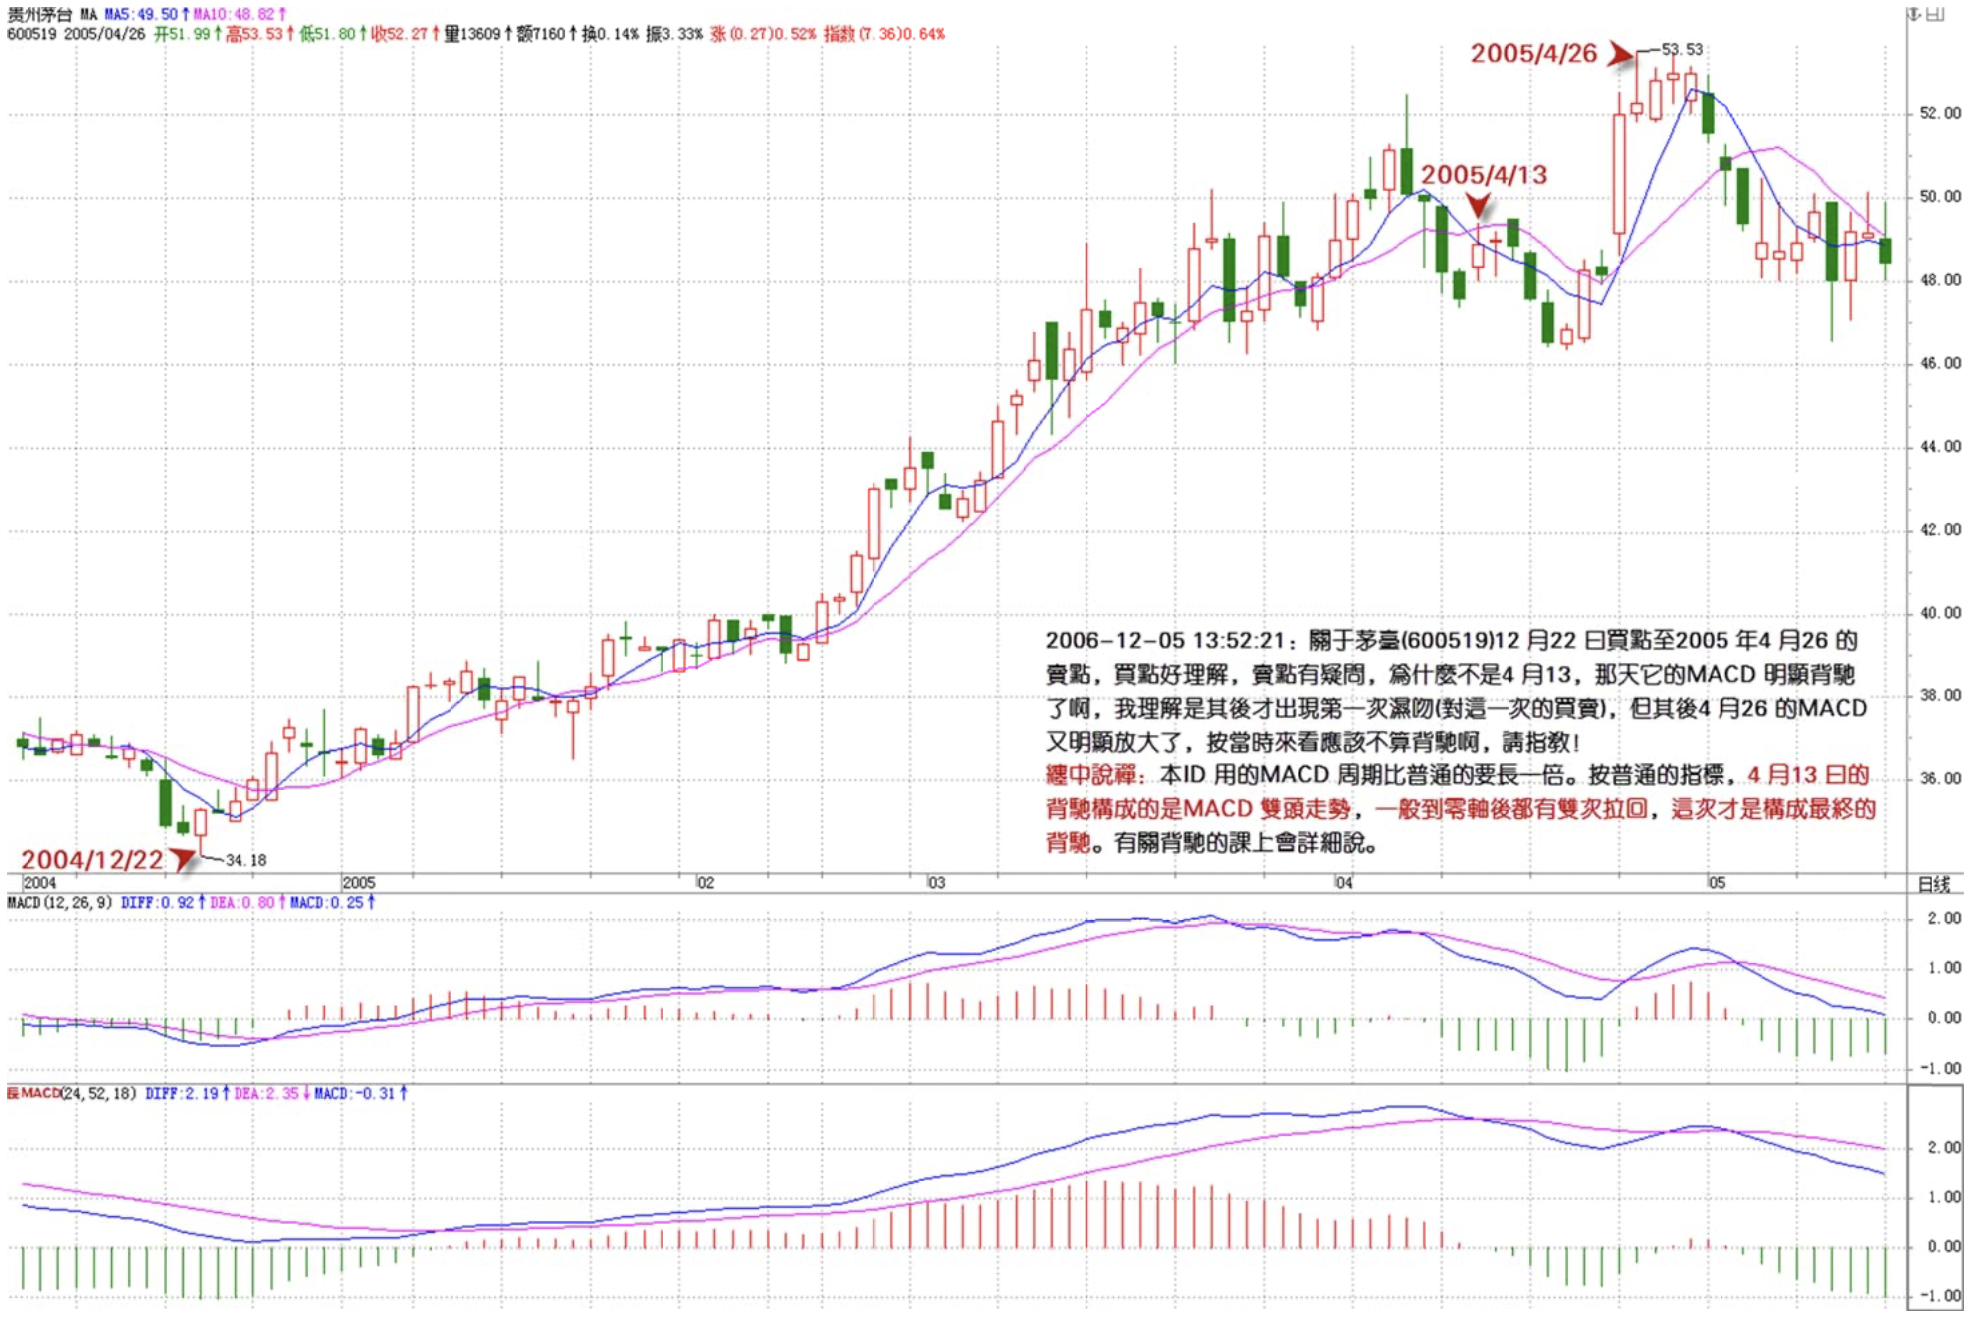
Question for Chan sister: Regarding the period from the December 22 buy point to the April 26, 2005 sell point—the buy point I understand, but I have doubts about the sell point. Why isn't it April 13? That day, the MACD clearly showed divergence. My understanding is that the first wet kiss only appeared after that (for this particular round of buying and selling). But then the MACD on April 26 clearly expanded again—shouldn't that not count as divergence at the time? Please advise!
=============
The MACD cycle this ID uses is twice as long as the standard one. With the standard indicator, the divergence on April 13 forms a double-top MACD pattern. Generally, after returning to the zero line, there's a second pull-back—this time is what forms the ultimate divergence. Detailed discussion on divergence will come in the lesson specifically about it.
缠中说禅 2006/12/5 22:18:03
[Anonymous] 笨笨猪
2006-12-05 14:55:34
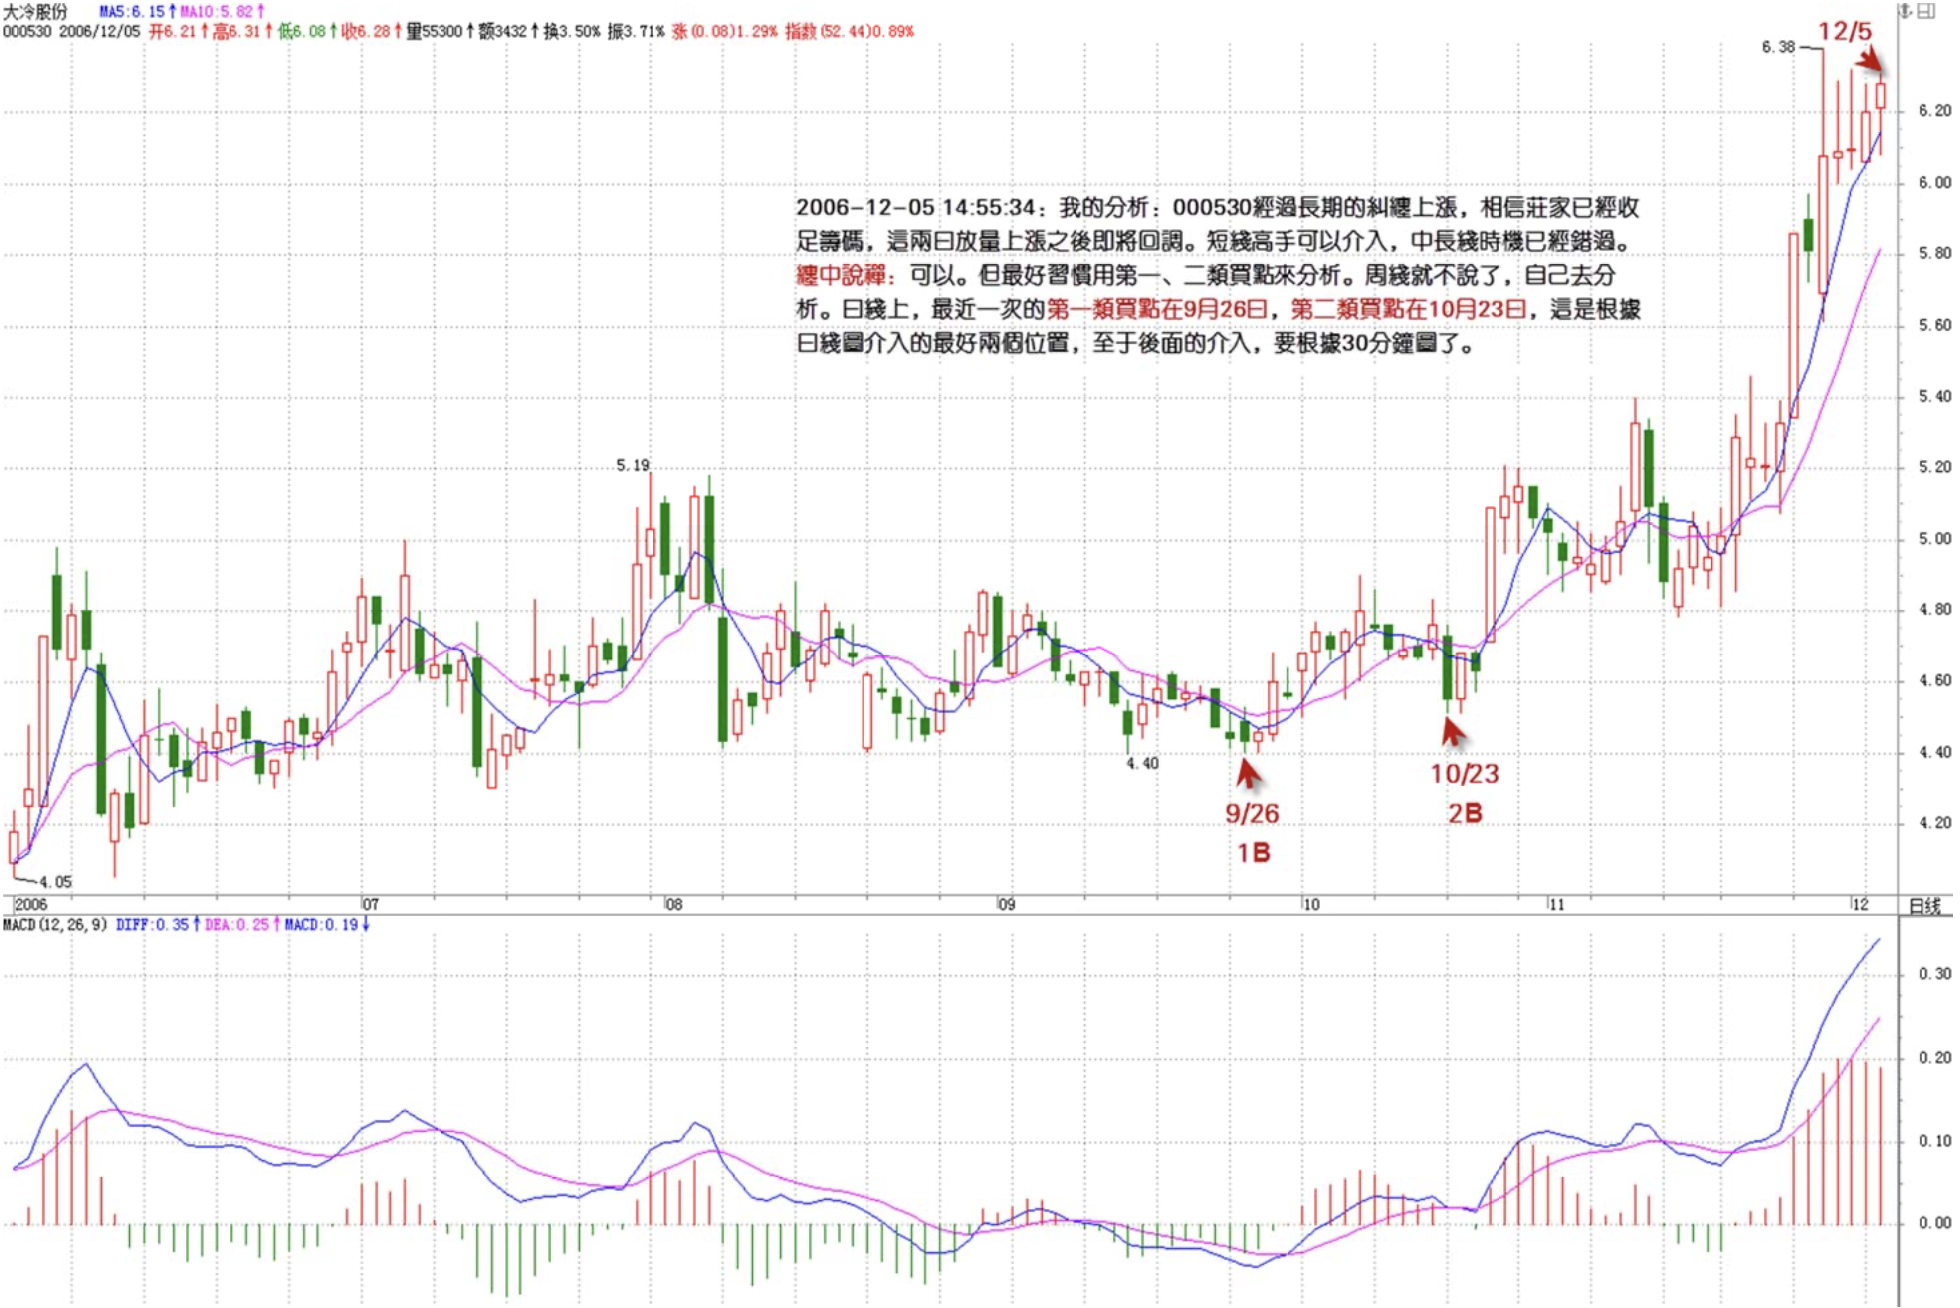
My analysis: 000530 has been entangling upward for a long time. I believe the market maker has collected enough chips. After the volume surge these two days, a pullback is imminent. Short-term traders can enter; medium-to-long-term timing has already been missed.
==============
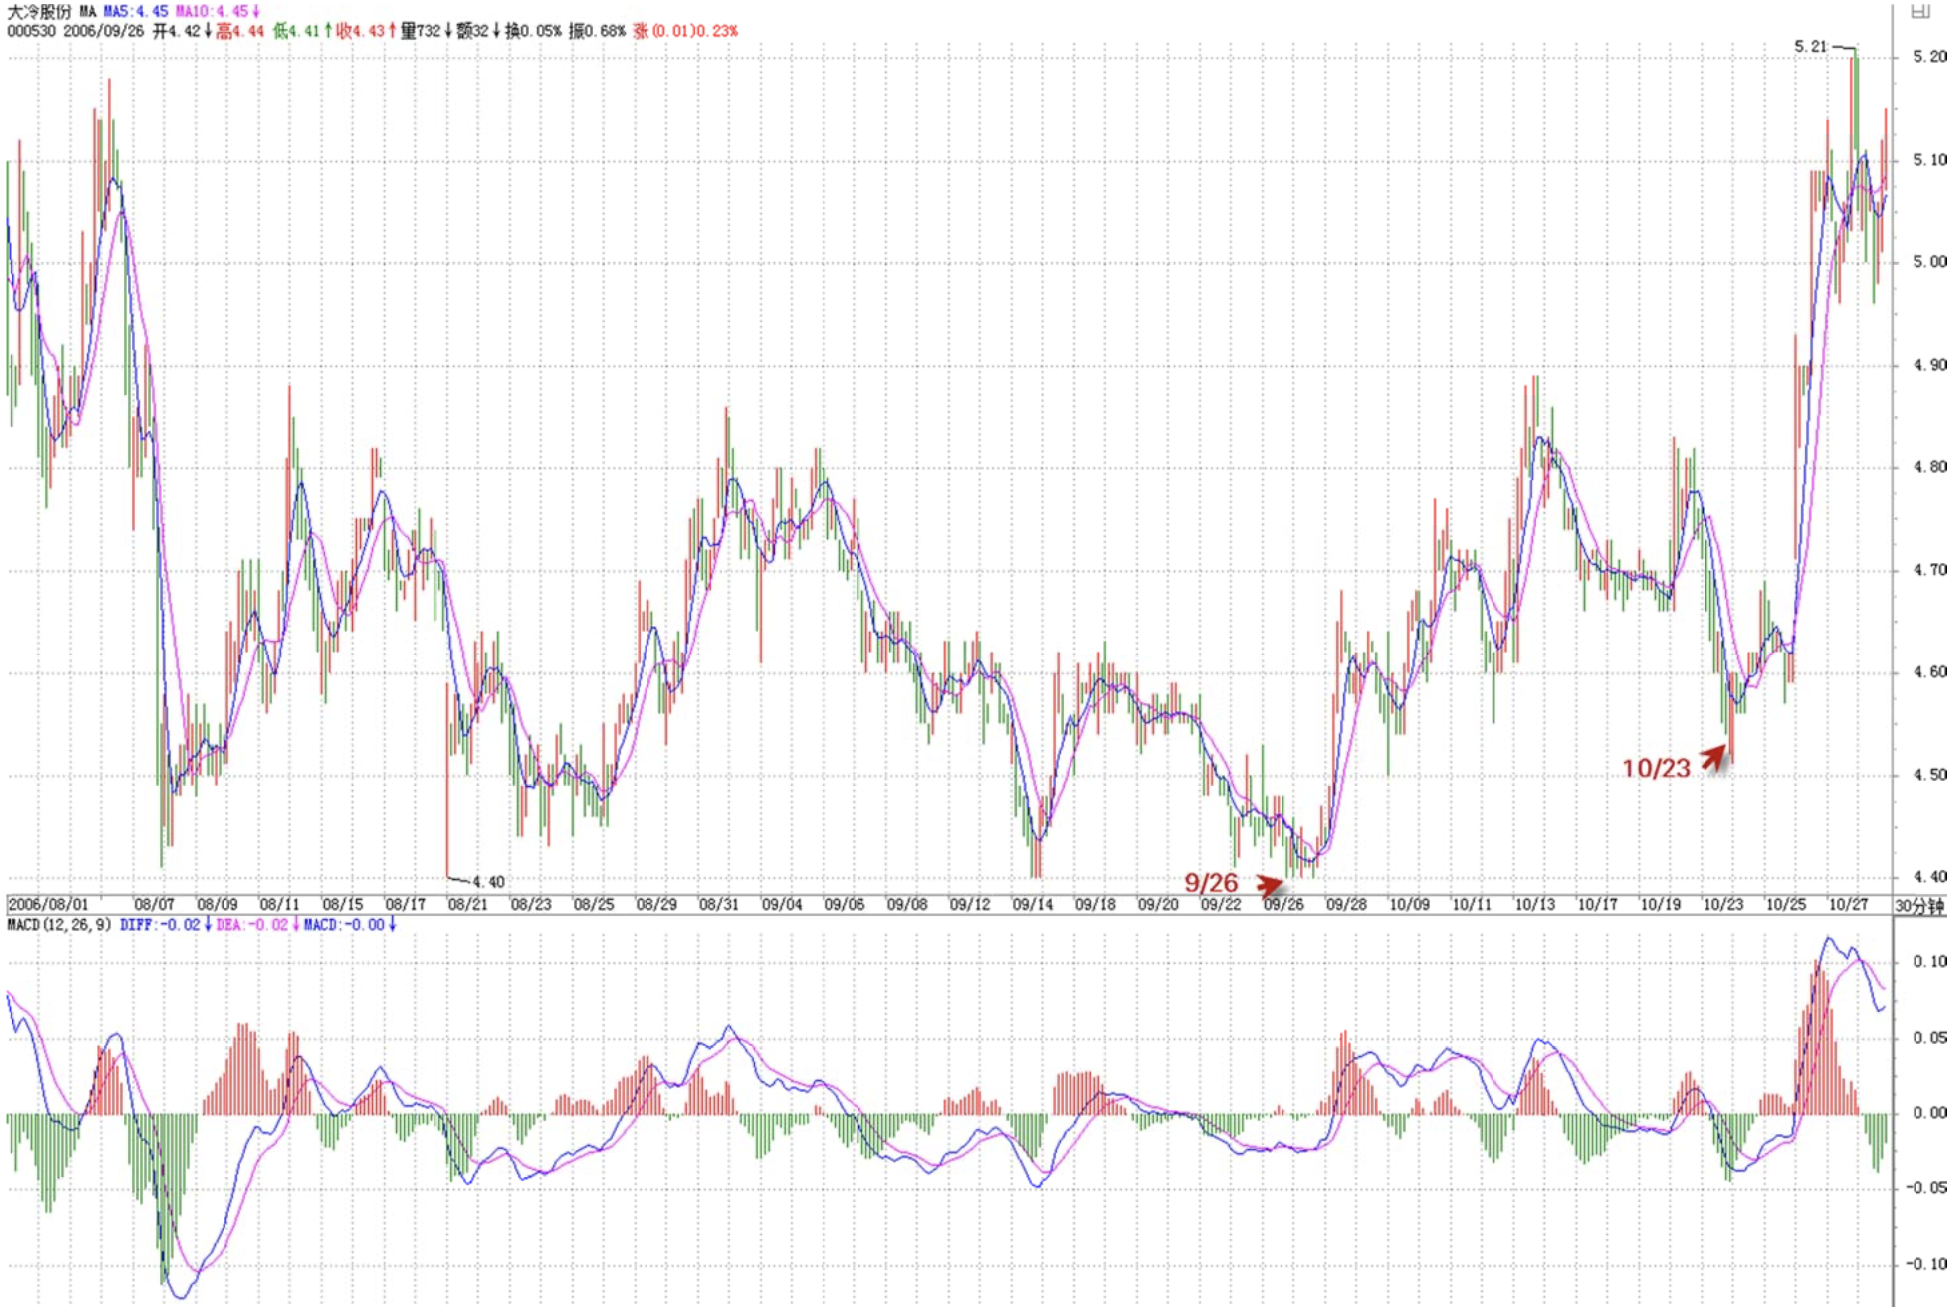
Okay. But it's best to get in the habit of using first-type and second-type buy points for analysis. Won't discuss the weekly—analyze that yourself. On the daily chart, the most recent first-type buy point was September 26, the second-type buy point was October 23. Those are the best two entry points based on the daily chart. For subsequent entries, you'd need to use the 30-minute chart.
缠中说禅 2006/12/5 22:19:50
[Anonymous] Xiao Ming
2006-12-05 21:16:43
Bought 000623 this morning. Chased the high.
What's the outlook? Can I still hold?
=======
You really need to find your own solid harbor. If you like doing short-term, you can use 5-minute or even 1-minute charts to find first-type and second-type buy points. There's absolutely no need to chase highs.
缠中说禅 2006/12/5 22:23:28
Everyone, go study it well. Once you truly understand, it will benefit you for life. You must study charts until everything is clear. This ID will try to explain everything as clearly as possible.
The market has entered consolidation as expected. The 5-day moving average is the short-term key, but individual stocks shouldn't be a problem, especially second-tier and third-tier stocks that haven't moved yet.
Signing off now. See you later.
缠中说禅 2006/12/5 11:53:53
This ID's recommendation for the broader market remains valid, quoted as follows:
This conclusion continues to be valid
Chán Zhōng Shuō Chán
2006-11-29 15:14:38
From the perspective of a healthy market, this ID's recommendation for the broader market is: first let the Shenzhen Component Index break through its historical high of 6103 points, then Shanghai follows, and after the breakthrough, then correct—this would be healthier. I wonder if the market is interested in listening to this ID's opinion.