Teaching You to Trade Stocks 15: No Trend, No Divergence.
2006/12/8 11:55:57
Some people are very concerned about things like market makers and major players, but the positional distinction between retail investors and market makers is merely the "anxiety" under the market's "non-anxiety." Those familiar with this ID's interpretation of the Analects can easily understand this. There are things that transcend the positional distinction between retail investors and market makers—this is the root of the market. Once you grasp it, the so-called positional distinction between retail investors and market makers becomes a joke. If you really enjoy hearing anecdotes and secrets about market makers, this ID can share some when there's time, and can even tell you how to ambush and destroy market makers—in this regard, no one in the country has more experience than this ID.
For market movements, there is one thing that is "non-anxious" (不患): the three classifications of movements—uptrend, downtrend, and consolidation. All movements can be decomposed into these three situations. This is the simplest truth, and it is the only reliable foundation for market analysis. Many people often overlook the simplest things and get lost in all sorts of fancy nonsense. Whether you're a major player, a retail investor, or a market maker, none can escape these three classifications and the movements they weave together.
So what constitutes an uptrend, a downtrend, and consolidation? Below is a definition. First, it must be clear that all uptrends, downtrends, and consolidations are established on a specific timeframe chart. For example, what appears as consolidation on the daily chart may be an uptrend or downtrend on the 30-minute chart. Therefore, a specific chart is the basis for judgment, and the choice of chart is consistent with the trading system selection discussed above—related to your capital, personality, operating style, etc.
Uptrend: the most recent high is higher than the previous high, AND the most recent low is higher than the previous low.
Downtrend: the most recent high is lower than the previous high, AND the most recent low is lower than the previous low.
Consolidation: the most recent high is higher than the previous high, AND the most recent low is lower than the previous low; OR the most recent high is lower than the previous high, AND the most recent low is higher than the previous low.
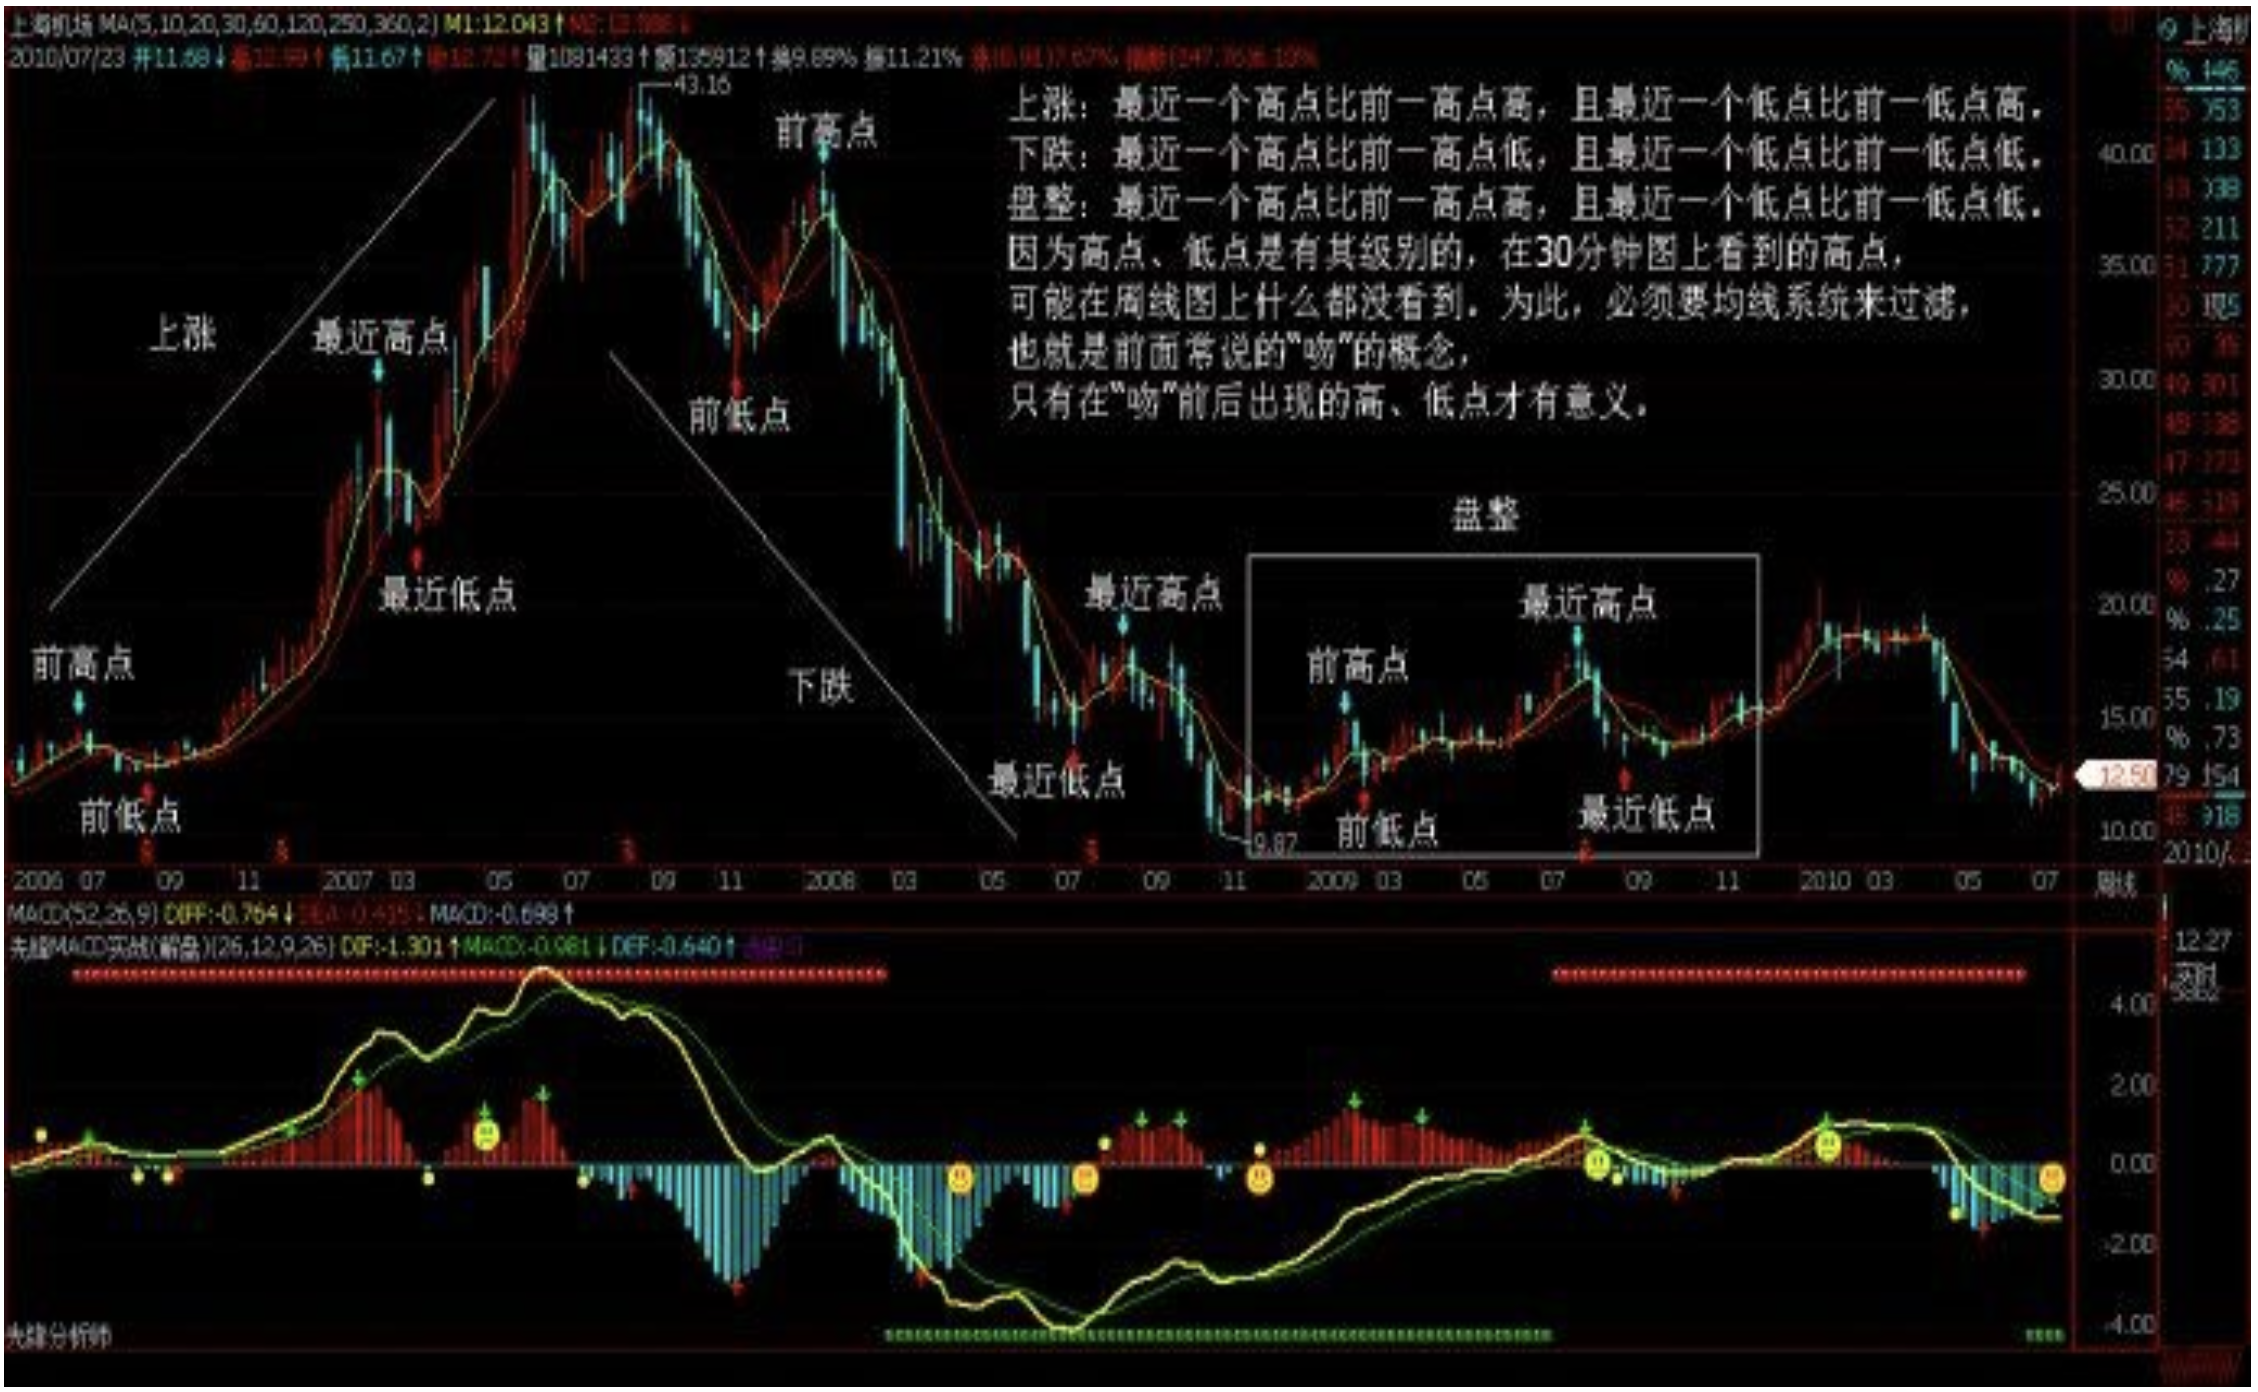
The key to operation is not the definition, but how to deeply understand the definition so that operations have a solid foundation. The difficulty lies in how to identify highs and lows, because highs and lows have their own levels—a high visible on a 30-minute chart may be completely invisible on a weekly chart. For this purpose, the moving average system must be used as a filter—that is, the concept of "kisses" frequently discussed before. Only highs and lows that appear before and after "kisses" are meaningful.
Here, first we must understand how "kisses" are produced. If a movement can't even break through the short-term moving average, then the highs and lows appearing during that period are certainly only significant on lower-level charts and are meaningless on the current level chart. When the movement breaks the short-term moving average but fails to break the long-term moving average, it forms a "flying kiss." When the movement breaks the long-term moving average but immediately forms a trap, it forms a "lip kiss." When the movement breaks the long-term moving average and produces a certain amount of back-and-forth, it forms a "wet kiss." From this, we can see that the classification of "kisses" is based on the degree of resistance to the original trend. A "flying kiss" represents basically no resistance, a "lip kiss" has only moderate force, while a "wet kiss" means the force has sufficient intensity. All turning points essentially begin from "wet kisses."
Turning points generally come in only two forms: first, after a "wet kiss," the original trend continues, forming a trap before turning back to create a reversal; second, consolidation occurs, using time to create space for a reversal. Setting aside the second case for now, the biggest hallmark of the first case is the so-called "divergence." It must be noted: no trend, no divergence. In consolidation, there is no such thing as "divergence"—this point must be made absolutely clear. Another point that must be noted: all judgments here only involve two moving averages and the price movement, and have nothing to do with any technical indicators.
How to determine "divergence"? First, let's define a concept called Chan Trend Strength: the area formed between the short-term moving average and the long-term moving average from the end of the previous "kiss" to the beginning of the next "kiss." When the Chan Trend Strength in two consecutive same-direction trends shows the latter being weaker than the former, "divergence" is formed. By this definition, it's the most reliable method, but its only drawback is that you must wait until the next kiss occurs before making a judgment—by then, the movement may have already moved some distance from the true turning point. How to solve this problem: the first method is to look at a lower-level chart and find the corresponding turning point using the same approach. This way, you'll be very close to the true low point.
There's another method that requires higher skill. First, define another concept called Chan Average Trend Strength: the area formed between the short-term and long-term moving averages from the end of the previous "kiss" to the current moment, divided by time. Because this concept is real-time, you can immediately compare the current Chan Average Trend Strength with the previous one. Once this time's is weaker than last time's, you can judge that "divergence" is about to form. Then, based on the distance between the short-term and long-term moving averages, once the extension length shortens, it means the true bottom is about to form. Using this method, the true turning point can basically be captured simultaneously. But there's a drawback: the risk is slightly higher, the required skill is greater, and you need better market intuition.
A pure K-line chart with just two moving averages is sufficient to handle the most complex market movements. Of course, if you don't have such chart-reading ability, you can refer to technical indicators like MACD. Applications of various technical indicators will be discussed gradually in the future.
Replies
缠中说禅 2006/12/8 12:18:49
Finally got it fixed. The font is bigger now—too many people on Sina, the system is too unstable.
缠中说禅 2006/12/8 12:19:59
[Anonymous] 老老没用
2006-12-08 12:16:56
Well said! You've revealed the essence. Slowly savoring, studying, and practicing until it becomes instinct—that's the great achievement!
=============
That's the right attitude.
缠中说禅 2006/12/8 12:20:46
[Anonymous] iris
2006-12-08 12:16:47
The blogger is truly a genius. Studying like crazy. Unfortunately I'm a beginner, so it's quite tough to follow.
===========
Take your time—there's plenty of time and opportunities.
缠中说禅 2006/12/8 12:22:33
Xiao Ming
2006-12-08 12:06:19
I'm late. Just checking in.
Are you really not going to talk about the broader market anymore?
=========
Not for now. I'll talk about it again someday when everyone isn't so agitated.
Some things you don't need to understand too deeply. Some things are pointless to speculate about.
缠中说禅 2006/12/8 12:35:56
[Anonymous] 小溪
2006-12-08 12:32:05
Chan JJ, my stock 600196 has already dropped a big chunk without any kiss appearing. Won't it have dropped to nothing by the time a kiss appears? 55555555, what should I do?
===========
Your understanding is wrong. Carefully reflect on this statement:
First, it must be clear that all uptrends, downtrends, and consolidations are established on a specific timeframe chart. For example, what appears as consolidation on the daily chart may be an uptrend or downtrend on the 30-minute chart.
缠中说禅 2006/12/8 12:39:24
[Anonymous] 中间体
2006-12-08 12:31:36
So you talk about divergence only after a trend has formed, and divergence strength is judged by the area. But isn't it possible to have a second divergence after the first one? Please answer, Chan sister.
============
The person asking about 600196 above must also understand this: only talk about divergence after a trend has formed.
For a given trend, divergence only occurs once. There's a subtle nuance here that I'll discuss in a couple of days.
缠中说禅 2006/12/8 12:40:34
Ren Woxing
2006-12-08 12:37:19
The blogger is truly a great figure. Selflessly sharing technical knowledge with society.
I like short-term trading. Could the blogger talk more about short-term methods? Also, how can you tell if a stock has a major player? Like 600050 which has been strong recently—how do you spot the launch?
============
The technical foundation is the same for long-term and short-term—only the charts differ. For the most short-term, look at 1-minute charts; typically look at 5-minute or 30-minute charts.
缠中说禅 2006/12/8 12:41:16
[Anonymous] 中间体
2006-12-08 12:40:02
Must it always be two adjacent areas that are compared?
===========
Yes. Look at charts more—areas can be estimated by eyeballing; no indicators needed.
缠中说禅 2006/12/8 12:44:09
[Anonymous] 外科医生
2006-12-08 12:38:27
For a stock like Beichen Real Estate with that kind of movement, how do you determine its sell signal? What's the best strategy now? (First, I want to emphasize that I don't hold this stock—just using it as an example.) Thanks.
...........
Yesterday at 2 PM, divergence occurred—that was the sell signal.
===========
Correct. The divergence on this stock's 30-minute chart is very obvious. For stocks with such fierce short-term moves, if your capital isn't too large, you can't rely on the daily chart—that's too slow. The 30-minute chart is more than enough.
缠中说禅 2006/12/8 12:45:05
[Anonymous] 半部论语治天下
2006-12-08 12:43:45
I have a question: the area formed by moving average crossovers is irregular. How do you calculate it?
=============
Only areas formed during trends count. Constant entanglement without a trend is consolidation. This must be understood clearly.
缠中说禅 2006/12/8 12:47:17
[Anonymous] nn
2006-12-08 12:29:25
First, thank you for your selfless teaching. But it's quite theoretical. Getting older and need time to grasp it. One thing I don't understand: for a stock like Beichen Real Estate with that kind of movement, how do you determine its sell signal? What's the best strategy now? (I emphasize that I don't hold this stock—just using it as an example.) Thanks.
=============
For stocks with such fierce short-term moves, look at the 30-minute chart—the sell point is very clear. If you haven't exited yet, don't worry—the bounce will be very sharp. Just wait.
缠中说禅 2006/12/8 12:52:04
Heart Zen
2006-12-08 12:47:20
"Zen Master," hello. I'm here, a bit late.
A doubt about sell points:
Looking at individual stocks, the first sell point hasn't appeared, but a market correction would inevitably drag them down. How do you avoid this? Just ignore the market decline and continue holding?
============
This situation simply won't arise. It's all a matter of chart selection. Like Beichen Real Estate this time—there was no first-type sell point on the daily chart, but on the 30-minute chart it was extremely obvious. The key is how you choose.
缠中说禅 2006/12/8 12:56:14
Announcing a Chan Theorem:
Any upward turning point is formed by a first-type sell point of some level; any downward turning point is formed by a first-type buy point of some level.
Note the copyright.
缠中说禅 2006/12/8 12:58:41
[Anonymous] 中间体
2006-12-08 12:56:34
Chan sister didn't give a conclusion—is a smaller area ratio better or a larger one? Should be smaller, right?
==========
It's written very clearly above—just smaller than the previous one is sufficient. Study this sentence carefully:
How to determine "divergence"? First, define a concept called Chan Trend Strength: the area formed between the short-term moving average and the long-term moving average from the end of the previous "kiss" to the beginning of the next "kiss." When the Chan Trend Strength is weaker than the previous one, "divergence" is formed.
缠中说禅 2006/12/8 12:59:40
Market is opening, signing off for now. See you later.
缠中说禅 2006/12/8 15:04:56
Xiao Ming
2006-12-08 14:55:02
[Anonymous] 庸人
2006-12-08 14:32:52
Much ado about nothing—the idle worry about the idle.
A mere Beichen Real Estate can send the whole market into carnage. All the prosperity is nothing but illusion, a passing cloud.
=======================
The self-proclaimed mediocre person's level is indeed not great!
Chan mm has said before: don't follow the small money. Watch what the big money is doing. Look at the major leading stocks—which one hasn't built a double top?
Beichen was just a trigger—just a fuse. Get it?
============
Everything requires foresight. This correction was warned about in advance on the 1st. Not taking corresponding action is a mindset issue—being mesmerized by the market. "Prosperity is only illusion, and lack of prosperity is also only illusion." If you don't understand this, thinking only one way, you'll never become a good operator.
A good operator is one who uses illusion to counter illusion and profits from the illusion.
Market correction means opportunities are here again—you should be happy. Of course, if you're fully invested, there's nothing you can do.
缠中说禅 2006/12/8 15:06:26
[Anonymous] 中间体
2006-12-08 12:40:02
Must it always be two adjacent areas that are compared?
===========
Yes. Look at charts more—areas can be estimated by eyeballing; no indicators needed.
If there's a consolidation zone in between, can you skip over the consolidation and compare with the one before it?
==============
Consolidation is not a trend—of course it doesn't count.
缠中说禅 2006/12/8 15:07:27
This ID has a social engagement and is signing off. Everyone take your time reading. See you later.
缠中说禅 2006/12/8 12:11:24
Sina's system has been very problematic lately. Couldn't format things properly today no matter what. Just bear with it, everyone.