Teaching You to Trade Stocks 25: Kisses, MACD, Divergence, and Hubs
2007/1/23 15:13:13
Main Text
I've noticed many people are mixing up previously discussed concepts, so let me re-emphasize some issues. The so-called "kiss" is related to the moving average system, and the moving average system is merely a simple mathematical processing of price movements — put bluntly, it cannot escape probability theory. This is completely different from concepts like hubs discussed later, so you must be very clear about this and not confuse the moving average system with hubs. The moving average system is essentially the same thing as indicators like MACD — it can only serve as an auxiliary tool. Since these tools are relatively straightforward and easy to grasp, those who don't want to delve too deep can start by understanding these first.
Shuijingfang (600779)
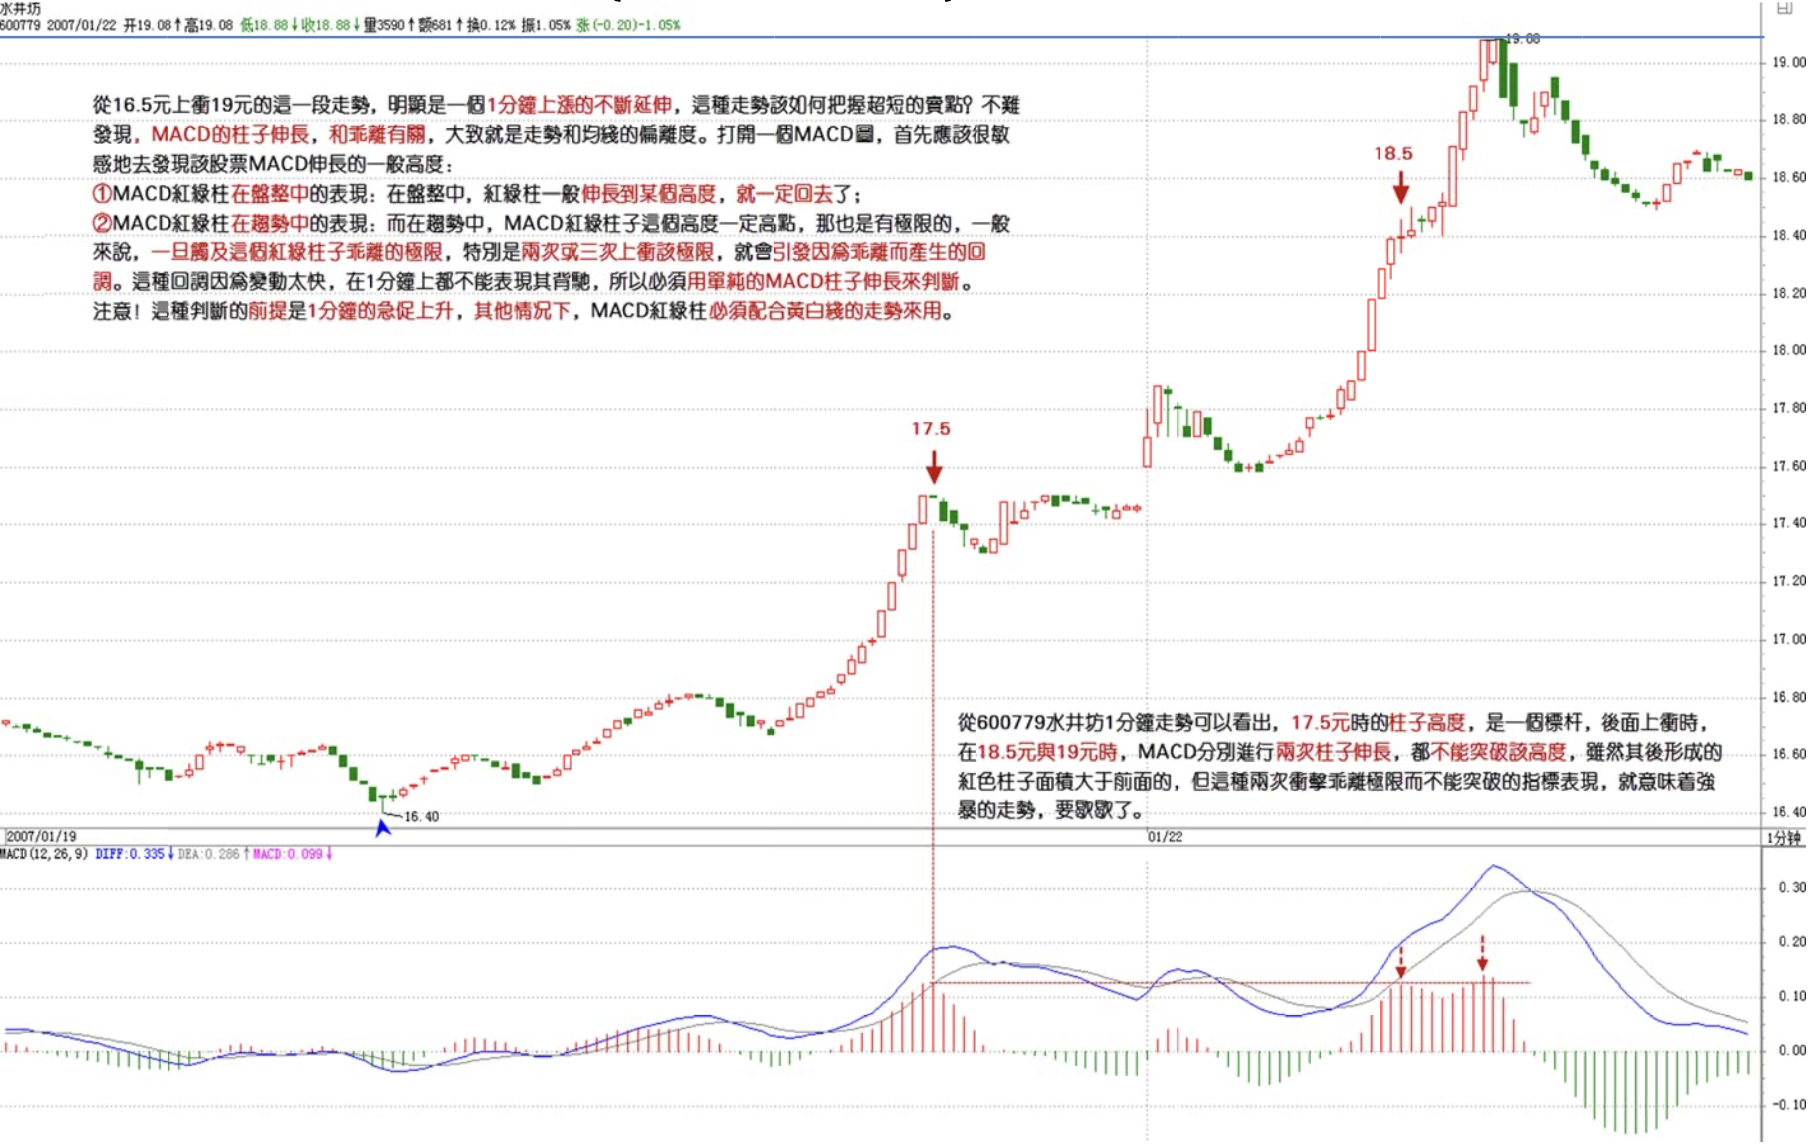
But "learning as if you can't catch up," if you cannot trace things to their root, in the end you'll always be "fearing you'll lose it." Therefore, ultimately you must understand hubs and the rest. MACD, as an auxiliary system, is very useful. The sensitivity of MACD depends on its parameters — generally the parameters 12, 26, 9 are used, which work fine for typical price movements. But for extremely rapid movements, even the 1-minute chart's response is too slow. If you're doing ultra-short-term trading, you need to look at the actual movement. For example, look at the 1-minute chart of 600779 — the run from 16.5 up to 19 is clearly a continuous extension of a 1-minute upward movement. How do you capture the ultra-short-term sell point in this kind of movement? It's not hard to discover that the lengthening of MACD bars is related to deviation — roughly the degree of divergence between price movement and the moving average. When you open an MACD chart, you should first sensitively discover the typical height to which the MACD bars extend for that stock. In consolidation, once bars extend to a certain height, they always retract. In a trend, this height will be somewhat greater, but there's still a limit. Generally speaking, once this deviation limit is touched — especially when prices surge toward this limit two or three times — it triggers a pullback caused by the deviation. Because this kind of pullback changes too quickly, even on the 1-minute chart the divergence cannot be displayed, so you must use the pure lengthening of MACD bars to judge. Note that the premise for this judgment is a rapid 1-minute ascent; in other situations, you must combine it with the movement of the DIF/DEA lines. From this 1-minute chart, you can see that the bar height at 17.5 yuan is a benchmark. During subsequent surges, the two bar extensions at 18.5 and 19 yuan both failed to break through this height. Although the area they formed was larger than the previous one, this failure to break through the deviation limit after two surges means this violent movement needs a rest.
ST Jintai (600385)
There's another situation — when a stock keeps hitting the daily limit-up in a straight line. At this time, due to a weakness in MACD's design, on both 1-minute and even 5-minute charts, wave after wave of sine-wave-like movements will appear. In this case, you cannot use divergence to analyze it. The simplest approach is to use 1-minute hubs — as long as hubs keep shifting upward, you can ignore it. Only when the upward hub shift ends does it mean entering a larger adjustment, and then you judge based on larger timeframe movements whether this adjustment is worth participating in. If using MACD to assist judgment, use a longer timeframe, such as the 30-minute chart. Generally speaking, in this kind of movement, the red bars will exhibit the following pattern: the lows of the red bar retracements get progressively lower, finally touching the zero axis or even slightly breaking below it, and then red bars extend again — this is the warning signal. If at this point the price happens to hit a resistance level on a larger timeframe, once the limit-up fails to hold and large-amplitude oscillations appear, it's very natural. For example, 600385 — at the 2.92 limit-up, MACD showed a tiny green bar, then continued limit-up with continued red bars, and 3.28 yuan was the previous daily chart high. The result was that once the 3.22 limit-up failed to hold, large-amplitude oscillations began.
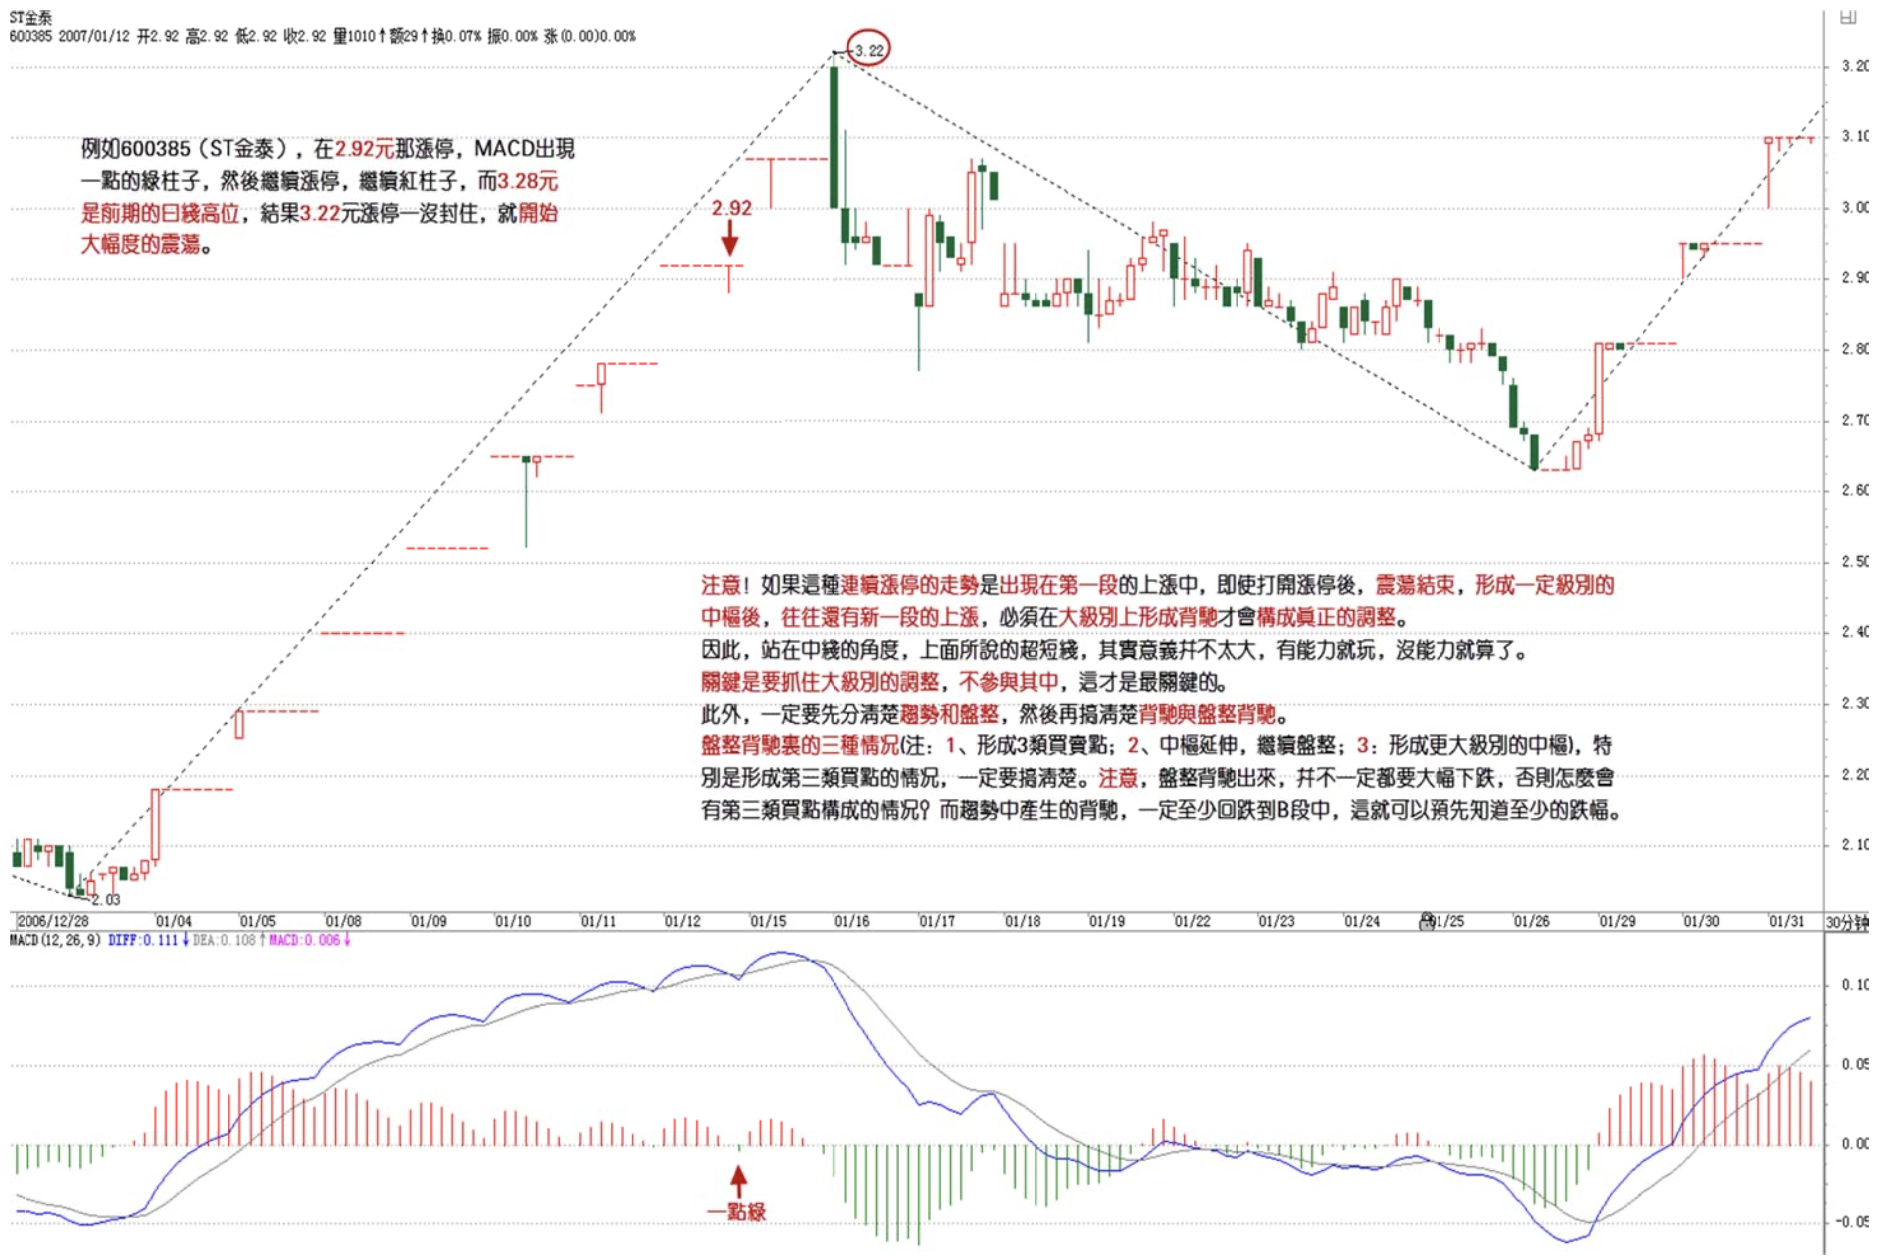
Note that if this kind of consecutive limit-up occurs during the first segment of an upward move, even after the limit-up opens and oscillation ends, forming a hub of a certain level, there's often still a new segment of upward movement. Only when divergence forms on a larger timeframe does a real adjustment occur. Therefore, from a medium-term perspective, the ultra-short-term trading mentioned above doesn't have much significance — play it if you have the ability, forget it if you don't. The key is to capture large-timeframe adjustments and not participate in them — that's the most crucial thing.
Furthermore, you must first distinguish between trends and consolidation, then understand the difference between divergence and consolidation divergence. The three situations within consolidation divergence — especially the one forming third-type buy points — must be thoroughly understood. Note that after a consolidation divergence, it doesn't necessarily lead to a sharp decline; otherwise, how could third-type buy points ever form? But divergence occurring within a trend will definitely retrace at least into the B-segment, from which you can predict the minimum decline.
Regarding the strength of the retracement after divergence, it's closely related to the timeframe level. If on the daily chart the uptrend is just beginning its middle segment, with MACD just making new highs and red bars extending powerfully, then even if a 5-minute divergence appears, its downward force is obviously limited — you can only play small short-term trades, or even ignore it. But in the final stage of a daily chart movement, especially during the extension phase of an uptrend, a single 1-minute divergence can trigger a crash. So this must be examined comprehensively across multiple timeframes — you absolutely cannot sell expecting a 50% drop just because you see a divergence. Nothing in the world works like that.
Generally speaking, a standard two-hub uptrend will manifest on MACD in the following pattern: In the first segment, MACD's DIF/DEA lines cross upward from below the zero axis, while staying above the zero axis the corresponding first hub forms, simultaneously creating a second-type buy point. Then it breaks through this hub, and MACD's DIF/DEA lines pull up rapidly — this is often the most powerful segment. All kinds of trend extensions, and the so-called "indicator dulling" where MACD winds around, frequently occur in this segment. This segment generally ends in a sub-level divergence, then enters the formation process of the second hub, while MACD's DIF/DEA lines gradually return near the zero axis. Finally, it begins to break through the second hub again, and MACD's DIF/DEA lines and bars repeat the previous process. But this time, the DIF/DEA lines cannot make new highs, or the bar area or extension height cannot break through to new highs — divergence appears, and this ends the two-hub uptrend process. Understanding this principle, you can know the past and future of most stocks well in advance.
Haima Automobile (000572)
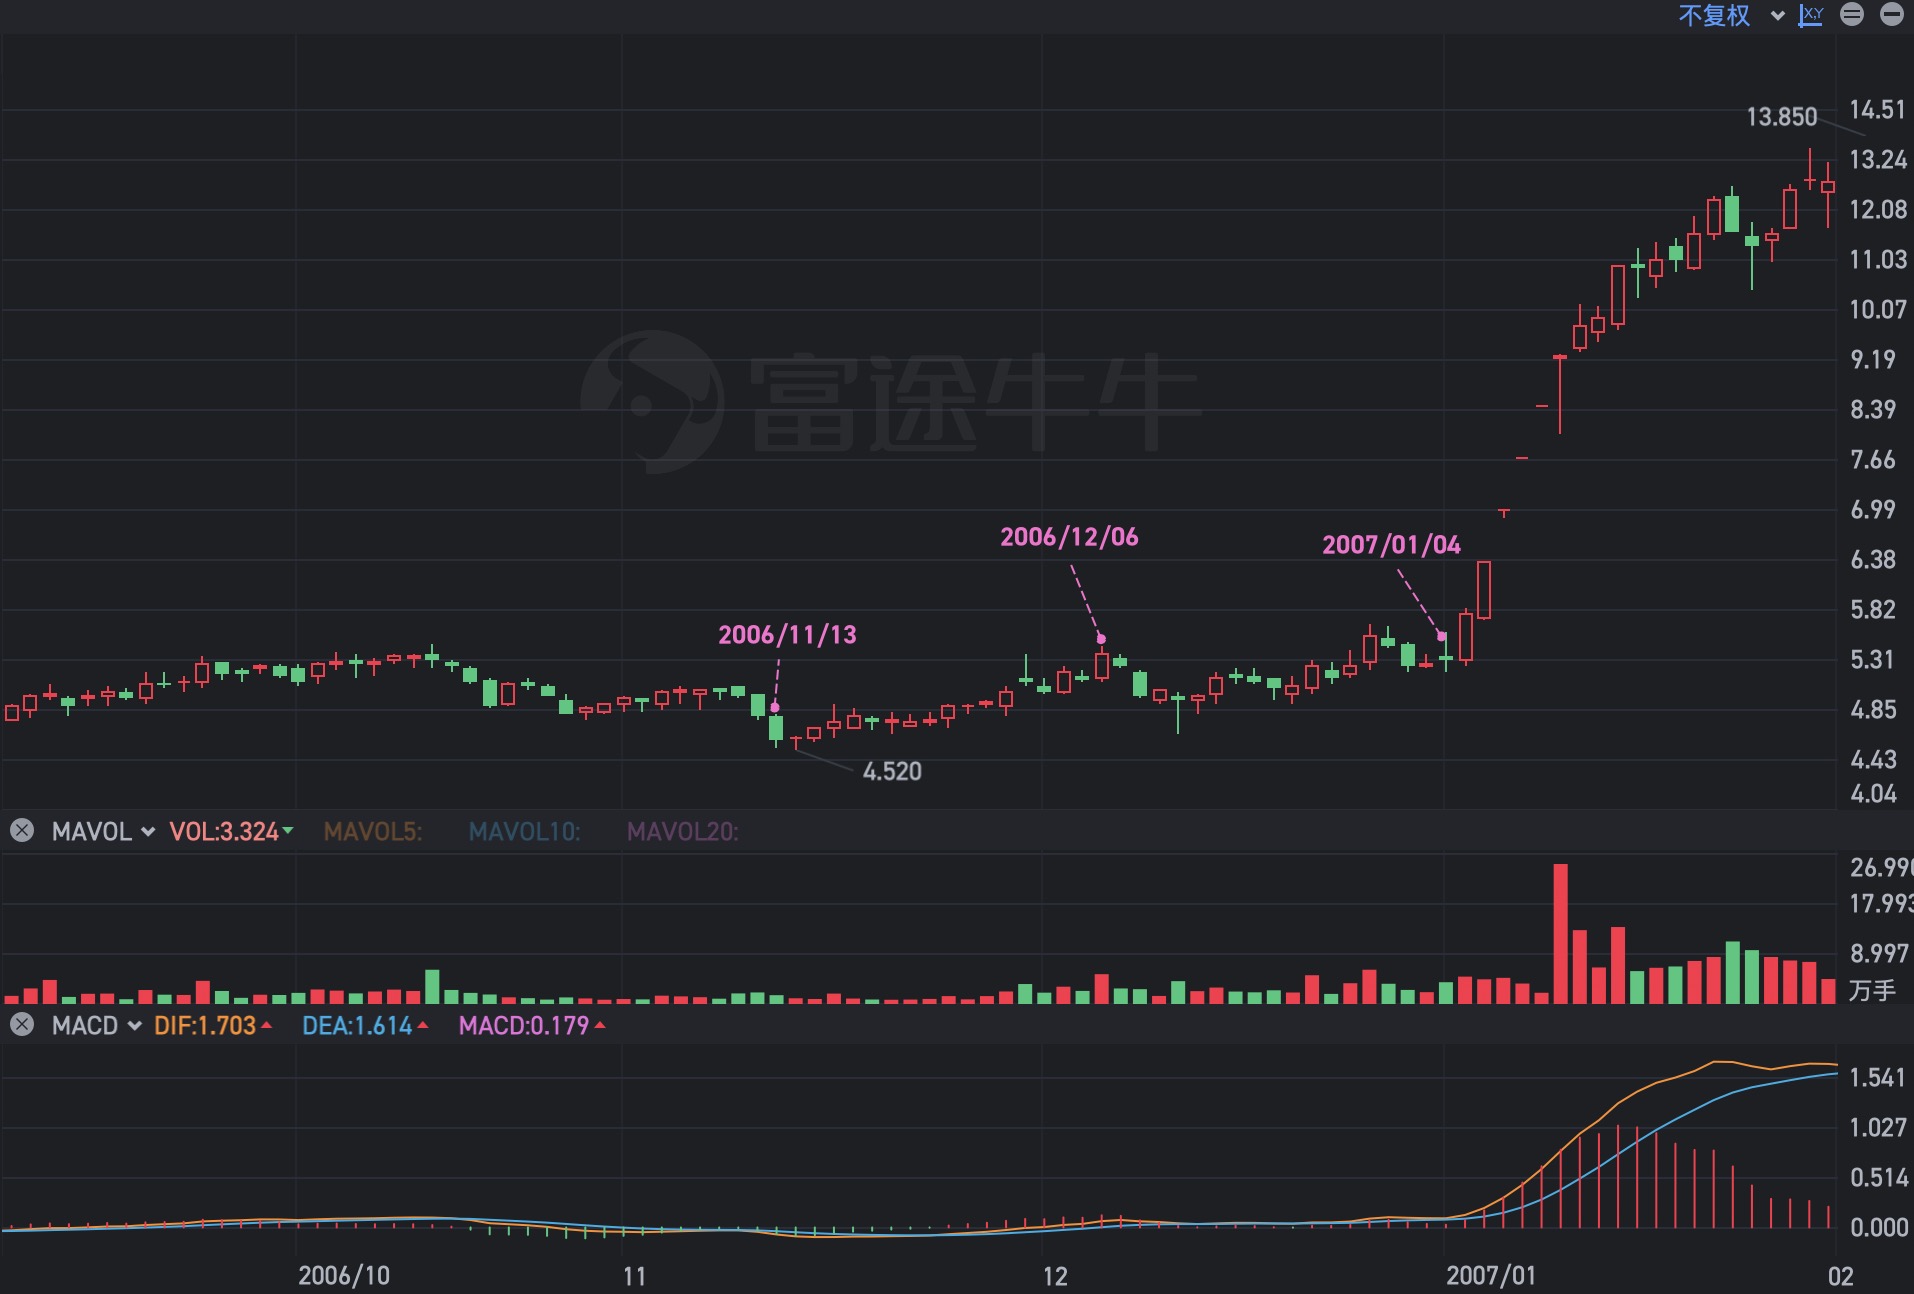
Let me illustrate with one of the strongest recent stocks: 000572. The strength of this stock is actually related to the double second-type buy points appearing on both daily and weekly charts. Correspondingly, there's a situation where MACD lingers around the zero axis twice to form the first hub. On the weekly chart, from 20051209 to 20060714, the first segment formed, and MACD also returned above the zero axis. Then the first hub began forming, ultimately creating a second-type buy point on 20061117, while the DIF/DEA lines consolidated near the zero axis. Then it gradually broke free from this hub, and the DIF/DEA lines gradually pulled up. On the daily chart, the process is identical — from 20061113 to 20061206, the first segment on the daily formed, and MACD returned above the zero axis. Then three segments of pullback ended on 20070104, forming the first hub, followed by a breakout, with MACD pulling up from near the zero axis, breaking free from the first hub. The subsequent movement of this stock is quite simple: first form at least a daily-level new hub, with MACD pulling back to the zero axis, then break through again, divergence appears, creating a major adjustment that leads to at least a weekly-level hub, causing MACD to pull back to the zero axis, then pull up again, divergence appears, and the subsequent adjustment will be enormous — at least monthly level.
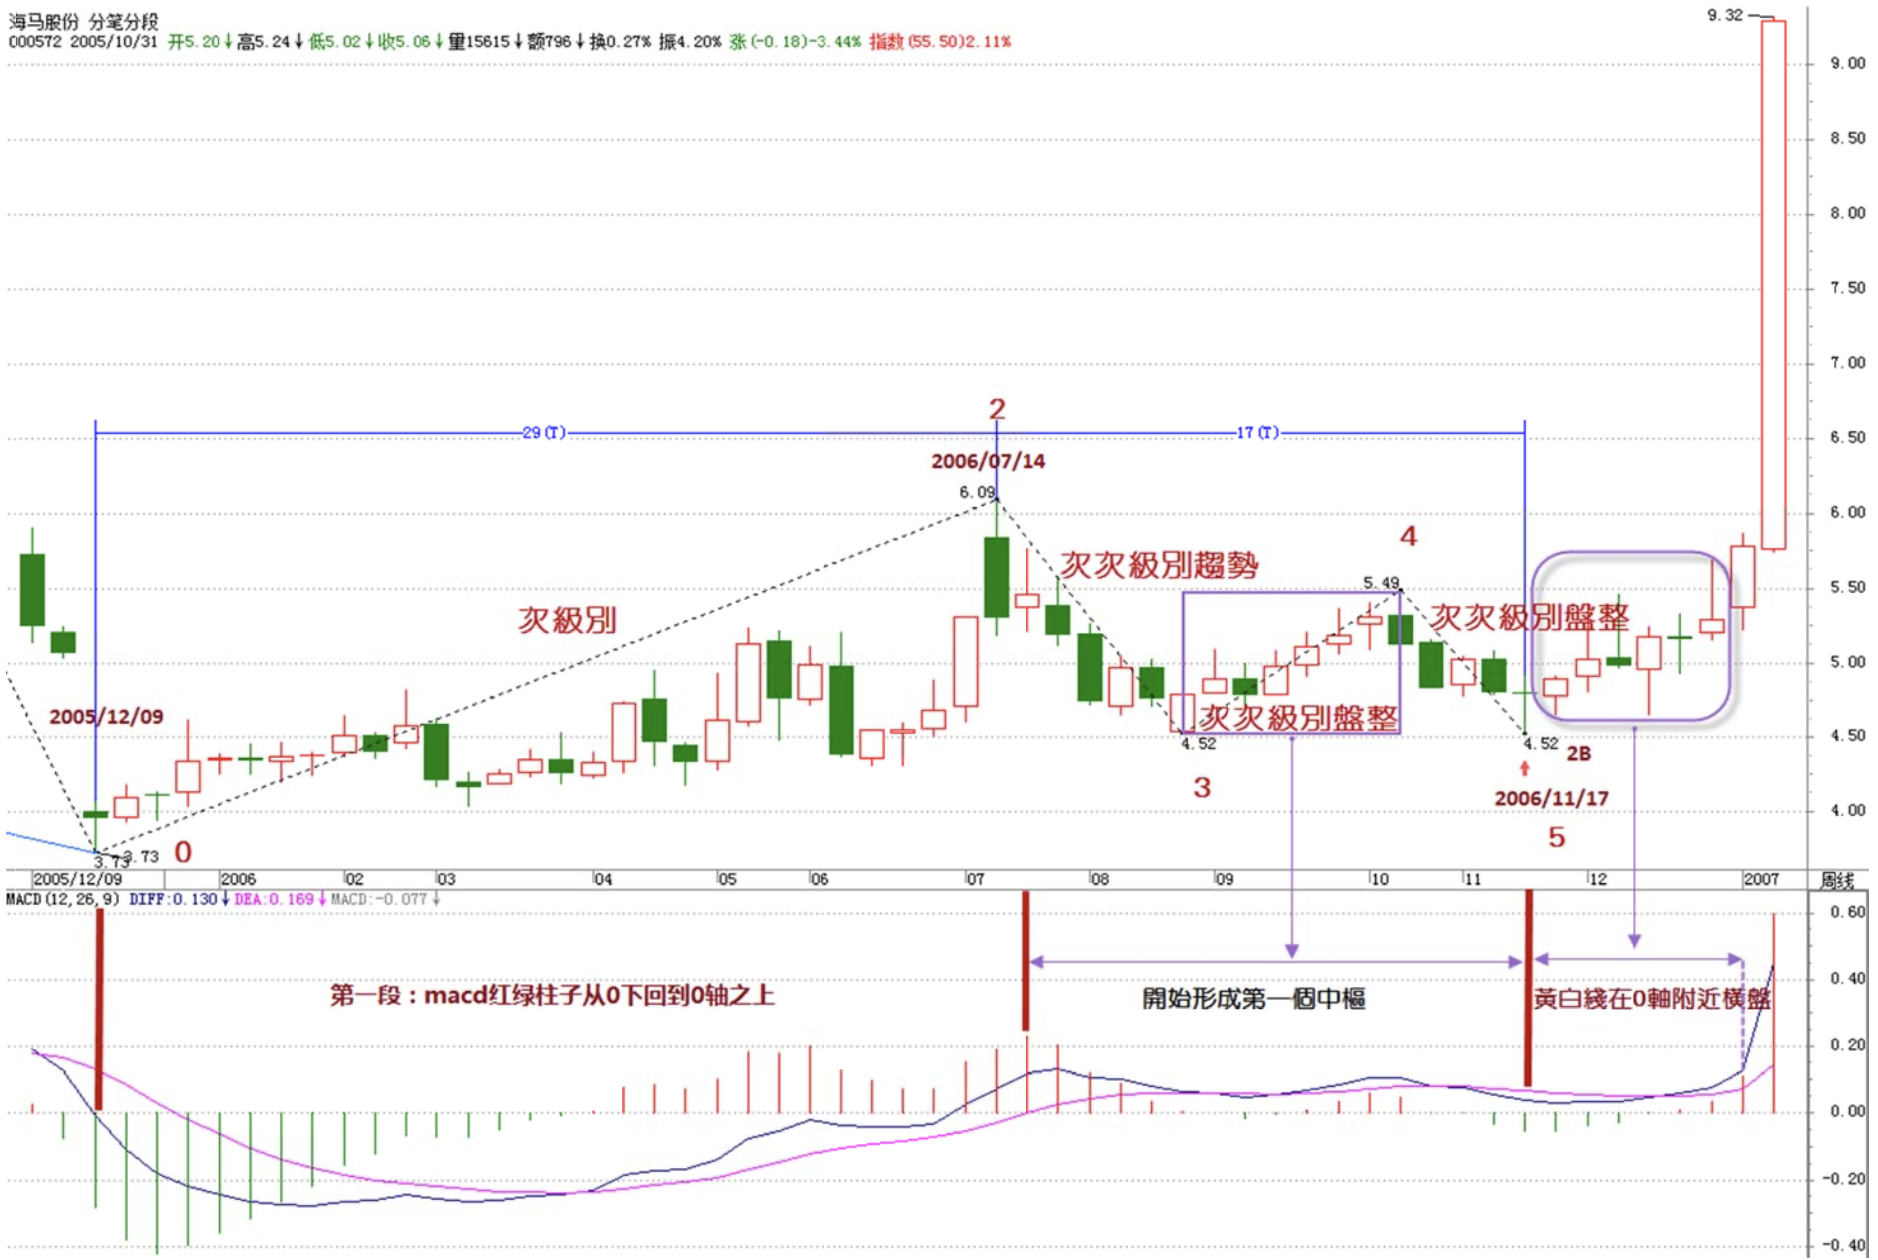
One must note that the hub formed by MACD consolidating near the zero axis and pulling back to the zero axis is not necessarily a hub of the corresponding level — it's at least that level. For example, a daily MACD's zero-axis consolidation and pullback constitutes at least a daily hub, but it can also constitute a weekly hub, which would mean three segments of movement appear on the daily chart.
Replies
缠中说禅 2007/1/23 15:29:52
[Anonymous] 花蝴蝶
2007-01-23 15:20:30
Hello Miss Chan!!
Today was so nerve-wracking.
==
What's there to be nervous about? Didn't this ID already say yesterday that the gap would be filled? The key is to design your own trading rhythm. If you don't have time for short-term trades, then just skip it.
缠中说禅 2007/1/23 15:34:14
Today a red flower goes to this person, because at least by noon he mentioned filling the gap, proving he's developed some feel for the short-term rhythm. Short-term trades are created by going back and forth — selling without buying back is worse than not selling at all. The key is finding the right position to buy back.
[Anonymous] 罗锅
2007-01-23 11:37:14
[Anonymous] stone
2007-01-23 11:34:13
It broke below 2870! According to the blogger, the adjustment has gotten bigger — should we exit now?
BBBBBBBBBBB
You should have sold at the morning's high open!!!!!!!!!!!!!!! Didn't Math Girl say!!!!! By Thursday at the latest, the gap would definitely be retested!!!!!!!!!!!!!!!!!! I'm saying this is just an adjustment!!!!!!!!!!!!!!! Good stocks have nothing to fear!!!!!!!!!!!!!!!!!!!!!!!!!! Just watch for 5-minute divergence and you can buy back!!!!!!!!!!!!!!!!!!!!!!!!!!!!!!!!!!!!!!
缠中说禅 2007/1/23 15:37:20
[Anonymous] 猫猫
2007-01-23 15:30:48
Blogger dear, another question
Regarding the issue of trends and consolidation: within a certain level, are the hubs in a trend and the hubs in consolidation at the same level?
I find it very hard to distinguish between the concepts of hubs and consolidation — could you help explain?
==
The consolidation hub connecting two same-direction trends must of course be a higher level than the hubs within those two trends — otherwise it would be absorbed into one of the trends. Just focus on understanding hubs. Don't worry about consolidation. Once you clarify hub establishment, extension, expansion, and regeneration, you'll naturally understand consolidation.
缠中说禅 2007/1/23 15:41:35
[Anonymous] 缠fans
2007-01-23 15:30:47
Miss Chan, today the market didn't touch the 2841.74 hub upper bound from January 10th, and the gap wasn't filled — does this mean it was just a scare, and we can start looking for buy points to enter?
==
Your rhythm is completely off. You should have sold in the morning and bought back in the afternoon. The logic is crystal clear. Since it definitely had to test the gap, when the market opened at 2970 in the morning, it obviously meant there was at least 100 points of downside testing space — isn't that the best short-term trading opportunity?
Note that short-term trades can be buy-then-sell, or sell-then-buy-back. Money and stocks must constantly flow — that's how you do short-term trades. Otherwise just stick to long-term, or at least wait for a daily chart divergence before doing anything.
缠中说禅 2007/1/23 15:47:04
[Anonymous] 大盘
2007-01-23 15:41:18
Today, although it retested the 2869 high (the highest high of the hub's three segments), it didn't seem to touch the daily hub high of 2840. I'm not sure if my judgment of the hub is still wrong. Please advise, blogger.
==
Since it touched the highest point, there's a danger of it evolving into a larger hub. But if the retest happens twice and the next time doesn't break below this level, the breakaway from the hub gets confirmed. So right now it's an oscillation period. From a short-term perspective, this is the most fun — sell when it can't go up, and as long as it doesn't effectively break below 2870, buy back. Once the retest is confirmed as holding, it'll go straight up, or at least oscillate upward, and you won't see the hub below again.
缠中说禅 2007/1/23 15:48:39
[Anonymous] 猫猫
2007-01-23 15:44:36
2. Does every trend necessarily have a hub at its endpoint?
==
Not necessarily. If there's a sudden gap up or gap down, a hub can form only below. The hub's position is not fixed — it can be anywhere. But as long as it's a complete trend type, there must be at least one hub.
缠中说禅 2007/1/23 15:56:11
[Anonymous] 如初见
2007-01-23 15:46:15
000629, 1-minute chart, 14:54 showed divergence — new high, smaller area, pullback to zero axis, short red bars. But I'm not sure. Chan MM, please take a look. If it is, I'll sell half at tomorrow's open. Thanks.
===
What you should always consider first is what the larger timeframe shows, before looking at the 1-minute chart. Except for the final sprint and warrants, there's generally no need to look at the 1-minute chart. Of course, a 1-minute divergence will definitely cause a pullback during the session, but the key is that if you don't buy back in time, the opportunity passes in an instant. So unless you're glued to the market every second of every day, ultra-short-term trades aren't necessarily worth doing.
Short-term trading is for reducing cost basis. To make big money, the key is the medium-term view.
For example, with this ID's pharmaceutical pick — if you look at 1-minute divergences, as long as your hands are a bit slow, you definitely won't have a chance to buy back. At least up to today, that's been the case.
The harder it is to do short-term trades on a stock, the better a medium-term stock it is. Many people always say they once bought a certain stock, sold it, and it went up another 1x, 2x, 3x — is this kind of thing rare?
缠中说禅 2007/1/23 16:00:15
[Anonymous] 大盘
2007-01-23 15:55:41
Chán Zhōng Shuō Chán
2007-01-23 15:47:04
[Anonymous] 大盘
2007-01-23 15:41:18
Today, although it retested the 2869 high (the highest high of the hub's three segments), it didn't seem to touch the daily hub high of 2840. I'm not sure if my judgment of the hub is still wrong. Please advise, blogger.
-----
I think I understand a bit now. If the low of the next 30-minute downward trend type is above 2870, then basically the market should continue rising and oscillating upward (oscillating above 2870).
===
Correct, but operationally you can't do it this way. Instead, whenever a surge loses momentum — that is, when a short-term divergence appears — you should get out. If the retest doesn't break, buy back. Don't wait for the final result — if by then it breaks, wouldn't it be too late to act?
But you must note that this ID is talking about people with small capital who can go all-in every day. For those with large capital, you can only do partial short-term trades to lower costs. This depends on capital size, and even more on what stocks you hold. Some stocks rise even more enthusiastically when the market drops, so short-term trades must be based on the specific movement of each individual stock — you can't generalize.
缠中说禅 2007/1/23 16:03:56
Study this ID's theory well. Whoever truly masters it — the opportunities to make big money are still ahead. Even if you only have enough for one lot of index futures, it's enough to make you a person free from financial pressure within N years.
To become a person, you must first escape the pressure of money — to be free with respect to money. Study hard.
This ID has to go to the place in Beijing with the most high officials — those in Beijing know which street this ID is talking about. Signing off first, will be back tonight.
Goodbye.
缠中说禅 2007/1/23 15:28:03
Today's movement was nothing special — just filling the gap. Since 2870 was touched, there's still the possibility of it evolving into a larger-level hub. Continued oscillation tomorrow would be perfectly normal. Currently, the simplest judgment is to watch the 5-day moving average — as long as that line isn't broken, things should be fine. Otherwise, a large-level hub continuation will be inevitable.
What can free the market from this unfavorable movement is crucially dependent on financial stocks. Since Societe Generale's offering price is perched high up there, how can financial stocks not get restless? As this ID has said many times, bank stocks still have a long road ahead for the medium term — look at how many banks still need to come back and list. After Chinese New Year, CITIC is coming back, and behind that, CCB, Bank of Communications and the like — there are plenty.
Nothing special to say about individual stocks. Even old sectors like military and non-ferrous are becoming active again, which simply indicates that even if the broader market has some short-term oscillation, the medium-term outlook is still fine.