Announcement: Blog on 5-Day Break
2006/12/29 15:05:47
The stock market is closed for five days, and this ID is also heading out for five days of indulgence. The blog has no choice but to follow the market's break. Everyone should rest well too — next year we'll continue making a ruckus! This ID is rushing to catch a flight now.
Happy New Year
If you have questions, just drop them in the replies first. This ID will answer after returning from indulgence.
Replies
缠中说禅 2007/1/3 20:23:18
[Anonymous] 空读
2006-12-30 03:28:21
Learning by doing — everyone, look at 600050 China Unicom's 30-minute chart. Comparing 12/28 11:30 with 12/07 15:00, isn't there a divergence? This time it's two trends of the same level and same direction — isn't this the first sell point?
[Anonymous] 空读
2006-12-30 03:37:29
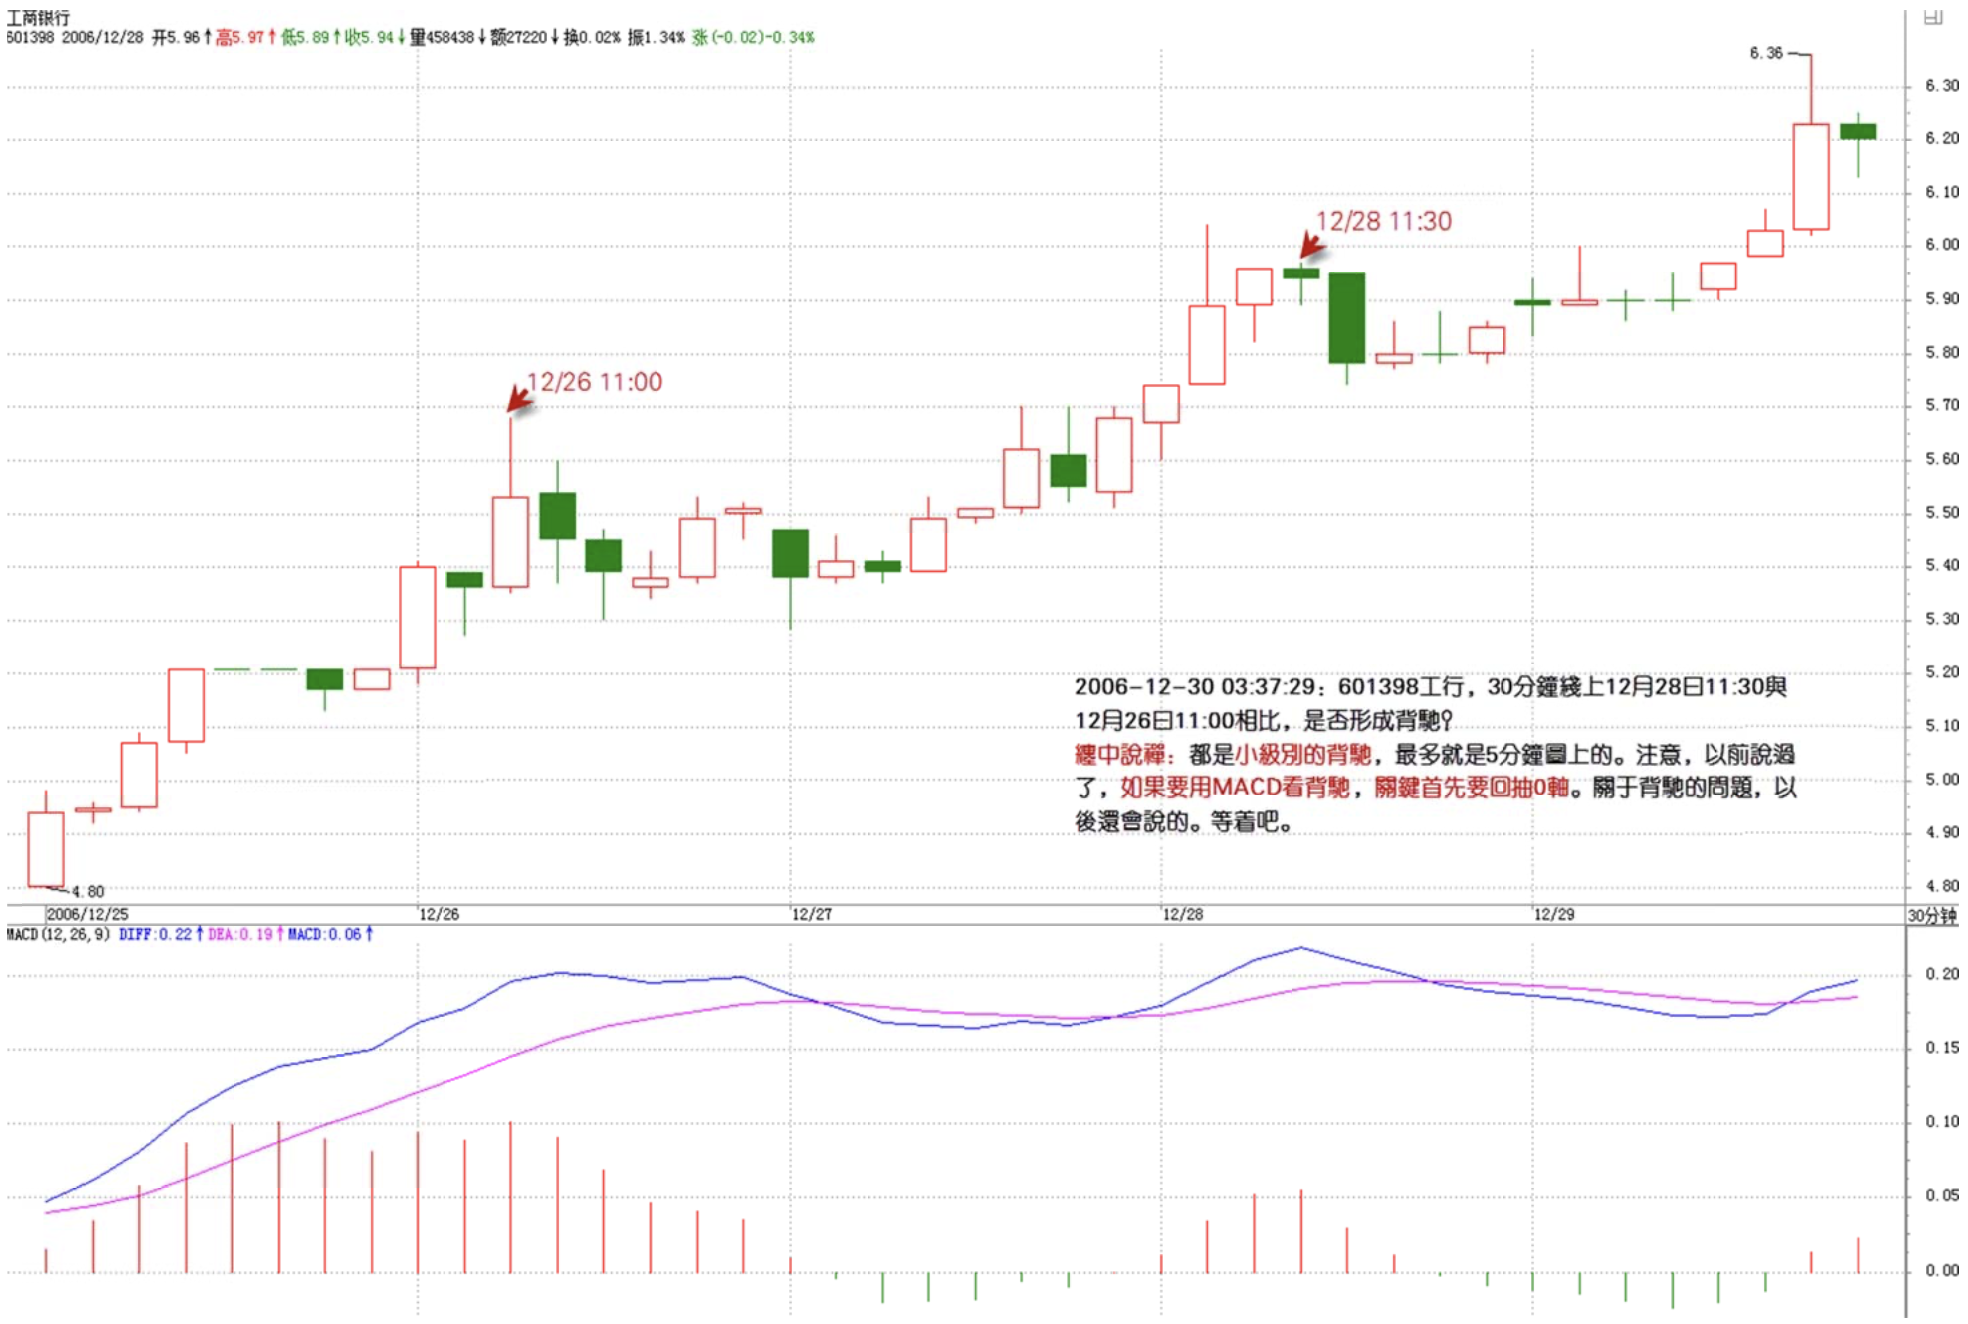
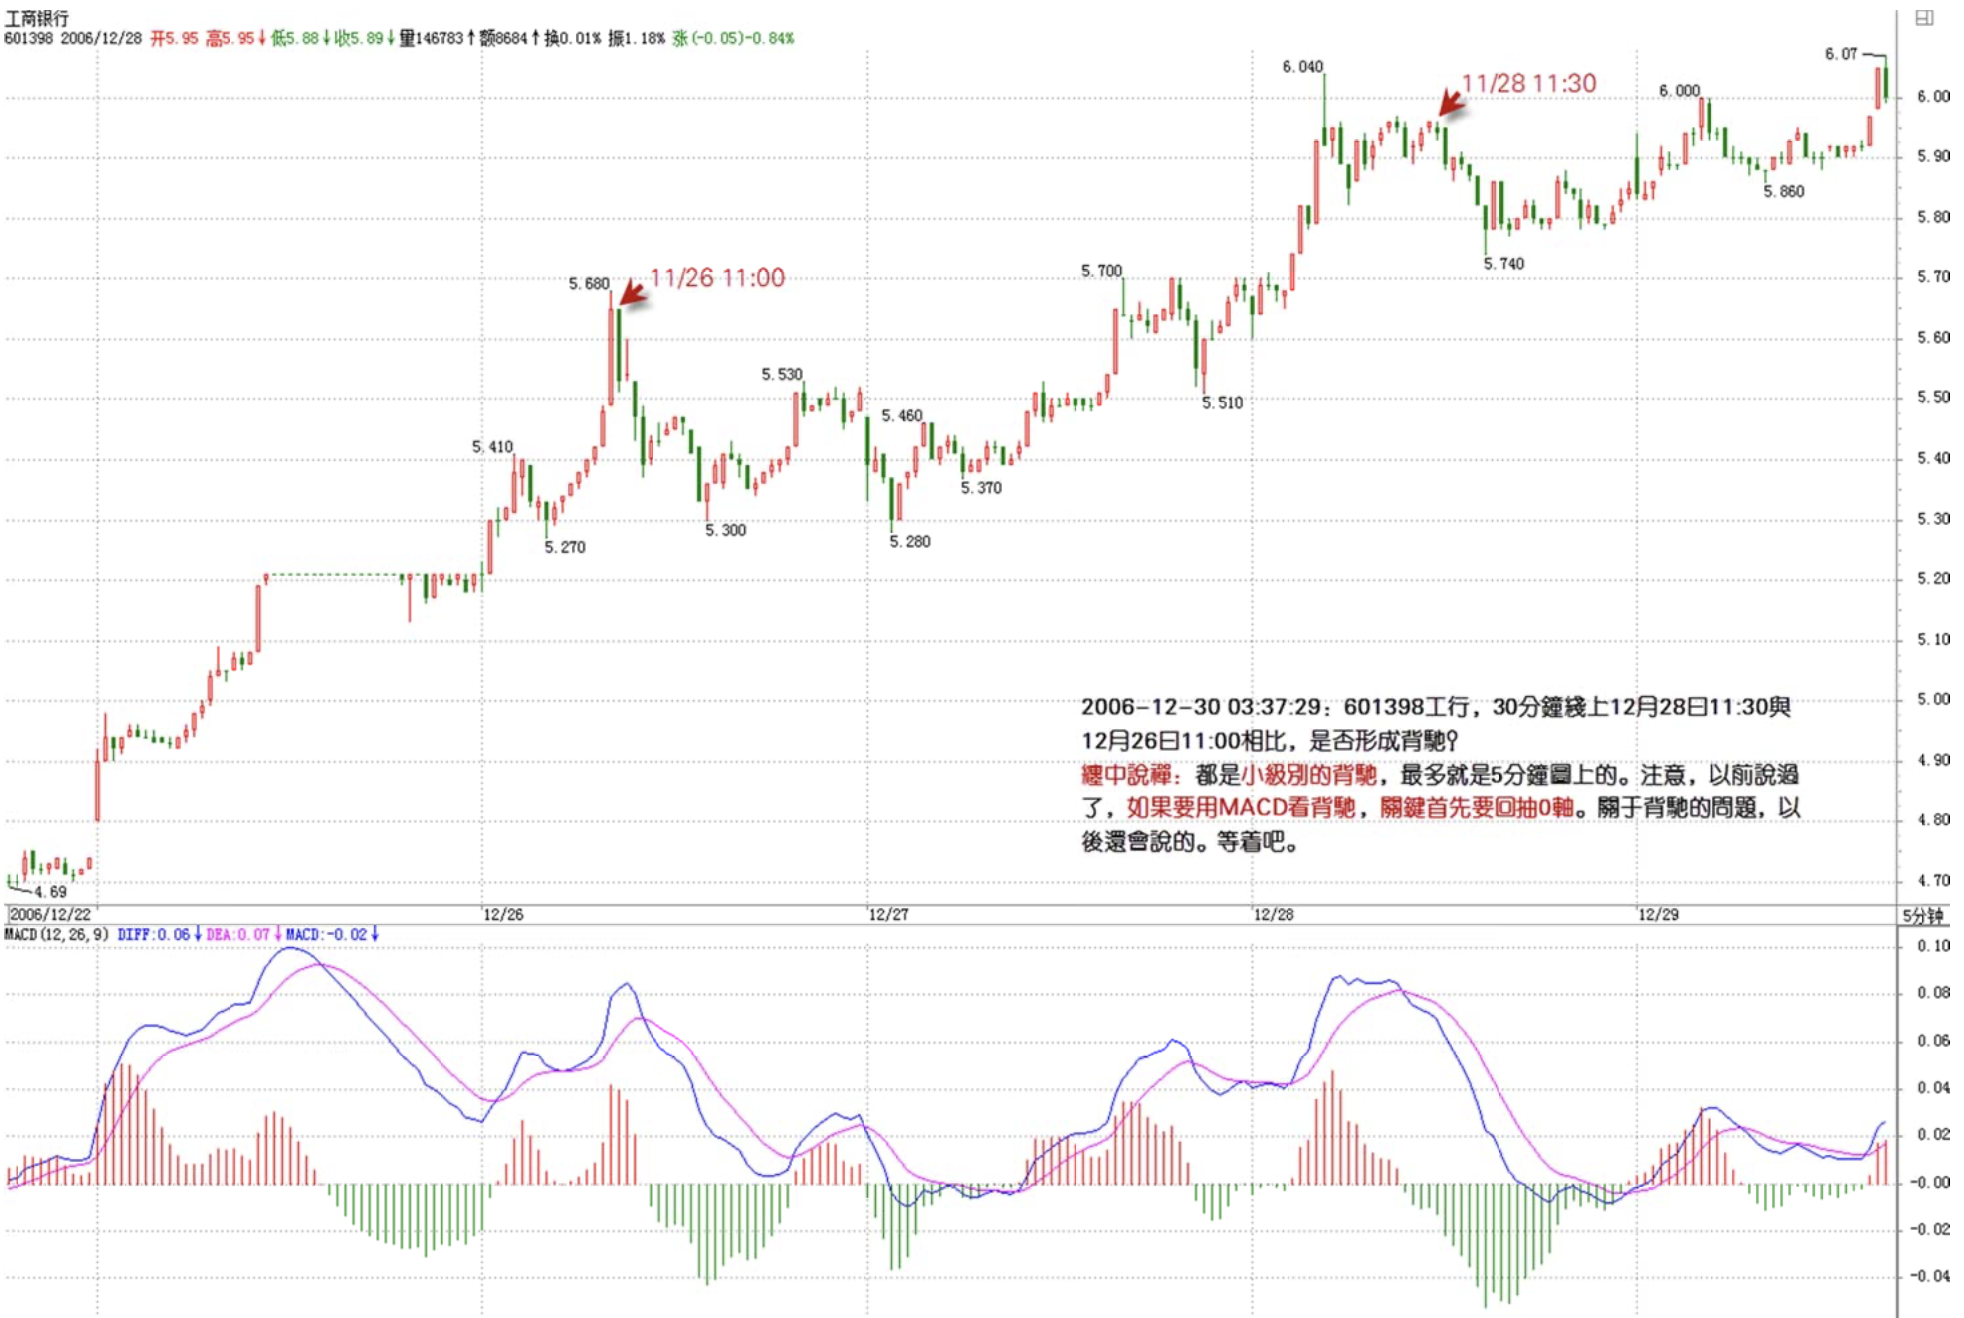
On 601398 ICBC's 30-minute chart, comparing 12/28 11:30 with 12/26 11:00, is there a divergence?
===
These are both small-level divergences, at most on the 5-minute chart. Note, as mentioned before, when using MACD to identify divergence, the key is that it must first pull back to the zero axis. Regarding divergence, more will be discussed later. Just wait.
缠中说禅 2007/1/3 20:25:19
[Anonymous] 摄影之友
2006-12-30 23:28:55
Blogger:
Although the New Year is approaching, I dare not slack off. Coming from a humanities background, I'll be the slow bird that flies first. Today I printed out Lessons 11-19 to study carefully.
Question and understanding: Started holding 000999 on December 20, 2006. Reasons as follows:
- On the 30-minute level chart, December 20 is a low point formed after entering a female-on-top entanglement. Bought in at 6.10 yuan.
- On the 5-minute level chart, from 12/20 (13:55) to 12/22 (10:35) it's in an upward trend;
Here I have a question: These two upward trends should have shown divergence. Using the "Chán Zhōng Shuō Chán" trend force and divergence concepts, and the auxiliary volume bars and MACD, it's definitely confirmed. But why don't the corresponding DIF line heights contradict? Namely, 7.32 yuan corresponds to DIF of 0.23, while 6.71 yuan corresponds to 0.12. - Afterward on the 5-minute level chart, from 12/22 (after 10:35) to 12/27 (10:25), a "Chán Zhōng Shuō Chán" trend hub formed. The range is (7.46, 7.85). The subsequent movement has been oscillating around this hub without departing from it.
- On the daily chart, it's basically been rising along the 10-day moving average. From 12/19 to 12/26, volume shows strong momentum; after the 27th, volume started shrinking, but the upward trend hasn't changed;
Conclusion: Hold!
Blogger, is my understanding correct? Thank you!~~~
===
Even if holding, if your short-term skills are decent, you can play some short-term trades around the hub's upper and lower bounds. This way your capital stays more flexible. Of course, if your skills aren't there, forget it.
缠中说禅 2007/1/3 20:26:54
[Anonymous] 笨笨猪
2006-12-30 23:56:25
[Anonymous] flat 龙
2006-12-30 19:55:32
I roughly understand the OP's theory. One more question: During an uptrend, after a brief pullback (one to three days) followed by continued rallying to new highs — does this count as a trend hub? Thank you, eagerly awaiting reply!
-----------
This depends on the intensity of the pullback. It must at least break the 5-day moving average to count as a pullback; otherwise it's just a flying kiss, which doesn't count as a real adjustment and can't be considered a hub.
===
What do you mean "does this count as a trend hub"? The key is the level. Any pullback will inevitably produce a hub at some level — talking about hubs without discussing levels is completely meaningless.
缠中说禅 2007/1/3 20:32:11
[Anonymous] 无言
2006-12-31 15:04:49
Sister Chan, hello! Happy New Year! I have some questions from actual practice:
- The sub-level of the daily chart is 30 minutes, and the sub-level of 30 minutes is 5 minutes — is this correct?
- If a market maker is distributing or reducing positions at the daily limit price, can this be identified at the time? For example, the 002098 I bought hit the daily limit on the 28th, then opened lower on the 29th. I sold at 12.16. Fortunately it's a bull market now, so there's still an intraday spike to exit on. I looked at several nonferrous metal stocks — in the first half of the year, many had the pattern of hitting the daily limit one day, opening lower the next, and forming a top from there. 600483 these past two days is similar. In such situations, on the day of the daily limit, using the Chán Zhōng Shuō Chán principles, the sell point can't be identified either — must one decisively sell on the second day's low open?
- I pay great attention to volume when trading stocks. It's an important factor in my divergence analysis. Will such data be available when index futures come out? If strictly following technical requirements, what are the odds of winning at futures? Thanks!
===
The first question can be understood that way.
Regarding 002098 — study the 5-minute chart carefully, and you'll understand why this situation occurs. This ID's theory applies to any situation; the key is whether you've truly grasped it.
Volume isn't analyzed that way. This will be discussed later.
缠中说禅 2007/1/3 20:41:12
[Anonymous] 老无用
2007-01-01 23:31:34
Happy New Year, OP! Can't enjoy indulgence when the technique isn't mastered yet.
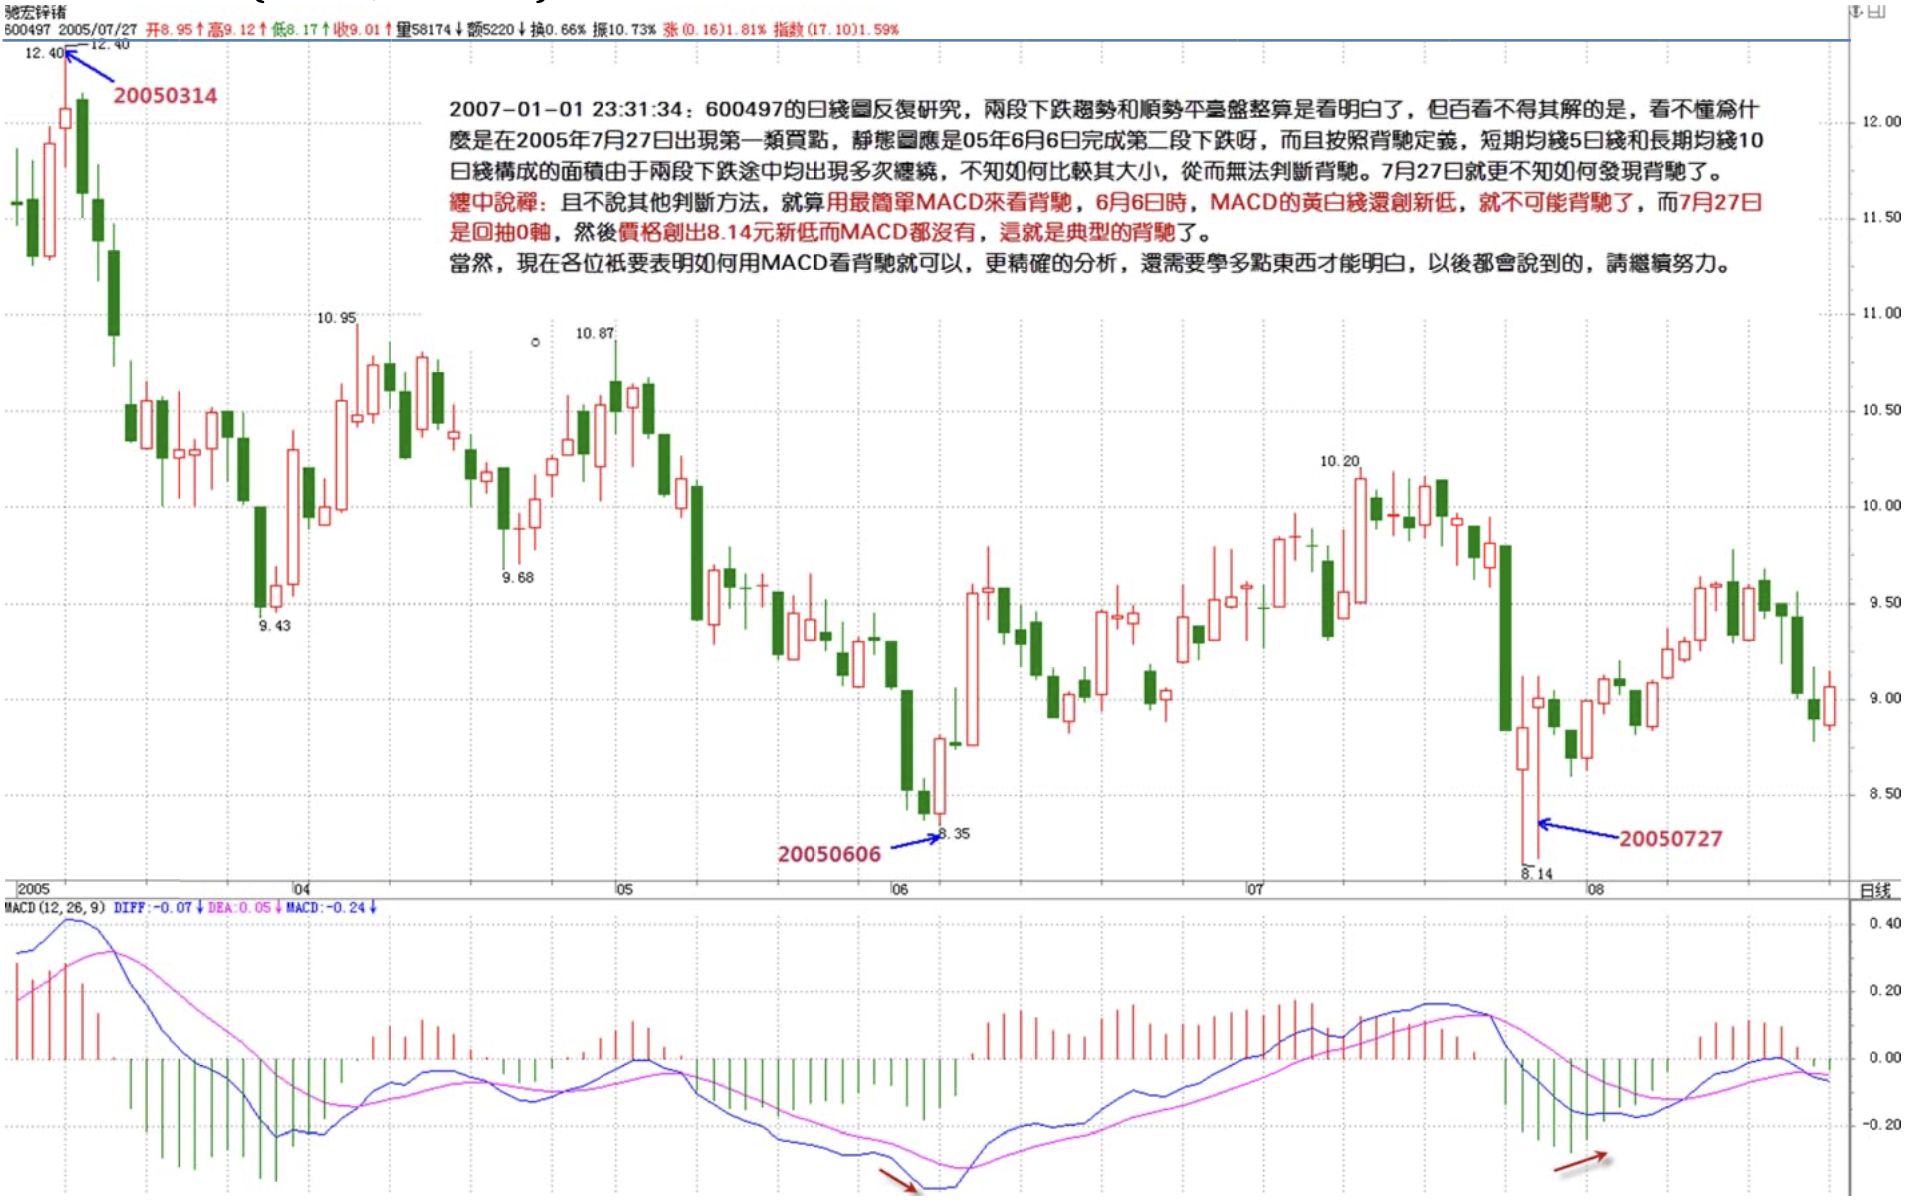
I've studied the daily chart of 600497 repeatedly. I think I understand the two downtrend segments and the horizontal consolidation platform, but what baffles me no matter how many times I look is: why does the first buy point appear on July 27, 2005? From the static chart, it appears the second downtrend segment was completed on June 6, 2005. Moreover, according to the divergence definition, the area formed by the short-term 5-day moving average and long-term 10-day moving average — since both downtrend segments had multiple entanglements along the way, I don't know how to compare their sizes, and thus can't determine divergence. As for July 27, I have even less idea how to identify divergence there. I'm slow-witted and sincerely hope for the OP's guidance.
===
Setting aside other analytical methods, even using just the simplest MACD — on June 6, the MACD yellow and white lines were still making new lows, so there couldn't possibly be divergence. On July 27, MACD pulled back to the zero axis, then the price made a new low at 8.14 yuan but MACD didn't — this is textbook divergence.
Of course, for now everyone just needs to understand how to use MACD to identify divergence. More precise analysis requires learning more, which will all be covered later. Please keep working at it.
缠中说禅 2007/1/3 20:43:19
[Anonymous] 盼望
2007-01-03 20:39:02
Dear OP:
You're finally back!
My holding 000423 E-Jiao has been suspended for an entire month. The market has rallied over 1,000 points and I'm going crazy, but there's zero news. What should I do?!
Please give your advice!
===
Being suspended now is actually good, especially for people who can't hold onto stocks. Once the suspension lifts and it reopens, it'll jump 50%. Without the suspension, many people would've run after a 10% gain. Suspension is a good thing — just wait. The bull market still has a long way to go.
缠中说禅 2007/1/3 20:46:09
[Anonymous] nn
2007-01-03 20:36:59
Good evening OP! Finally back from indulgence. Will tomorrow be Confucius or stocks? Thanks in advance! Did you enjoy the five days? The whole family enjoying domestic bliss, right?
===
Let's do Confucius first tomorrow. Tomorrow is a very important chapter — let's give Confucius some face. The day after, we'll talk stocks — I'll present a method for identifying the third type of buy/sell point, which is particularly relevant right now.
Here's a game for everyone: Guess which day ICBC's daily chart shows a third-type buy point.
缠中说禅 2007/1/3 20:48:02
[Anonymous] 楼主好人
2007-01-03 20:45:01
The OP is truly a good person — delivers on promises. Although I didn't ask any questions, I'm moved by the OP's spirit. Hope the OP continues to run this blog well, thanks!
==
Didn't get back to Beijing until the afternoon. Came back to find a world of ice and snow — pretty nice, Beijing's first snowfall this winter.
缠中说禅 2007/1/3 20:55:25
[Anonymous] whq999
2007-01-02 09:02:49
On 580991's 30-minute level, why can't the segment from October 23 to November 8 participate in forming a hub? Could the OP give a specific analysis for this segment? Thanks!
The so-called hub also corresponds to each level's chart. That segment might count as forming a hub for the 5-minute K-line, but not for the daily K-line. The daily K-line's hub should be between 0.556 and 0.990, which hasn't been broken through — it's still considered consolidation.
===
Whether it can or can't isn't for this ID to say — the key is whether it can develop three overlapping sub-level trends, which you can judge for yourself. It's objective — go judge it yourself.
As for the daily chart, it's still 0.677 to 0.803, still oscillating around it. But this isn't a precise statement. Once you learn what will be discussed later about forming larger-level hubs, there will be more precise terminology. Friday's post will cover this.
缠中说禅 2006/12/29 15:10:20
Go enjoy yourselves, goodbye!