Teaching You How to Trade Stocks 54: Analysis of a Specific Movement
2007/5/24 1:37:31
Today I shouldn't be discussing stocks — two consecutive days of stock talk is a waste of resources. However, someone raised a very representative question in the replies, so it's necessary to address it. Waiting around to watch football tonight is extremely boring. Browsing the internet for 419 entertainment would be less productive than just writing this post. Putting it up first so those waiting for the match can kill some boredom.
Note: before reading the analysis below, you can't be too hungry or too full, can't be too excited or too unexcited — otherwise you'll definitely get dizzy. Since most charts aren't this complex, after reading this, don't let your confidence take a hit. Instead, you should be a hundred times more confident, knowing that as long as you master this ID's theory, even such minute and peculiar charts can be analyzed precisely in real-time to guide operations. This should give you a clearer understanding of this ID's theory's absolute command over market movements. After that, it's just a matter of looking at more charts and more practice.
If your concepts aren't clear, looking at a chart like this will basically make your head spin. Alright, everyone start deep breathing, relax your minds — don't get a cramp.
This chart has a condition: d1=g2, d2=g4. Whether this condition exists or not actually doesn't affect the analysis, but having these conditions increases the difficulty. Here, we'll analyze starting from 18.5 yuan (designated as g0).
Yesterday we just discussed that when you analyze a chart at a certain level, you first assume sub-level movements are line segments. In this chart, except for the last one, every dngn and gndn+1 is below the 1-minute level, so they can all be treated as line segments without internal structure.
Let's enter the chart from g0 in real-time. Obviously, by the time we reach g1, since there are only two segments, no hub forms. Of course, if you're a tick-level operator, g1 constitutes a second-type sell point. When the movement develops to d2, a 1-minute level hub forms with the range [d1,g1]. Subsequent line segments are judged against this range to determine whether they're hub oscillation or third-type buy/sell points. Since d1=g2, the d2g2 segment belongs to the [d1,g1] hub's oscillation. As for the d3g3 segment, it obviously cannot reach [d1,g1], so g3 is a third-type sell point. Of course, if d1>g2 had been the case, then g2 would have been the third-type sell point.
Actually, since d1=g2, by the time the movement develops to d3, the associative law can be applied in real-time for multiple decompositions. At this point, we have the following equation:
g0g3=(g0d1+d1g1+g1d2)+d2g2+g2d3=g0d1+(d1g1+g1d2+d2g2)+g2d3
The parentheses contain the hubs. In the latter formula, the hub is [d1,g2] — essentially a single price point. This doesn't affect the earlier analysis that g3 is a third-type sell point. And this decomposition conforms more to common intuition, so it can be adopted.
Obviously, using MACD as auxiliary judgment, in terms of strength: g1d2>g2d3>g3d4 — relative to each other, the latter ones each represent consolidation divergence of the former. Of course, on a 1-minute chart, this kind of divergence has no operational significance. But if it were on a daily or even annual chart, it would.
When decomposing charts, there's one principle you must know: between two hubs of the same level, there must be a sub-level movement connecting them. For example, g0d4= g0d1+(d1g1+g1d2+d2g2)+(g2d3+d3g3+g3d4) — this kind of decomposition is not permitted, because the two same-level hubs in the parentheses have no sub-level connection between them. (Note: this is different from the case where three sub-levels constitute a hub. In that case, three parenthesized groups can be added together without sub-level connections between them, because that's the case of expanding into a higher-level hub — different from having two same-level hubs here.)
When the movement reaches d4 in real-time, based on the above principle, there are only two possible decompositions:
g0d4= g0d1+(d1g1+g1d2+d2g2)+g2d3+d3g3+g3d4
= g0d1+d1g1+g1d2+(d2g2+g2d3+d3g3)+g3d4
d4g4 is a normal bounce after consolidation divergence. For the first decomposition, this is just an intermediate state after the third-type sell point — moving toward a new same-level hub or forming a larger-level hub. The g4d5 segment is the same. For the second decomposition, since g4=d2, d4g4 is oscillation of the (d2g2+g2d3+d3g3) hub, and d5g5 is also oscillation of the same hub.
Someone might ask: in this situation, which decomposition to choose? Actually, either works. But with the first, since it's in an intermediate state with no definite standard, the guidance for short-term operations is insufficient. With the second, since it's hub oscillation, operational guidance is clear. So from the convenience-of-operation perspective, the second can be used. This is exactly the benefit of decomposition diversity that's been repeatedly emphasized. Generally speaking, for specific operations, you must always choose a decomposition that has clear present-moment significance — such as one that is hub oscillation, or has a third-type buy/sell point. But you must note: all decompositions must comply with decomposition principles, otherwise everything falls apart.
For the second decomposition, the d5g5 segment is hub oscillation. But for the first decomposition, d5g5 takes on a much more significant meaning. Because that intermediate state after the third-type sell point is completely eliminated with the appearance of d5g5 — a larger-level hub is now definitively established. Specifically:
g0g5= g0d1+{(d1g1+g1d2+d2g2)+(g2d3+d3g3+g3d4)+(d4g4+g4d5+d5g5)}
The three 1-minute hubs in the small parentheses overlap to form the higher-level 5-minute hub in the curly braces. The hub's range is [d2,g5]. Note: at this point, 1-minute movements should be treated as line segments. Everything in the small parentheses is a line segment, with high and low points being the endpoints of these line segments. With this established, subsequent movement is very simple. For example, g7 is a third-type sell point (d7g7 — within which the 2nd and 3rd K-lines have a significant pullback test, and then bars 5 and 6 are two small doji stars staying in that area. From this you know this definitely constitutes a 1-minute hub, meaning internally you can draw out three segments below the 1-minute level. Of course, if you had sub-1-minute charts you could confirm this. Especially for larger-level charts, you can look at smaller-level charts for confirmation at these moments. With experience, you generally know the situation without needing to check the smaller level.)
According to the second decomposition, the corresponding 5-minute hub isn't completed until g6. Thus: g0g6= g0d1+d1g1+g1d2+{(d2g2+g2d3+d3g3)+(g3d4+d4g4+g4d5)+(d5g5+g5d6+d6g6)}
The corresponding 5-minute hub range is [d3,g5]. In this case, d7g7 is also hub oscillation, but does not constitute a third-type sell point because the conditions aren't met. (Why? This ID has written so much — such a simple question, consider it homework for everyone to answer.)
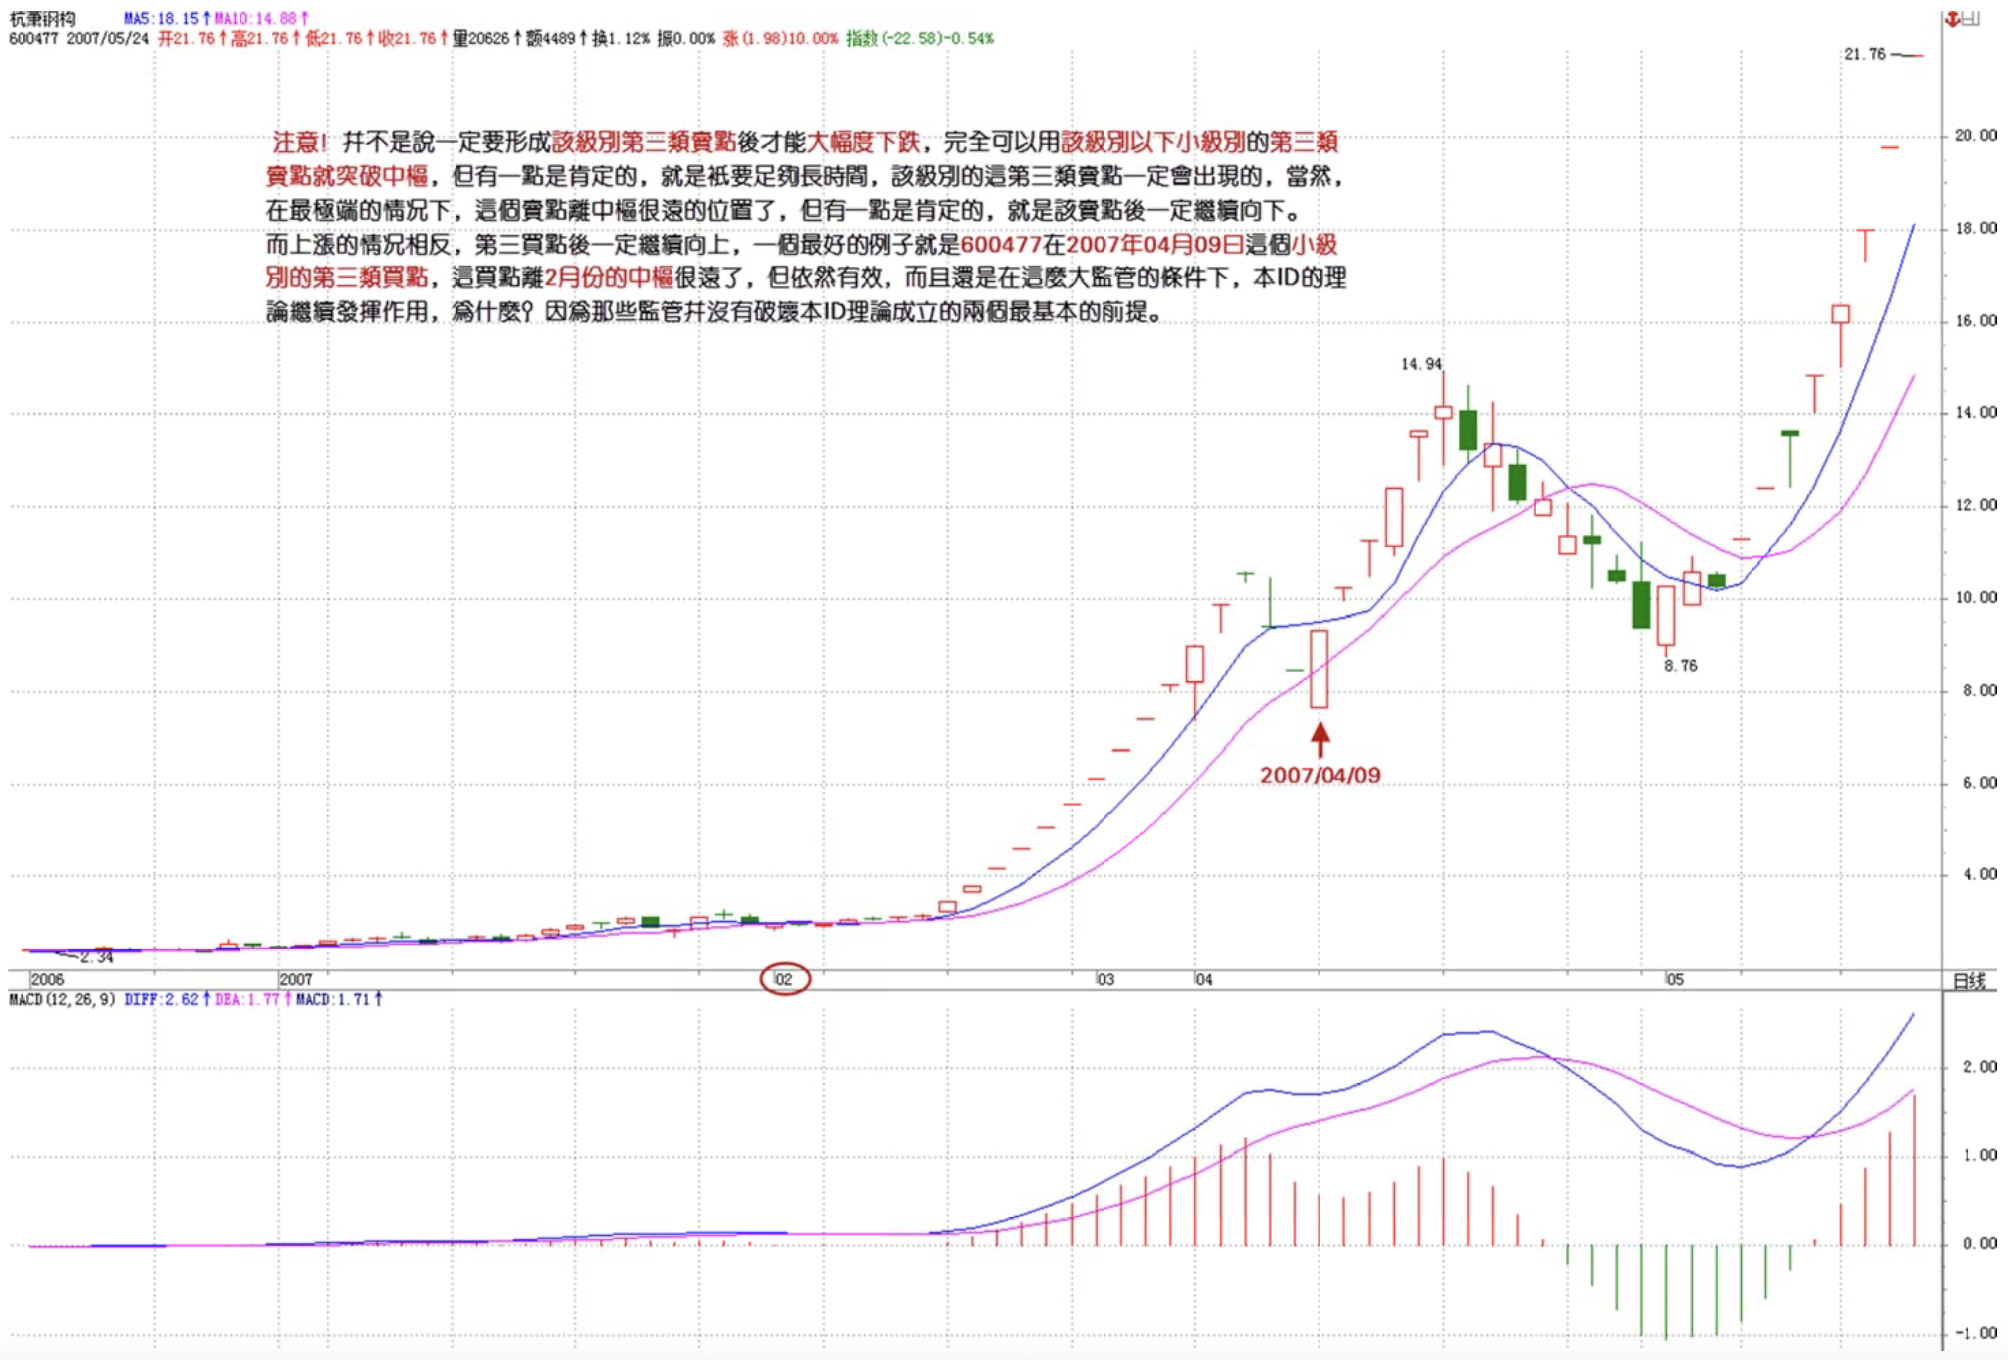
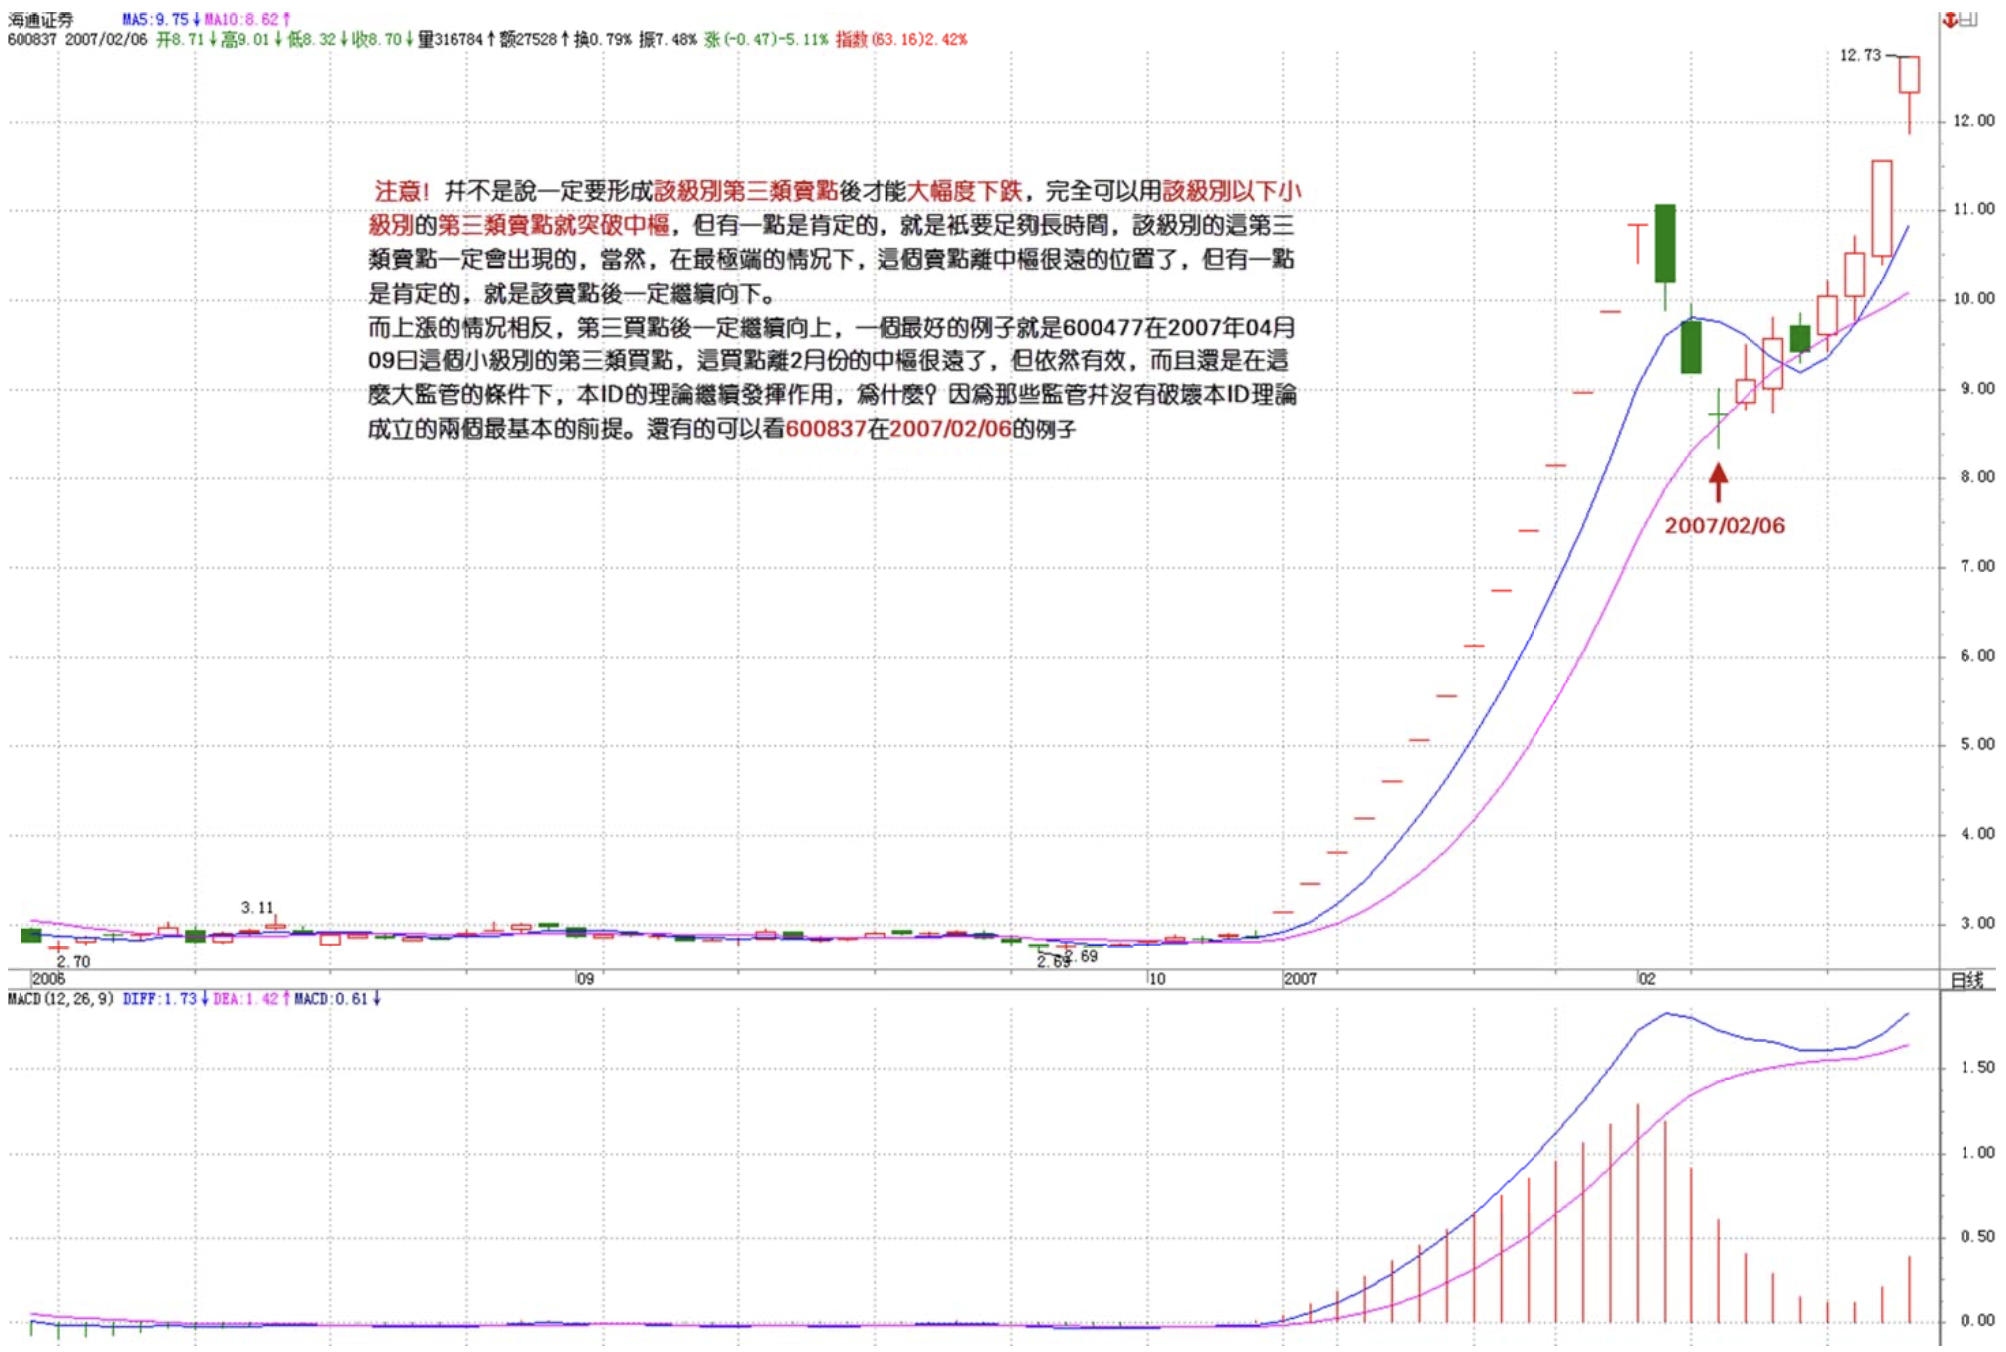
Note: it's not necessarily the case that a decline can only happen after a third-type sell point at that level forms. A sell point at a smaller sub-level can completely break through the hub. But one thing is certain: given enough time, the third-type sell point at that level will inevitably appear. Of course, in the most extreme case, this sell point could be very far from the hub. But one thing is certain: after that sell point, the decline definitely continues downward. For the upside, the reverse applies — after a third-type buy point, the rise definitely continues upward. A great example is 600477's small-level third-type buy point on 20070409. This buy point was far from the February hub, yet it was still effective — and under such heavy regulatory pressure at that. This ID's theory continues to work. Why? Because that regulation didn't destroy the two most fundamental prerequisites of this ID's theory. You can also look at 600837's example on 20070206. As for crash examples, they're hard to find now. Longer-term investors should all remember examples of manipulated stocks that, after a cliff dive, had the first bounce followed by an even bigger decline — that's the third-type sell point.
You must note: in situations of large, rapid fluctuations, a small-level third-type buy/sell point is sufficient to warrant entry. For example, for a breakout of a weekly hub, if you truly wait for a weekly-level third-type buy/sell point, that requires a daily-level departure and a daily-level pullback — when would that ever come? Therefore, even a 30-minute or 5-minute third-type buy/sell point is sufficient for entry. But there's a basic premise: such small-level large breakouts must be distinguished from ordinary hub oscillation. These situations are usually accompanied by the most violent and rapid movements, with corresponding cooperation in volume and momentum. If theory isn't firmly grasped, this kind of operation carries some risk — namely, confusion with ordinary hub oscillation. So those not proficient in theory should stick to the simplest approach. For example, for a weekly hub breakout, just wait patiently for the weekly third-type buy point. Note: for the sell point case, even those not proficient in theory should prefer working at the smaller level. Better to sell early than sell late. However, for large-level hubs, if you're still waiting for the third-type sell point to sell, your reaction is already extremely sluggish — where did the first and second sell points go? You can't just sleep anywhere in the market.
There's also an extreme example: large-amplitude hub oscillation. For instance, a 5-minute hub at 10,000 yuan — in the most extreme case, it could oscillate at the sub-level down to 0.01 yuan, then get pulled right back. Even consecutive limit-downs to 0.01 yuan, then consecutive limit-ups to 100,000,000 yuan, then back down to 10,000 yuan — this would still be 5-minute hub oscillation. Of course, such a pathological example can only exist in theory, but it shows the breadth of this ID's theory's coverage. So hub oscillation operations must follow the rule: sell when upward strength shows consolidation divergence, buy back when downward strength shows consolidation divergence. Not chasing rises and killing falls. Otherwise, if such a pathological case really appeared, you'd really be in trouble.
Regarding chasing rises and killing falls: in hub oscillation, you're definitely dead. But after a third-type buy/sell point, it's not necessarily so, because hub movement doesn't necessarily end right at your buy/sell position. Even if it does, there's still hub oscillation afterward. So in this situation, chasing rises/killing falls still has a chance of survival. But this is no long-term strategy. Why not use the perfectly good third-type buy/sell points, insisting on chasing instead? Even if you do chase, you can use small-level buy/sell points to enter. Why must you blindly guess?
Back to the two decompositions above: actually, for the g7 point, both decompositions reach the same conclusion. From the MACD auxiliary perspective, this pattern of twice pulling back to the zero axis without being able to break above, with the second set of red bars having smaller area — this also suggests trouble ahead. But multiple decompositions aren't a nuisance at all — rather, they're a great method for mutual corroboration. However, it must be re-emphasized: decompositions must conform to standards. You cannot decompose randomly.
By strict standards, if you can proficiently handle any chart, decomposing it in real-time according to the above standards to guide operations, then your study of this ID's theory can roughly be considered elementary school graduation. But since this might be too devastating to those lacking confidence or with relatively weaker analytical abilities, this ID has decided to learn from the education authorities and also do some enrollment expansion. Those achieving this level will all receive uniformly issued undergraduate diplomas. Furthermore, given that Peking University has recently degraded to the point where even the likes of Kong-man and Li-man can be professors, this ID has decided all diplomas will uniformly be branded as Peking University ones, all free of charge. This way, everyone should be able to study with peace of mind.
Enough nonsense. This ID is off for a late-night snack, then to watch the match.
Appendix:
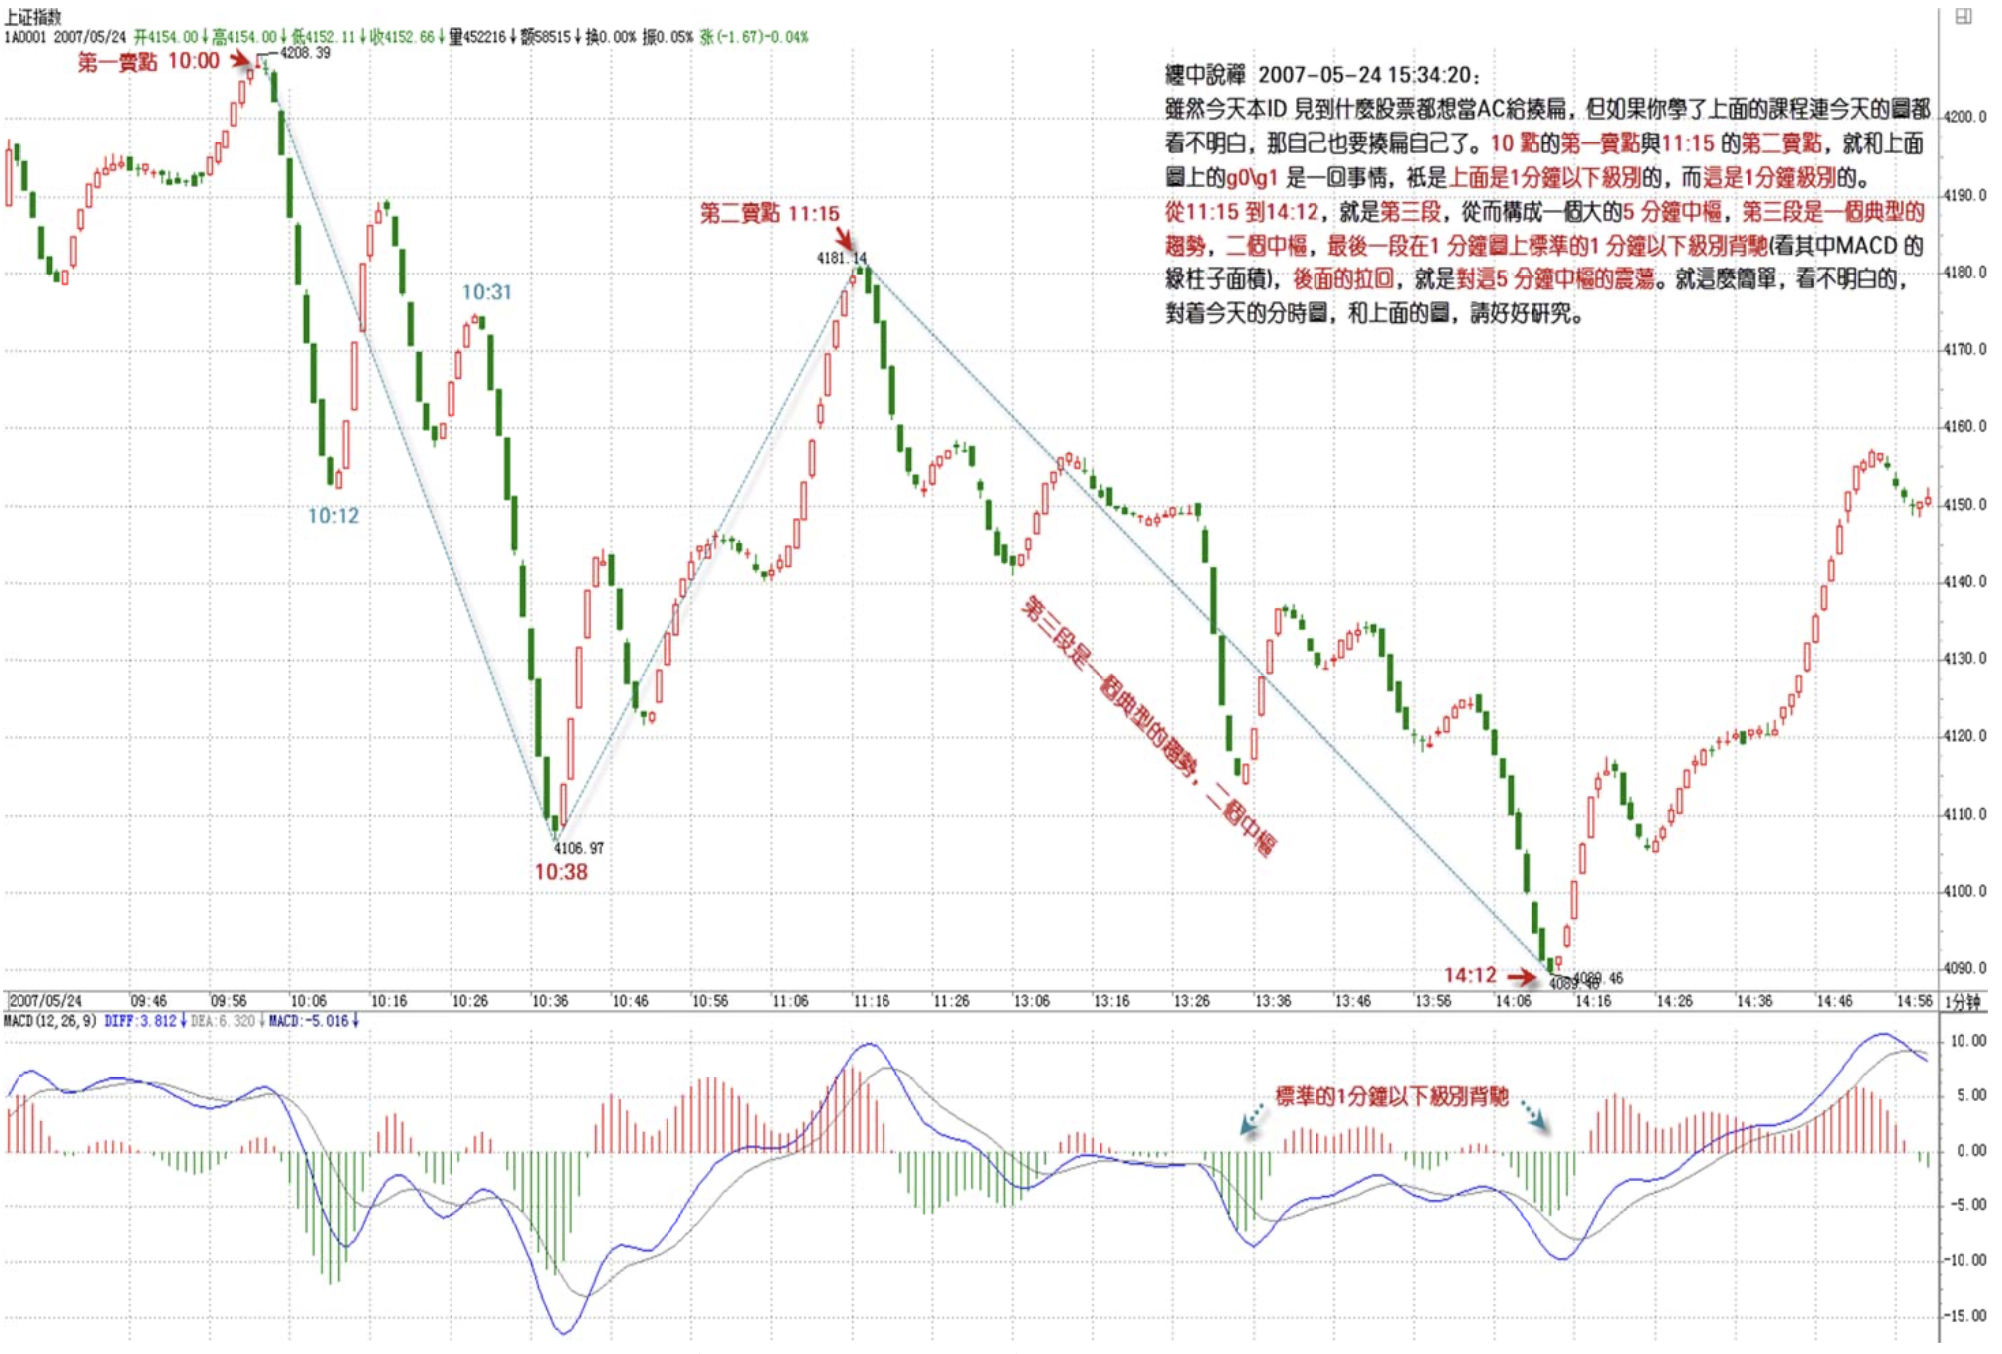
Although today this ID felt like flattening every stock like AC got flattened, if you've studied the above lesson and still can't understand today's chart, then you should flatten yourself. The first-type sell point at 10:00 and the second-type sell point at 11:15 are exactly the same as g0\g1 in the chart above, just that the above was at a level below 1-minute while today's is at the 1-minute level. From 11:15 to 14:12, that's the third segment, thus forming a large 5-minute hub. The third segment is a typical trend with two hubs, and the last segment shows standard sub-1-minute-level divergence on the 1-minute chart (look at the green MACD bar areas). The subsequent pullback is oscillation of this 5-minute hub. It's that simple. If you can't understand, study today's intraday chart alongside the chart above.
Understanding the above makes tomorrow's movement extremely simple — it's hub oscillation around this hub until a third-type buy/sell point appears. Just that simple. Simple like how yesterday's starting lineup should have been Crouch, but somehow it wasn't. Wouldn't you say someone's brain was waterlogged? As for the larger movement, it's still the 4129 point 1/2 line issue. The oscillation must hold for there to be any talk of upward development. This is a major premise.
Don't want to say anything about individual stocks. Please don't ask this ID whether to buy 635 now that it hit the daily limit. You must buy at buy points — same for short-term. Just like the previously weakest of those 16 stocks — 998 and 343. When 998 was consolidating in March/April, countless people were grumbling. With the time spent grumbling, why not ask yourself: what level is that consolidation's third-type buy point? Then analyze the details and find the trigger point. According to this ID's theory, the March 30 point wasn't hard to find at all — just look at the MACD changes below the daily chart. Same for other individual stocks. 343 — what was the March consolidation? MACD just pulled back to the zero axis and it launched. Is that standard enough? Why have time to complain but not to study?
When you have time, please study more. Skill requires real effort.
Replies
缠中说禅 2007/5/24 1:41:42
Transferring replies from the original post:
[Anonymous] 头大也得看
2007-05-24 00:28:04
Wow, boss, you work so hard!! It's this late and you're still caring about everyone!!
[Anonymous] 头大也得看
2007-05-24 00:32:36
Incredible!! With this spirit, what more needs to be said!!!!!!
Chán Zhōng Shuō Chán
2007-05-24 00:45:11
Won't be posting in the morning. Market commentary will be appended at close.
Sina was having issues today — posting was a bit tiring.
Heading out, see you later.
[Anonymous] Sina User
2007-05-24 00:56:31
Night owl! I used to know you'd be posting at Fatty Kong's and Li Ming's blogs in the wee hours. What can I say this time? There's a warm-current kind of feeling. Wishing you all the best!
缠中说禅 2007/5/24 1:42:09
[Anonymous] 新股手
2007-05-24 01:03:14
First!
I'm still studying!
[Anonymous] 替天行房
2007-05-24 01:07:32
Morning, boss!
[Anonymous] 新股手
2007-05-24 01:11:41
Anyway, I got into 139569 the other day. Holding for the near term — even if the washout makes me dizzy, I'm not getting out.
I'll skip the match. Going for a snack first, then staying up to study. Won't bother watching the intraday screen during the day either — to avoid cracking under the washout pressure and falling for the enemy's "honey trap." Haha.
[Anonymous] 大盘
2007-05-24 01:17:15
Thank you, blogger, for the specific analysis of the chart I submitted the other day. Everyone should seize this opportunity to study it carefully. If the images in the blogger's article aren't clear enough, you can access the original image at the following link, or reference the 1-minute K-line chart of 600151 from 13.07 to close on May 18.
www-itai-org-cn/zsid/zs7-htm (replace - with .)
[Anonymous] 替天行房
2007-05-24 01:25:50
Boss, have you seen the blog "I Returned from Central Asia — Perry Family"? Any comments?
[Anonymous] 好色小和尚
2007-05-24 01:32:31
I'm rooting for AC. Thank you, beautiful sister!
缠中说禅 2007/5/24 1:42:54
Won't post in the morning. Market commentary will be appended at close.
Getting ready to watch the match.
Heading out, see you later.
缠中说禅 2007/5/24 15:34:20
Although today this ID felt like flattening every stock like AC got flattened, if you've studied the above lesson and still can't understand today's chart, then you should flatten yourself. The first-type sell point at 10:00 and the second-type sell point at 11:15 are exactly the same as g0\g1 in the chart above, just that the above was at a level below 1-minute while today's is at the 1-minute level. From 11:15 to 14:12, that's the third segment, thus forming a large 5-minute hub. The third segment is a typical trend with two hubs, and the last segment shows standard sub-1-minute-level divergence on the 1-minute chart (look at the green MACD bar areas). The subsequent pullback is oscillation of this 5-minute hub. It's that simple. If you can't understand, study today's intraday chart alongside the chart above.
Understanding the above makes tomorrow's movement extremely simple — it's hub oscillation around this hub until a third-type buy/sell point appears. Just that simple. Simple like how yesterday's starting lineup should have been Crouch, but somehow it wasn't. Wouldn't you say someone's brain was waterlogged? As for the larger movement, it's still the 4129 point 1/2 line issue. The oscillation must hold for there to be any talk of upward development. This is a major premise.
Don't want to say anything about individual stocks. Please don't ask this ID whether to buy 635 now that it hit the daily limit. You must buy at buy points — same for short-term. Just like the previously weakest of those 16 stocks — 998 and 343. When 998 was consolidating in March/April, countless people were grumbling. With the time spent grumbling, why not ask yourself: what level is that consolidation's third-type buy point? Then analyze the details and find the trigger point. According to this ID's theory, the March 30 point wasn't hard to find at all — just look at the MACD changes below the daily chart. Same for other individual stocks. 343 — what was the March consolidation? MACD just pulled back to the zero axis and it launched. Is that standard enough? Why have time to complain but not to study?
When you have time, please study more. Skill requires real effort.
缠中说禅 2007/5/24 15:43:17
[Anonymous] 天地之间
2007-05-24 15:39:27
Hello, Sister Chan,
Could you please give guidance on Unicom's medium-term trend? Recently it's been...
==
Nothing to say about Unicom. It's a standard channel-style rise. If you have the technique, capture oscillation buy/sell opportunities at the upper and lower channel boundaries combined with short-term divergence. If you lack the technique, just hold it — don't sell as long as the lower boundary isn't broken.
缠中说禅 2007/5/24 15:50:05
Snow Wolf
2007-05-24 15:43:16
Please, blogger — regarding the broad market:
On today's 1-minute chart, the segment from 10:38 to 11:16 — it didn't form consolidation divergence either?
For a point like 11:16, how should it be analyzed?
==
Why must it be consolidation divergence? That's just one of the more common situations. Why can't it be a small-level-to-large-level transition? Moreover, referencing the first segment's hub, it pulled back exactly to the corresponding position. And using a large hub's oscillation starting from 05221100, the judgment becomes even easier.
Charts exist within a system. You must comprehensively examine the significance of hubs at various levels for the current movement to achieve a complete grasp. Of course, this is somewhat demanding for now, but you must make the effort.
缠中说禅 2007/5/24 15:52:02
[Anonymous] 袖手旁观
2007-05-24 15:48:46
"The first-type sell point at 10:00 and the second-type sell point at 11:15 are exactly the same as g0\g1 in the chart above, just that the above was at a level below 1-minute while today's is at the 1-minute level."
————————
Does this first-type sell point count at the 5-minute level?
==
Standing at the 5-minute perspective: a 5-minute hub forms, which requires first a 1-minute down, then a 1-minute up that doesn't make a new high or shows divergence — that constitutes a second-type sell point. This was in yesterday's lesson.
缠中说禅 2007/5/24 15:54:48
Chán Zhōng Shuō Chán
2007-05-24 15:54:09
[Anonymous] Sina User
2007-05-24 15:49:03
The blogger's theory has run into problems in practice. I don't know if I've misunderstood. Today's Shanghai market — on the 1-minute chart, there's a hub from 10:12-10:31. From 10:40-11:17, according to the blogger's theory, it's a bounce diving back into the hub. So at the first pullback afterward, I bought in — supposedly the so-called third-type buy point. But the result was I got stuck. Could the blogger explain whether there are exceptions to the theory? When do exceptions happen????????????????????????????????????Thank you.
Please, blogger, you must clarify this to prevent us from continuing to make mistakes!!!!!!!
==
The biggest exception to this ID's theory is that there are no exceptions. First please study this ID's entire course. What you're describing shows you basically haven't read this ID's lessons. Is that what a third-type buy point is? Please study the course first and build a solid foundation.
缠中说禅 2007/5/24 15:58:51
Snow Wolf
2007-05-24 15:01:08
Hello, blogger!
- "Generally speaking: after a high point, one sub-level down then one sub-level up — if it doesn't make a new high or shows consolidation divergence, that constitutes a second-type sell point. The buy point situation is the reverse. So, when a first-type buy/sell point exists, the first type is optimal and the second type is just a supplement. But in small-level-to-large-level transitions, the second-type buy/sell point is optimal, because in that situation, there's no first-type buy/sell point at that level."
May I ask the blogger: is it possible for "the second-type buy point to be lower than the first-type buy point" and "the second-type sell point to be higher than the first-type sell point"? Like: after a high point, one sub-level down then one sub-level up that makes a new high but forms consolidation divergence — this should be a second-type sell point higher than the first-type sell point, right?
==
Of course it's possible, though quite rare.
- "Standing from the perspective of hub formation, the significance of the second-type buy/sell point is that a larger-level hub must inevitably form, because there's at least one more sub-level segment to come that necessarily overlaps with the previous two."
May I ask the blogger: is this absolutely guaranteed? Why can't this happen: from the first-type buy point, one sub-level up, then a sub-level pullback, then the third segment up, and then it never drops below the high of the first segment? Or the reverse for sell points. Must infinite time be considered? If "at least one more sub-level segment" happens N ages later, then can the significance of the second-type buy/sell point not be considered solely from the perspective of forming a larger-level hub?
==
This is absolutely guaranteed. There's no "larger level" — just follow this definition.
- According to the second decomposition, the corresponding 5-minute hub isn't completed until g6. Thus:
g0g6= g0d1+d1g1+g1d2+{(d2g2+g2d3+d3g3)+(g3d4+d4g4+g4d5)+(d5g5+g5d6+d6g6)}
The corresponding 5-minute hub range is [d3,g5]. In this case, d7g7 is also hub oscillation, but does not constitute a third-type sell point because the conditions aren't met. (Why? This ID has written so much — such a simple question, consider it homework for everyone to answer.)
Is it because G6D7 is not the 5-minute sub-level? The third-type buy/sell point requires a sub-level departure, and a sub-level pullback not returning to the hub.
==
Sub-level departure, sub-level return not re-entering the hub.
缠中说禅 2007/5/24 16:00:15
[Anonymous] 你的样子
2007-05-24 15:57:40
Massive losses today. Won't go into the reasons — mainly my own fault.
Looking forward to the next plunge. Hoping to seize the opportunity.
==
Today didn't even touch the 5-day moving average. How is that a plunge? For those whose technique isn't proficient, just watch the 5-day moving average.
缠中说禅 2007/5/24 16:04:41
[Anonymous] 袖手旁观
2007-05-24 15:55:09
Question 1: An overlap like [d1,g2] that's just a single price point — can it be ignored? Especially when the strength g1d2>g0d1, whether g2 touches d1 or not isn't necessarily determined. If g2 were one tick lower (quite possibly due to random factors), the overlap wouldn't exist. So this hub doesn't seem to matter much whether you look at it or not.
Of course, this still falls under the second decomposition.
==
Strictly by theory: if one price point doesn't count, do two? That would be chaos. As long as there's overlap, it counts. Moreover, sometimes one price point is actually more significant — this is usually the work of the main funds behind the scenes.
Question 2: In terms of strength: g1d2>g2d3>g3d4 — relative to each other, the latter ones each represent consolidation divergence of the former. Many people say "diverged again and again — Chan Theory doesn't work." Actually, here each consolidation divergence is followed by a probe back to the previous low, thereby completing the theoretically guaranteed minimum bounce. So nothing's wrong.
The question is: for actual operations, what factors help judge that after a bottom divergence appears and before a top divergence appears, there'll be a movement of considerable magnitude in the "inertia direction," rather than completing the minimum bounce and then continuing the original direction? This matters for whether small-level divergence is worth participating in. Currently I can only use the higher-level MACD for rough estimation. Is there a method for definitive judgment?
==
This issue mustn't be confused. Trends are formed in the process. After a divergence bounce, at its root it all creates hub oscillation. Only when a third-type buy/sell point oscillates out is there the possibility of a trend.
缠中说禅 2007/5/24 16:11:18
Sorry, this ID needs to head out immediately. There's an engagement tonight. Those of you who truly aspire to be free within market movements need to put in more effort, look at more charts. First of all, save today's intraday chart — it's too typical. It demonstrates exactly how 1-minute evolves into 5-minute.
If you have questions, please raise typical ones. Like this time — some conceptual questions from people who haven't even read the course once: please read through the entire course first.
Heading out, see you tomorrow morning.
缠中说禅 2007/5/24 1:41:04
Came back from the late-night snack. Reposting since Sina was having issues earlier and the post didn't go through properly.