Teaching You to Trade Stocks 17: All Trends Must Complete
2006/12/18 11:52:42
All movements at any level can be decomposed into two categories: trends and consolidation, and trends can further be divided into uptrends and downtrends. This conclusion doesn't fall from the sky—it's summarized from the analytical practice of countless charts, just as the Analects says: "You! Shall I teach you what knowledge is? When you know a thing, to know that you know it; when you do not know a thing, to know that you do not know it—that is knowledge." (See this ID's corresponding series of interpretations.) This simple experience summarized from actual charts is the only solid foundation for all technical analysis theories. This foundation is known by everyone who touches technical analysis, but unfortunately no one can dig deeper into it. They then sink into the bitter sea of technical indicators, trading systems, and such, unable to extricate themselves. Think about it—when the foundation hasn't been sorted out, what can be built upon it? Once the foundation is solid, technical indicators, trading systems, and the like are child's play.
From the above, we derive "Chan Technical Analysis Fundamental Principle One": any movement type at any level must eventually complete. The latter half, stated more concisely, is "all trends must complete." The importance of this principle lies in transforming the practically-derived but hard-to-apply, static observation that "all levels of movements can be decomposed into trends and consolidation" into the dynamic, practically usable "movement types must eventually complete." This is the wisdom the Analects speaks of: "all levels of movements can be decomposed into trends and consolidation" is "non-anxious" (不患), non-positioned, while "movement types must eventually complete"—"all trends must complete"—positions itself through the non-position of "all levels of movements can be decomposed into trends and consolidation," thereby creating "anxiety" (患).
Because in actual operations, what you face is always vivid and present. And as the Analects says, "Those who practice knowledge and virtue are few!" One must directly face this present, vivid reality to create. At the present moment of any movement, whether the preceding pattern was consolidation or a trend, there is always a dilemma: will it continue extending or change? For example, when already in a trend, will that trend continue or transform into the opposite trend or consolidation? This kind of question at the present-moment level is eternally "non-anxious"—non-positioned. Anyone who claims to have solved this dilemma is as ineffective as claiming on Earth to be unaffected by gravity. This is something anyone facing technical charts must always remember. But this dilemma's "non-anxiety," under the "non-anxiety" of "all levels of movements can be decomposed into trends and consolidation," becomes its "anxiety," and can therefore be positioned (for understanding this, refer to this ID's corresponding Analects chapter interpretations). Precisely because the present movement is a dilemma—in the dynamic process from imperfection to perfection—this constitutes the basis for its "non-anxious" positioning. "All trends must complete," and movements can be "non-anxiously" decomposed into trends and consolidation. In other words: "trends must eventually complete, and consolidation must also eventually complete."
"All trends must complete"—this statement has two inseparable aspects: any movement, whether trend or consolidation, must eventually complete on the chart. On the other hand, once a certain type of movement completes, it will transform into other types—this is "non-anxiety" with its positioning. In technical analysis, different positions constitute different movement types, and various positions are positioned through non-position. The flexible movement between different positions is the most difficult part of actual operations and one of the core problems of technical analysis.
To deeply study this complex problem, we must first introduce the concept of the Chan Movement Hub (Chán Zhōng Shuō Chán走势中枢): within a movement type of a certain level, the portion overlapped by at least three consecutive next-lower-level movement types is called a Chan Movement Hub. In other words, a Chan Movement Hub is constituted by the overlapping portion of at least three consecutive next-lower-level movement types. There's a recursive issue here—the sub-level cannot go infinitely down. Just like some half-baked philosophers babble about "one splits into two," but "splitting" is not infinite. According to quantum mechanics, the division of matter has limits. Similarly, sub-levels cannot be infinite either. In practice, for the lowest indivisible level, the Chan Movement Hub cannot be defined using "the overlap of at least three consecutive next-lower-level movement types" but instead is defined as the overlapping portion of at least three K-lines at that level. Generally, for practical operations, this lowest indivisible level is set to the 1-minute or 5-minute chart. Of course, it could be set to 1-second charts too, but there's not much difference.
With the above definition, a "Chan Movement Hub" can be found in any movement at any level. With this hub, we can give the most precise definitions of "consolidation" and "trend":
Chan Consolidation: in any movement at any level, a completed movement type that contains only one Chan Movement Hub is called consolidation of that level.
Chan Trend: in any movement at any level, a completed movement type that contains at least two sequential same-direction Chan Movement Hubs is called a trend of that level. If the direction is upward, it's called an uptrend; if downward, a downtrend.
Then, is it possible that at some level, a movement contains no Chan Movement Hub? This is impossible. Because any "up + down + up" or "down + up + down" on any chart necessarily produces a Chan Movement Hub at some level. A chart with no Chan Movement Hub would mean only two possibilities exist across the entire chart: one downward move followed by an eternal uptrend, or one upward move followed by an eternal downtrend. For these two situations to occur, the traded instrument would have to permanently cease trading after a certain period. Our discussion of movements concerns the general case, premised on the movement being able to extend indefinitely without permanent trading cessation. Therefore, correspondingly:
"Chan Technical Analysis Fundamental Principle Two": any completed movement type at any level must contain one or more Chan Movement Hubs.
From Principles One and Two, together with the definition of the Chan Movement Hub, the following can be rigorously proven:
"Chan Movement Decomposition Theorem One": any movement at any level can be decomposed into a connection of same-level "consolidation," "downtrend," and "uptrend" movement types.
"Chan Movement Decomposition Theorem Two": any movement type at any level is composed of at least three or more next-lower-level movement types.
These proofs are all very simple—like middle school geometry proofs. If interested, try them yourself. From the above principles and theorems, we can rigorously establish the only two solid foundations that actual operations can rely upon. Because once a certain type of movement completes, it transforms into other types—for a downtrend, once complete, it can only transform into an uptrend or consolidation. Both subsequent types of movement necessarily produce profits for the long side, with the only difference being the magnitude and speed. If a 100% guaranteed profit model could be found in the market, that would be the greatest achievement. As for magnitude and speed, additional criteria can be developed for further judgment—but logically, that's a separate discussion.
The greatest and only difficulty here lies in "movement type extension." For example, in consolidation, after three overlapping consecutive next-lower-level movement types, the consolidation can end at any time—meaning once three overlapping consecutive next-lower-level movement types have played out, the consolidation ending at any point would be complete. But it doesn't have to end—it can extend indefinitely, continuing to oscillate up and down around the Chan Hub until infinity. This is somewhat like a young man who, once meeting certain standards, has the qualifications to immediately become a kept man and can be "consumed" at any time—but he can also persist indefinitely, self-imposing celibacy, never allowing consumption, until he wastes away and becomes a rotten apple.
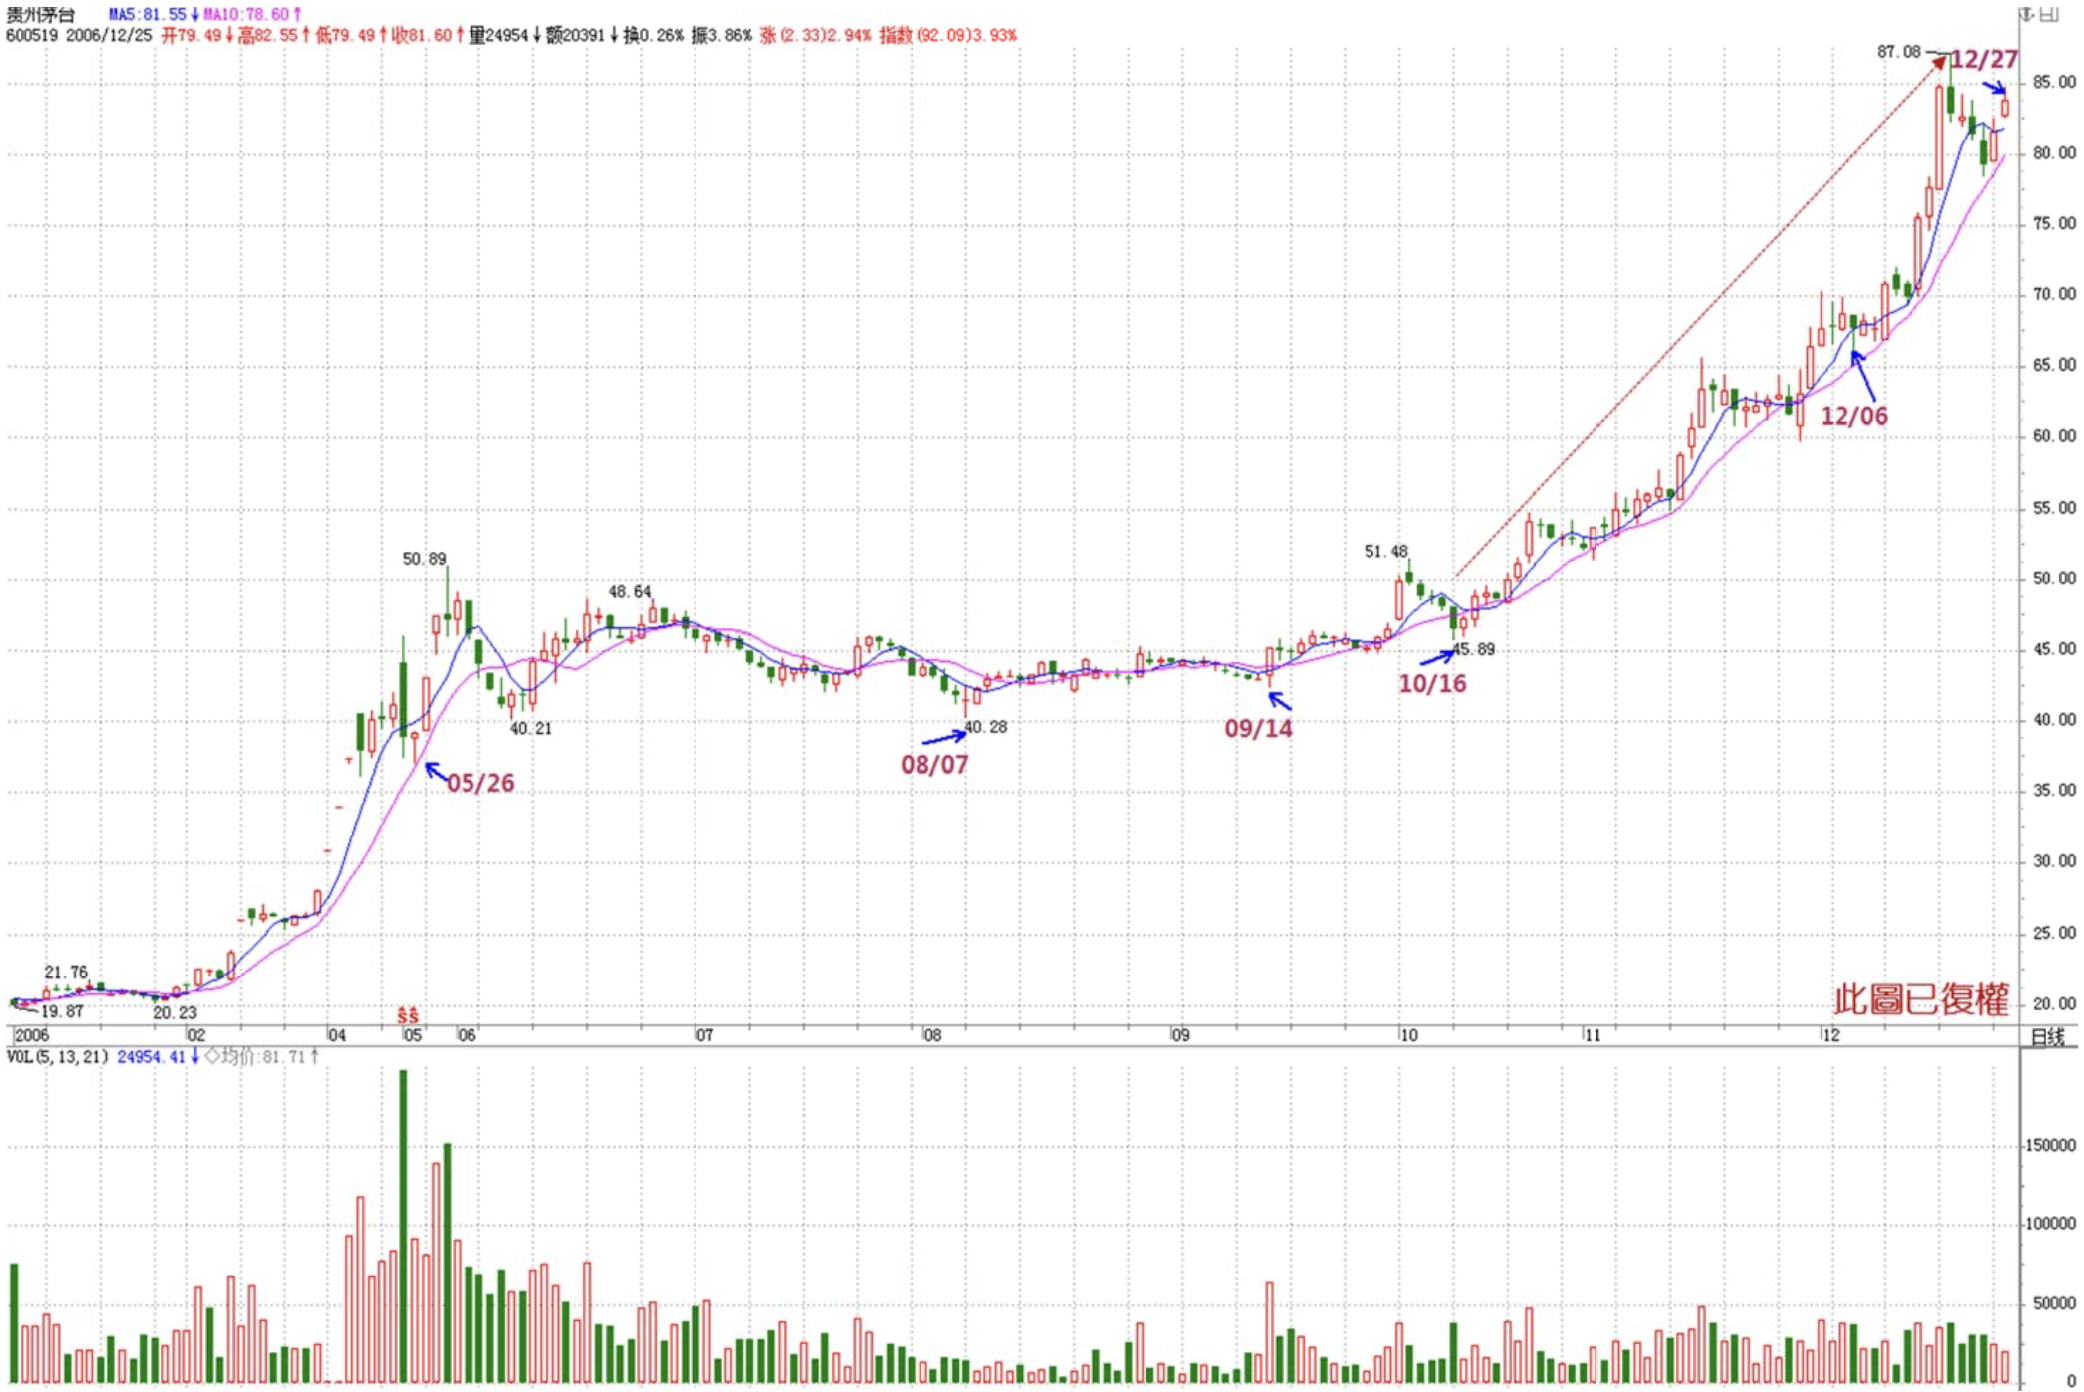
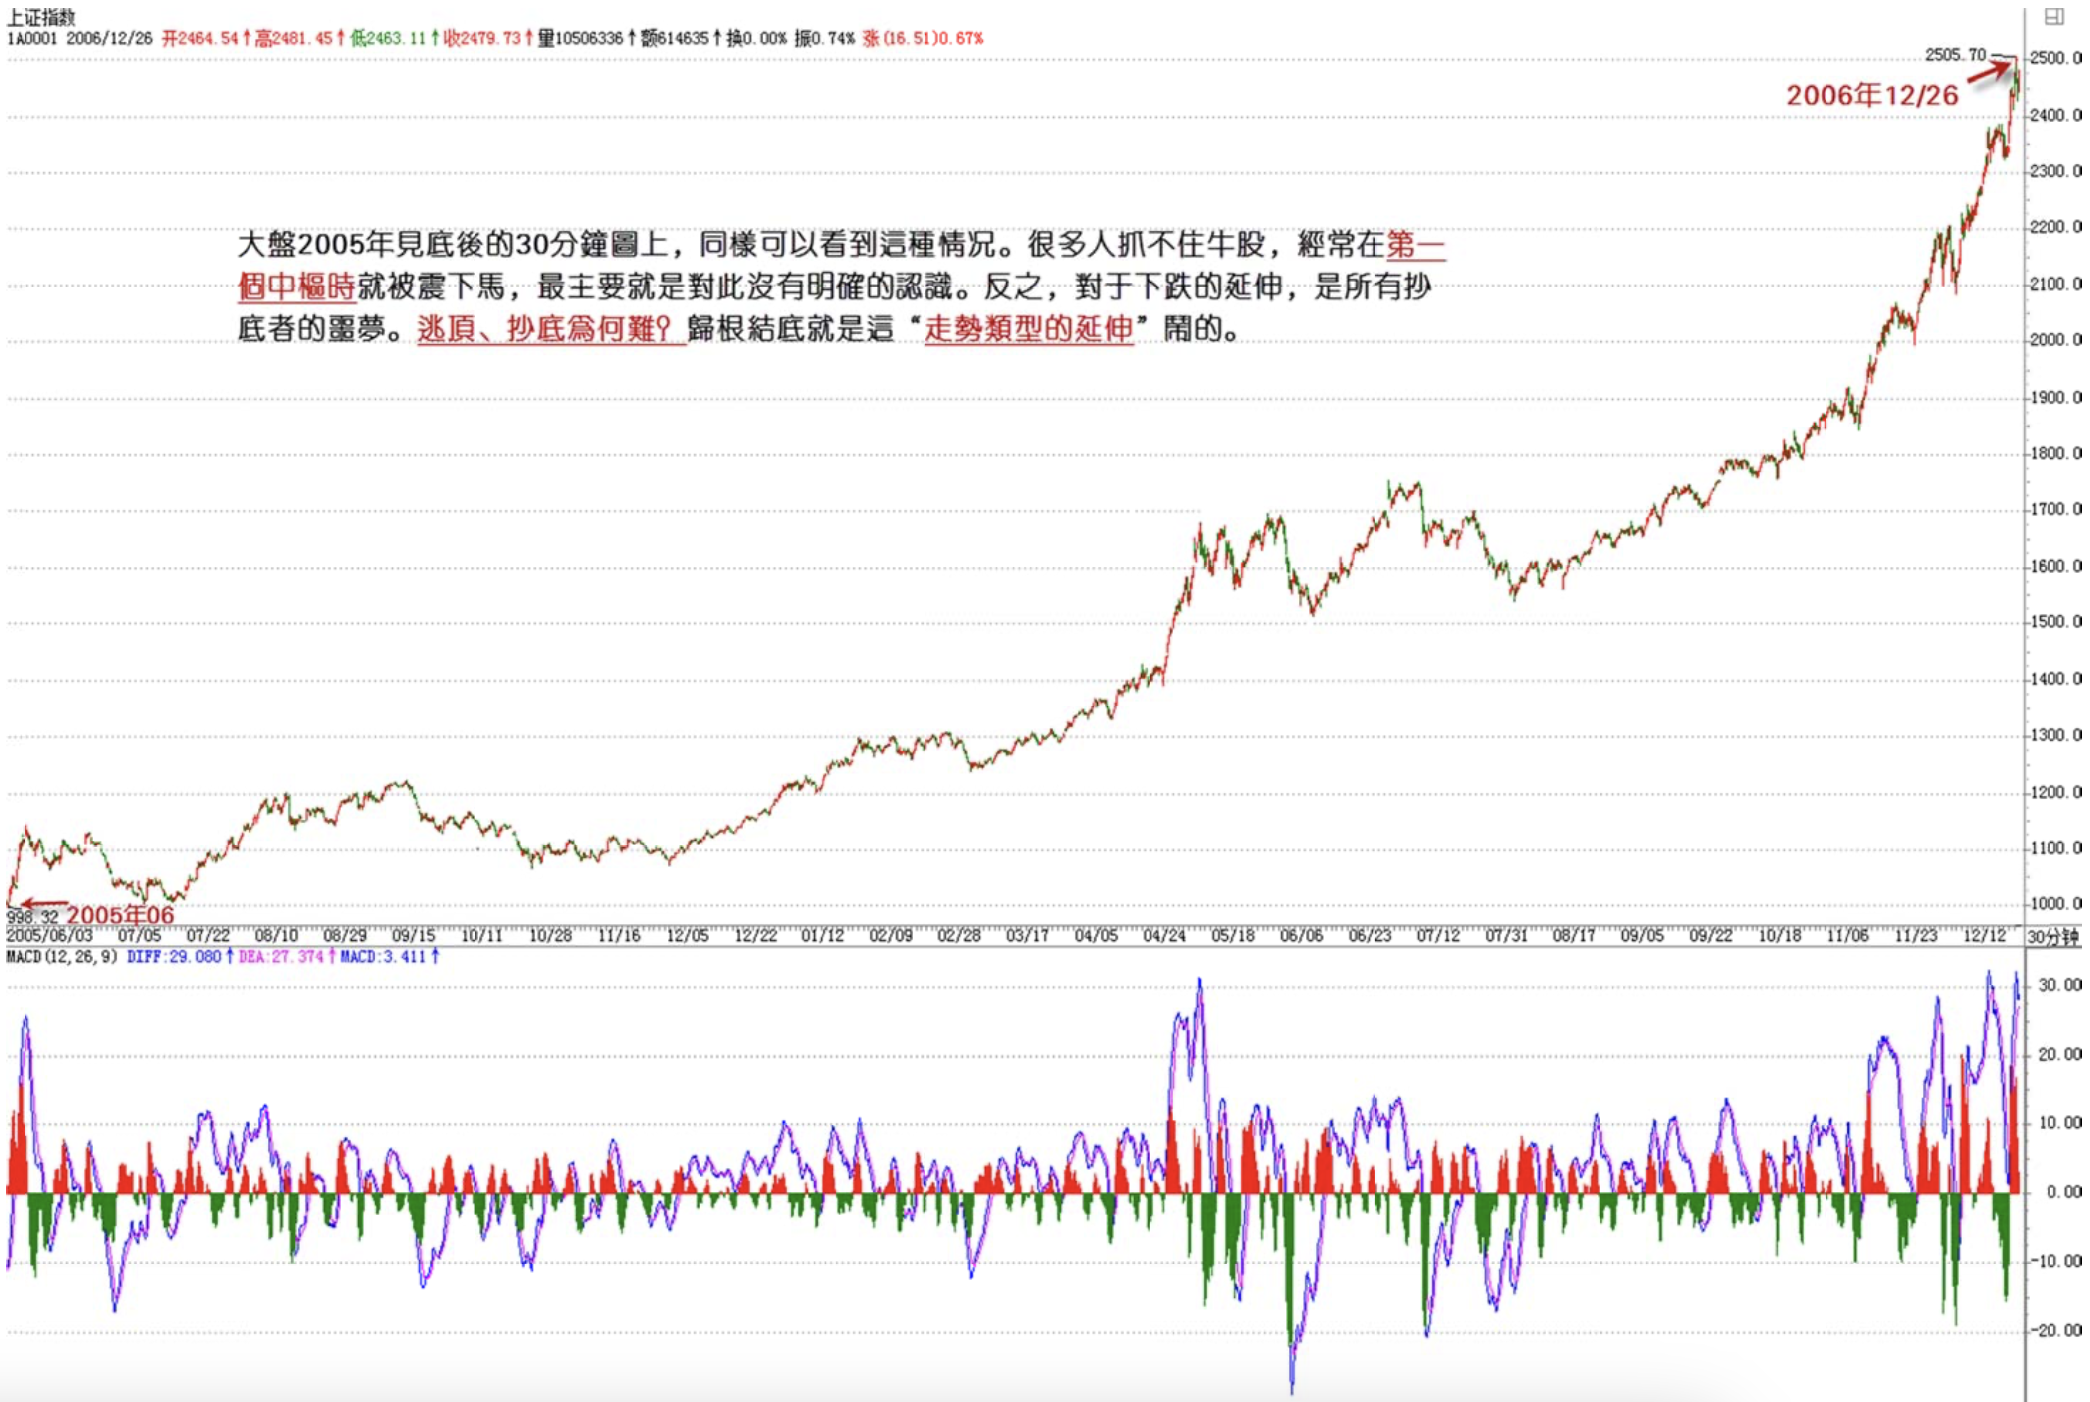
Similarly, with trends, after forming two sequential same-direction Chan Movement Hubs, any trend can end and be complete at any time—but it can also extend indefinitely, forming more hubs. This happens all the time in practice. If the trend is upward, it keeps rising. Look at 600519 and similar charts—with ex-rights factored in, you'll see a standard continuously extending uptrend. On the 30-minute chart from the 2005 market bottom onwards, the same thing is clearly visible. Many people can't hold on to winning stocks and often get shaken off at the first hub—mainly because they lack clear understanding of this. Conversely, the extension of a downtrend is every bottom-picker's nightmare. Why is it so hard to catch tops and bottoms? Fundamentally, it's all because of this "movement type extension."
How to determine whether "movement type extension" has ended? First, the essence of "movement type extension" must be clarified. For trends, the "extension" lies in the continuous production of same-level, same-direction "Chan Movement Hubs." For consolidation, the "extension" lies in no new "Chan Movement Hub" being produced. Since "movement type extension" means the current "movement type" could complete at any time, the corresponding "type" must be determined. Therefore, the key to judging whether "movement type extension" has ended lies in whether a new "Chan Movement Hub" is produced. Furthermore, since trends contain at least two "Chan Movement Hubs" while consolidation has only one, the key distinction between trends and consolidation also depends on whether a new "Chan Movement Hub" is produced. From this, it's clear that the "Chan Movement Hub" is the core problem of technical analysis—once resolved, many major judgment difficulties will be solved.
"Chan Movement Hub Theorem One": in a trend, what connects two same-level "Chan Movement Hubs" must necessarily be movement types at the next-lower level or below.
Using proof by contradiction, this theorem's proof is very simple. This also answers Assignment One from the previous chapter: "Must the connection between two adjacent same-level Chan Movement Hubs necessarily be a trend? Must it be a next-lower-level trend?" First, it's not necessarily a trend—any movement type is possible. The most extreme case is a gap followed by the formation of a new "Chan Movement Hub." Second, it doesn't have to be next-lower-level—as long as it's next-lower-level or below. For example, a gap belongs to the most basic level, and if the chart shows daily or weekly lines, it wouldn't be next-lower-level. Finally, generally the lower the level of the connecting movement type, the greater its force—this is also the theoretical basis for why gaps have particularly strong technical significance in analysis.
By definition, the Chan Movement Hub's creation mechanism and judgment criteria—its "birth" problem—have been solved. What remains are its "sustaining, decaying, and extinguishing" questions. That is, how a "Chan Movement Hub" is "maintained" and ultimately "destroyed" and abandoned. First, consider the "maintenance" question. A sufficient and necessary condition for maintaining a "Chan Movement Hub" is that any movement type leaving the hub must be at the next-lower level or below and must return with a next-lower-level or below movement type. This is easily proven because whether leaving or returning, any same-level movement type would mean forming a new "Chan Movement Hub," contradicting the premise of maintaining the original hub. This proposition is stated as:
"Chan Movement Hub Theorem Two": in consolidation, the movement types both leaving and returning to the "Chan Movement Hub" must necessarily be at the next-lower level or below.
From this, the answer to Assignment Three of the previous chapter—"How are the highs and lows of consolidation created?"—becomes available: regardless of what level the leaving and returning movement types are, when viewed at the most basic level—for example, treating the 1-minute chart as the most basic level—the point connecting the leaving and returning movement types at the most basic level can only have two possibilities: 1. Three or more 1-minute K-lines overlapping back and forth before reversing; 2. A V-shaped movement with fewer than three overlapping 1-minute K-lines. For the first case, the extreme position of the most extreme bar among those overlapping K-lines constitutes the consolidation high or low—this is relatively uncommon. For the second case, the extreme position of the bar at the V-shaped peak constitutes the consolidation high or low—this is extremely common. This is also the theoretical basis for why true lows and highs always flash by momentarily during the trading session. This ID's theory can explain any fine-grained question on technical charts—this is the quality a true theory should possess. Such a theory doesn't need a Nobel Prize's reward—what's one million dollars in the market? Master such a theory and the market will reward you with far more.
With the above two "Chan Movement Hub" theorems, it's not difficult to prove Theorem Three:
The destruction of a certain-level "Chan Movement Hub" occurs if and only if a next-lower-level movement leaves that "Chan Movement Hub" and the subsequent next-lower-level pullback movement does not return to the "Chan Movement Hub."
The combination of the two next-lower-level movements in Theorem Three has only three possibilities: trend + consolidation, trend + counter-trend, consolidation + counter-trend. The "trend" here can be uptrend or downtrend, representing breakout above and breakdown below, respectively. From a practical standpoint, the most forceful destruction is: trend + consolidation. For example, in an uptrend, if a next-lower-level movement breaks upward and is followed by consolidation for the pullback, the subsequent uptrend is often quite powerful—especially when this breakout occurs from the base area. This situation is extremely common, and its theoretical basis lies right here.
Replies
缠中说禅 2006/12/18 12:05:33
[Anonymous] ataoo0
2006-12-18 11:54:42
Too bad the blogger didn't visit me in a dream last Friday. Still hoping for more such dream scenarios in the future~~~~~~
=========
News is meaningless. That was just this ID sharing some gossip. The theme of these years, as this ID said long ago, is the acquisition of China. China's greatest feature? A massive population. Last year, this ID has been in contact with many foreign funds—their biggest target is China's fast-moving consumer goods market. Although this ID finds foreign investors annoying, they're definitely not fools. Unfortunately, there are too many fools within China, and the fools even have discourse power.
缠中说禅 2006/12/18 12:11:41
Xiao Ming
2006-12-18 12:07:39
Shuanghui, Tsingtao Beer, who else?
Oh, what does Chan mm think of Lin Yuan?
Have you met him?
======
Sorry, but this ID is only interested in the market itself. The so-called heroes and zeros within the market hold zero interest for me. Big shots—this ID has seen too many. Unfortunately, most of them eventually died.
缠中说禅 2006/12/18 12:24:16
[Anonymous] nn
2006-12-18 12:21:11
Checking in first, reading later. Thanks!
Also, a suggestion for the blogger: to make it easier for everyone to search your Analects interpretations, would you change each lecture's title to something like: Detailed Analects Interpretation (41): Confucius said: "Those who are born knowing are the highest; those who learn to know are next..."
Whether or not it works, thanks in advance!
==========
The title can't be that long—Sina won't allow it. The simplest thing is to copy it to your own computer—that's the best for searching.
缠中说禅 2006/12/18 12:48:50
[Anonymous] lazycat588
2006-12-18 12:38:06
May I repost your articles? Thanks.
I'll credit the source, of course.
===
Sure, but please also promote this blog. This blog should be at least more popular than that Kong guy's, right?
缠中说禅 2006/12/18 12:51:20
Everyone take your time digesting. Signing off for now. See you later.
缠中说禅 2006/12/18 15:15:02
[Anonymous] 喝杯小酒
2006-12-18 14:38:04
Today big brother is going to criticize Chan sister a bit:
- In the current big bull market, this isn't the time for technical details. Your theory isn't suitable for now—teach more about the big picture of stock selection.
- Your theory is somewhat outdated. Take indicators—when too many people use them, they become inaccurate.
- Stop saying things about "accurate intelligence." That doesn't count for much. A true expert should excel in other ways.
=========
This ID painted the entire bull market picture a year and a half ago. First round: component stocks—that's those 300 stocks. What's there to pick?
What's being discussed now isn't indicators—get the issue straight first.
What's wrong with having accurate intelligence? Being the most accurate intelligence source in the country represents something—it represents industry status.
缠中说禅 2006/12/18 15:18:38
[Anonymous] 中间体
2006-12-18 15:11:25
The concept of the Chan Movement Hub: within a movement type of a certain level, the portion overlapped by at least three consecutive next-lower-level movement types is called a Chan Movement Hub.
How do next-lower-level movements overlap with higher-level ones? Using 60-minute K-line to simulate the daily chart? Please give an example.
Understanding the hub is critical!!
==========
It's not about next-lower-level overlapping higher-level—it's about next-lower-level movements overlapping among themselves.
缠中说禅 2006/12/18 15:22:32
[Anonymous] 想飞
2006-12-18 15:04:25
Blogger, greetings!
"And 580991, from October 23, 2006 to December 13, only constituted consolidation on the daily chart (why? because one Chan Movement Hub is clearly visible on the daily chart)."
Does the Chan Hub mentioned here refer to 10/2311/8, or 11/1411/21? If looking at the 30-minute chart, it should be the former, right?
=======
Both wrong. It's November 8 to November 28—constituted by three next-lower-level trends.
缠中说禅 2006/12/18 15:26:28
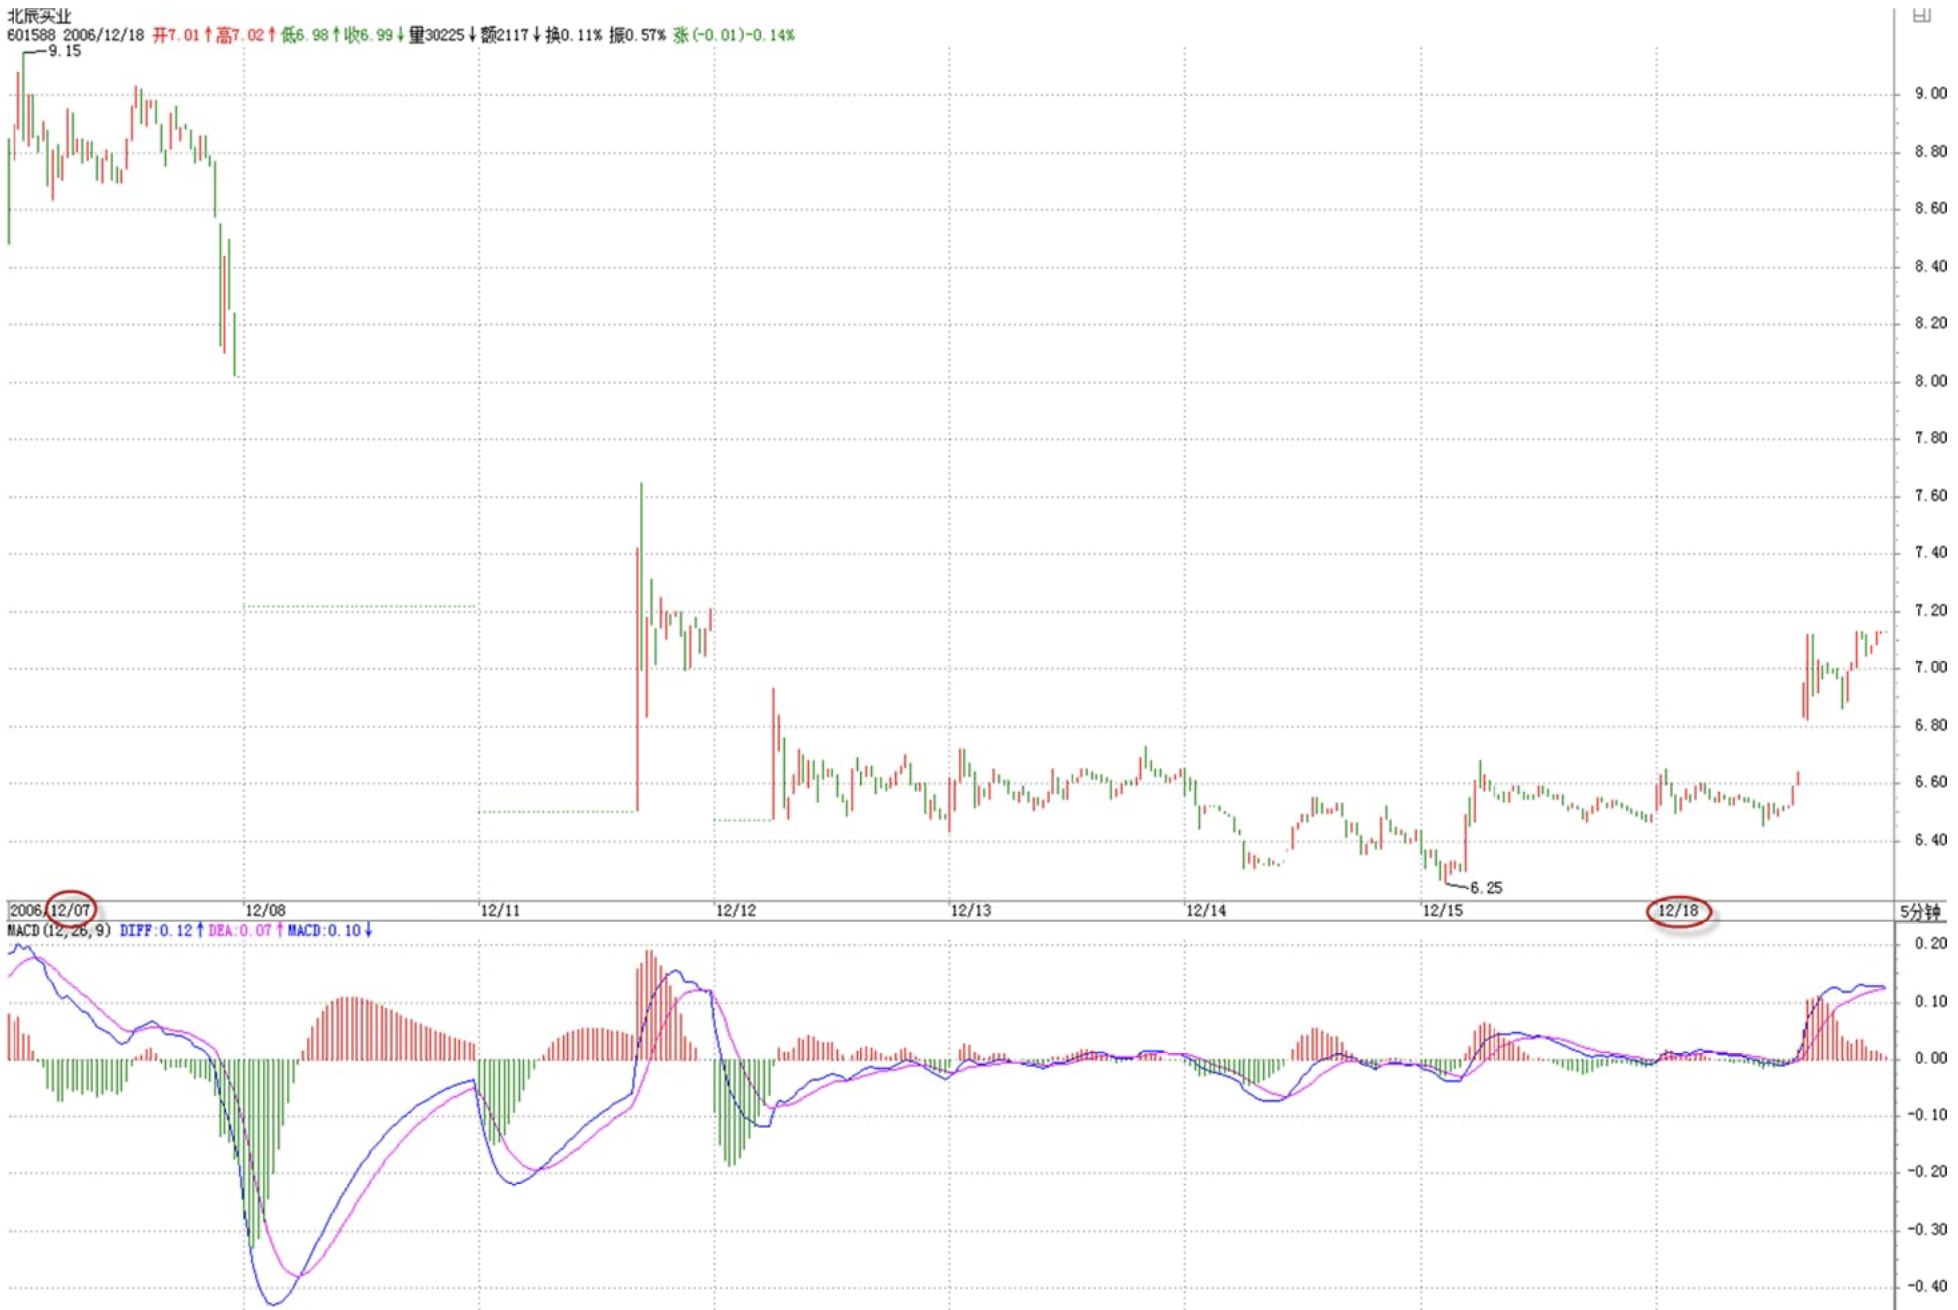
Here's another specific stock assignment:
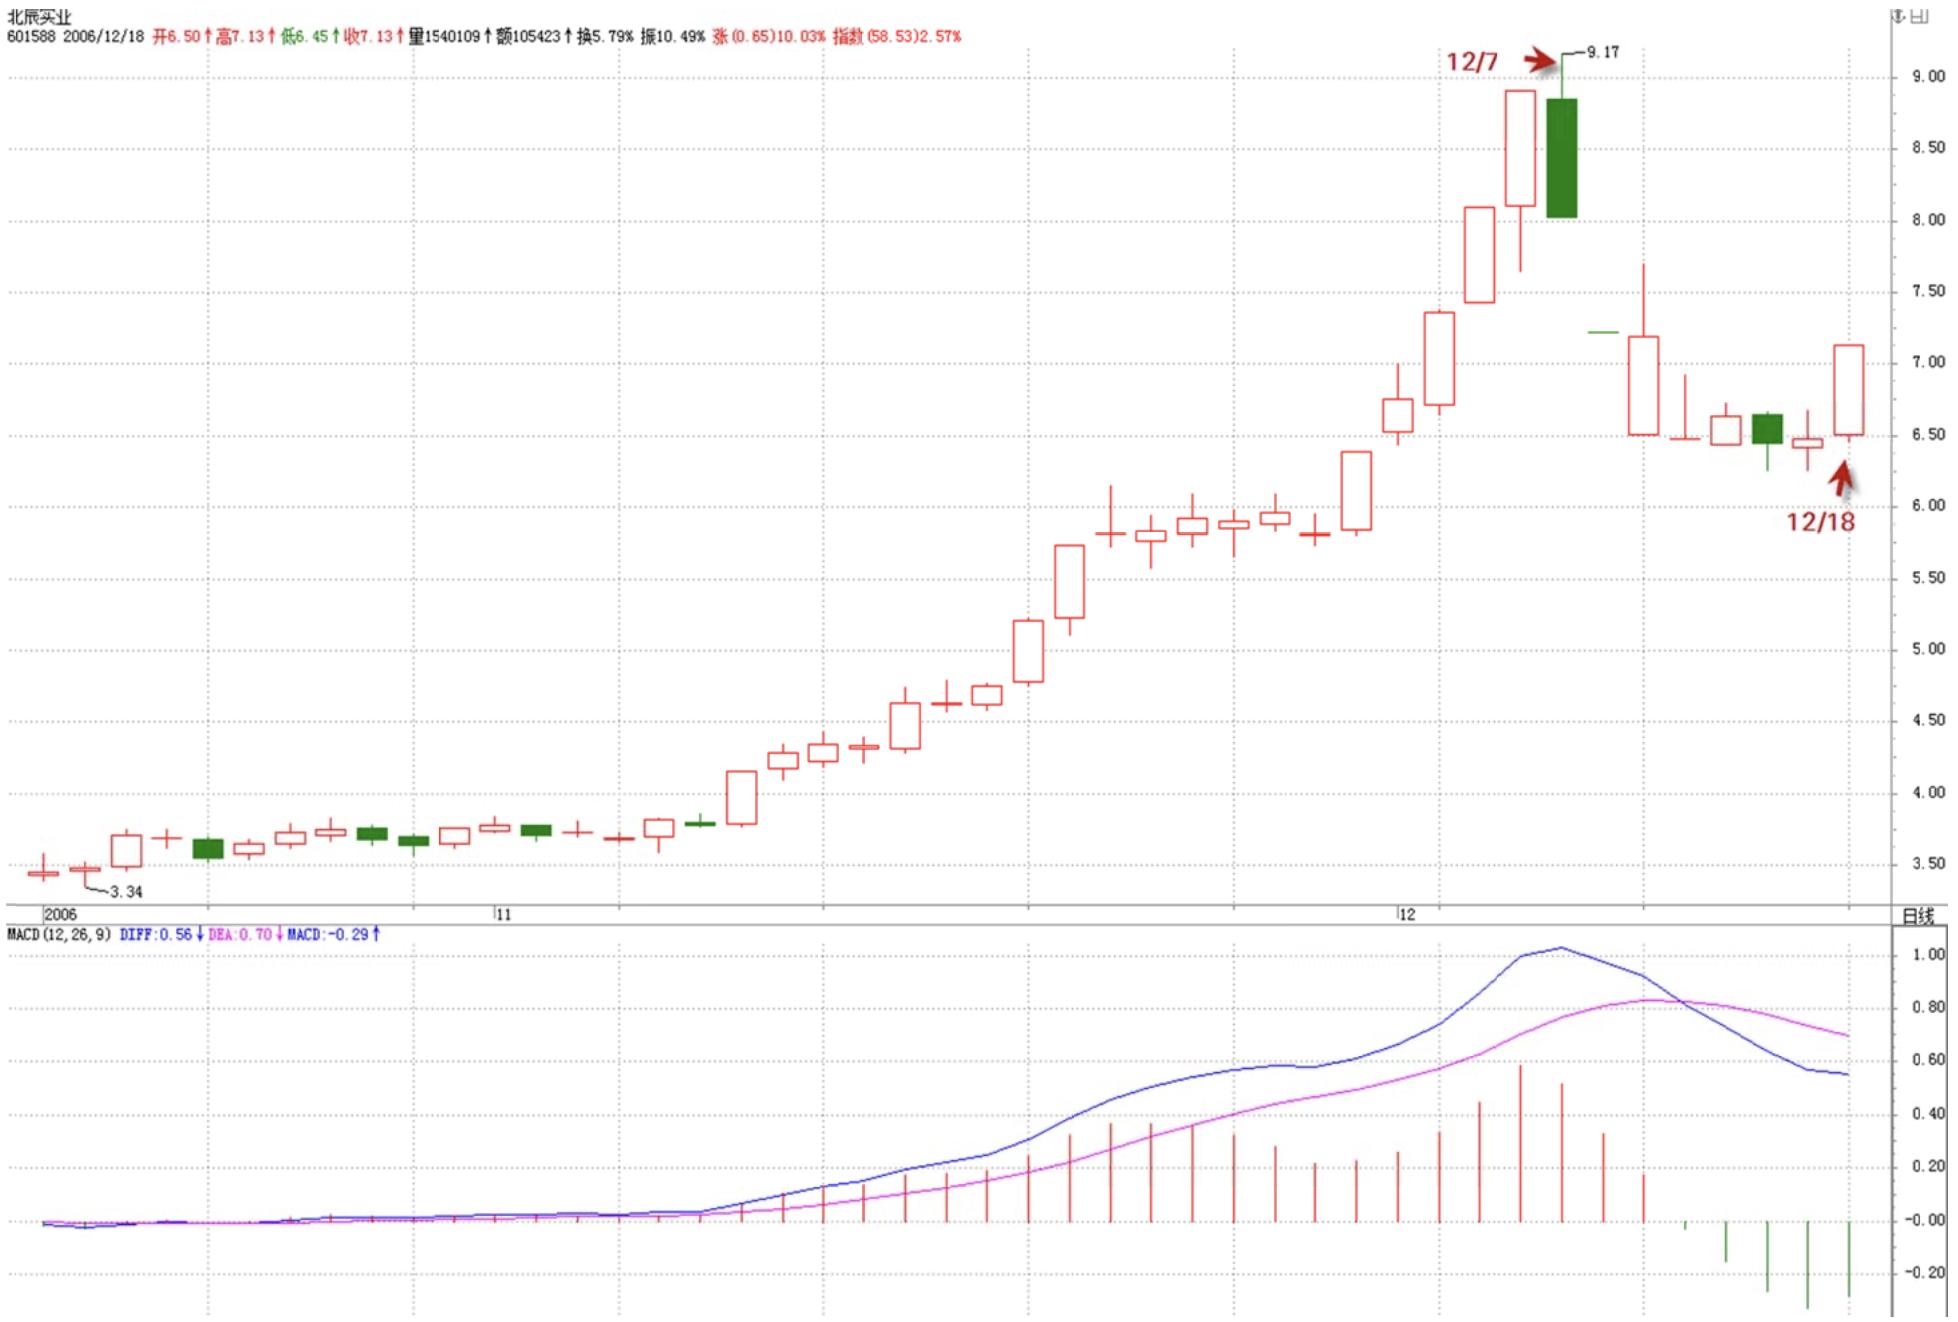
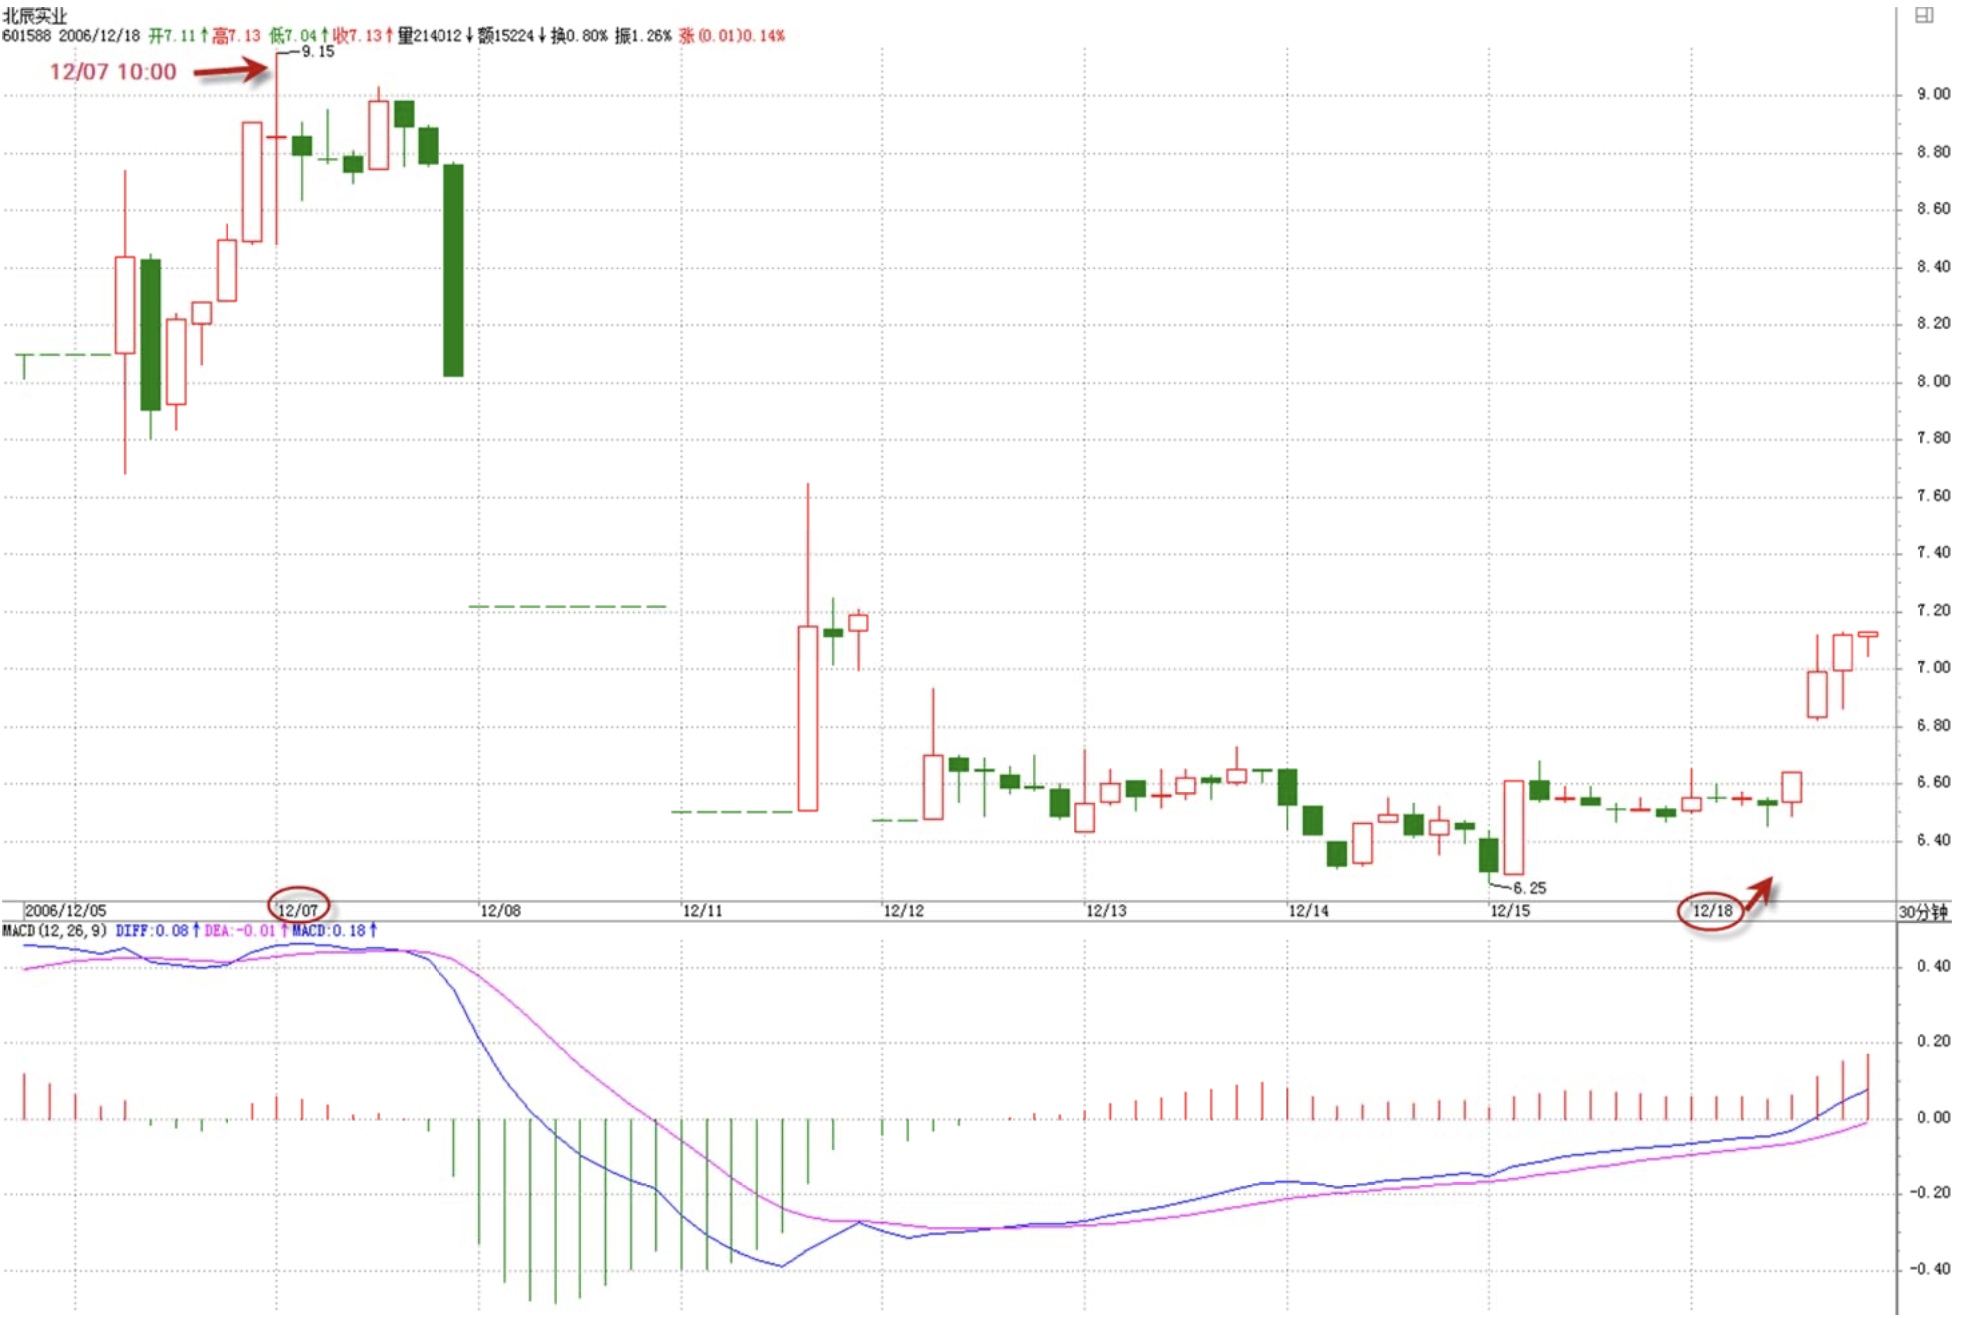
Please analyze the specific level and movement type of Beichen's movement since December 7.
缠中说禅 2006/12/18 15:27:52
[Anonymous] 中间体
2006-12-18 15:23:32
Chan sister, could you give an example of what "overlap" means?
========
580991, November 8 to November 28—three next-lower-level trends constituting the daily hub.
缠中说禅 2006/12/18 15:47:11
[Anonymous] 小小
2006-12-18 15:34:29
Chan sister, regarding 600519—after the second entanglement in the 10-period moving average position on 8/7, divergence formed. Question 1: was the first entanglement in the 10-period position on 7/4 or 7/24?
Question 2: what day did the first entanglement in the 10-period position end? These two questions confuse me the most. Please explain, Chan sister. I'm sitting here waiting for you!
==========
Using moving averages or MACD to identify divergence is merely auxiliary—none of it is the most important. The most important thing is to understand today's lesson thoroughly—this is what matters most. Issues related to divergence will continue to be addressed in future posts. First get the logical chain clear:
Movement → Level → Trend → Comparison between sequential trends → Divergence → Using moving averages etc. to assist in judging divergence
So first sort out the earlier parts. Don't get stuck on details—once the earlier parts are clear, the later parts naturally follow.
Do you really think divergence can't be judged without moving averages, without MACD? Obviously not. Those are just aids.
缠中说禅 2006/12/18 15:55:14
Everyone study it well. Once you truly understand, it will benefit you for life. If you're looking for black horse stock tips, they're not here. There are 300 component stocks—when the bull market ends and you look back, they'll all be black horses. In a bull market, is there such a thing as a black horse? Everything's a black horse. Do you even need to look? The key is whether you have the confidence to hold. Trading stocks in a bull market—does it need to be this hard? As this ID has said multiple times before: in a bull market, the first thing to eliminate is the bear market mindset. Spend your time building the foundation. This ID helps nobody here—you're all Buddhas yourselves. Why should this ID be busy helping? Stop shortchanging yourselves.
缠中说禅 2006/12/18 15:58:21
[Anonymous] 中间体
2006-12-18 15:53:12
Chán Zhōng Shuō Chán
2006-12-18 15:27:52
[Anonymous] 中间体
2006-12-18 15:23:32
Chan sister, could you give an example of what "overlap" means?
========
580991, November 8 to November 28—three next-lower-level trends constituting the daily hub.
--------------------
Chan sister, I know today's lesson is very important. Could you explain in detail how three next-lower-level trends constitute a daily hub? I'm comparing 60-minute, 30-minute, 15-minute charts and can't make sense of it. My apologies for being such a slow student.
=======
Isn't this the simplest thing? Three segments of movement—don't they naturally form an overlap? The range is between 0.677 and 0.803, constituting the hub.
缠中说禅 2006/12/18 16:12:28
[Anonymous] 游客
2006-12-18 16:05:12
The concept of "hub" is still unclear. Please clarify:
"Within a movement type of a certain level, the portion overlapped by at least three consecutive next-lower-level movement types"—does this mean the overlap of K-lines on the weekly, daily, and hourly charts?
========
It's not the overlap of several K-lines—it's the overlapping portion formed by at least three consecutive next-lower-level movement types.
缠中说禅 2006/12/18 16:13:59
[Anonymous] 中间体
2006-12-18 16:07:26
"Isn't this the simplest thing? Three segments of movement—don't they naturally form an overlap? The range is between 0.677 and 0.803, constituting the hub."
Please specify: from where to where is one segment, which three segments?
========
Such a simple question—think it through yourself. If this ID answers for you, it harms you because you'll stop thinking. During those days, the chart shows three segments of down-up-down. Does this ID really need to spell that out?
缠中说禅 2006/12/18 16:14:59
[Anonymous] Heart Zen
2006-12-18 16:03:56
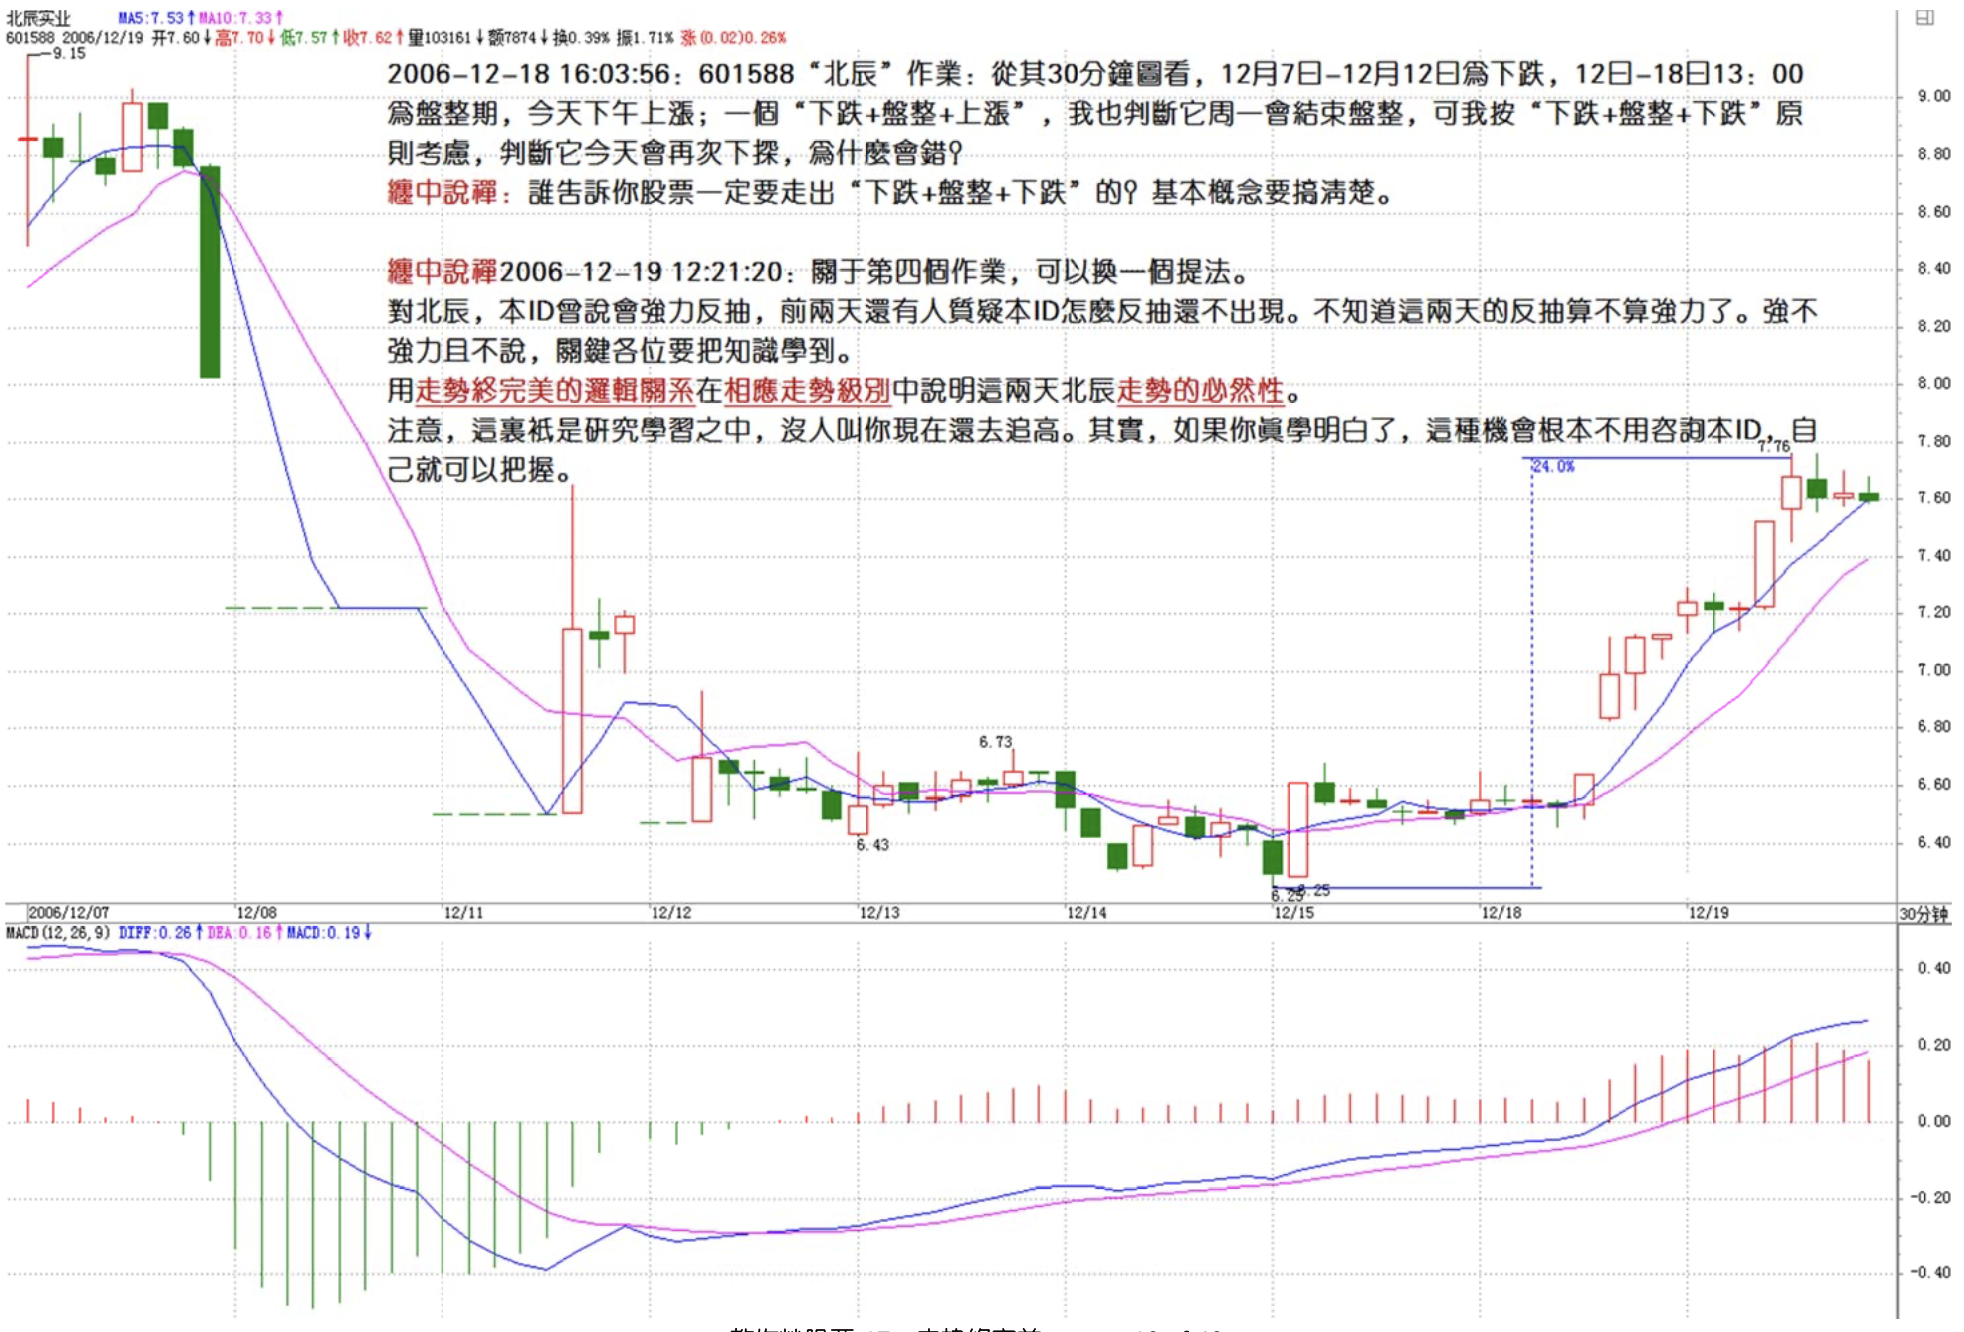
"Zen Master" 601588 "Beichen" assignment:
From the 30-minute chart: Dec 7 to Dec 12 is a downtrend, Dec 12 to Dec 18 13:00 is consolidation, this afternoon an uptrend; a "downtrend + consolidation + uptrend."
Zen Master, I also predicted it would finish consolidation on Monday, but I considered the "downtrend + consolidation + downtrend" principle and predicted it would probe lower again today. Why was I wrong? Please correct me.
=========
Who told you stocks must follow a "downtrend + consolidation + downtrend" pattern? Get the basic concepts straight.
缠中说禅 2006/12/18 16:16:54
Announcement
From now on, anyone asking this ID to directly give answers will be refused. Giving answers harms everyone—you must think first, find your own answers, and then this ID will evaluate. Only this way will it benefit you.
缠中说禅 2006/12/18 16:24:54
[Anonymous] 一剑
2006-12-18 16:16:17
Chan sister:
Let me discuss the article "Currency Wars and RMB Strategy." I believe China's economy is currently highly dependent on the US consumer market, enjoying the benefits of America's economic virtualization through large trade surpluses. So currently we should cooperate with the dollar depreciation strategy to maintain the American economic system's operation. Therefore, the first buy point should be in the future, not now. Please advise!
========
Before July 2005, the RMB was directly pegged to the dollar, forming a dual-core that exploited all other world systems. China piggy-backed on this to grow—like a vine wrapping around a tree. Now, America is exploiting everyone. China has just entered a breakdown, turning a perfectly good "uptrend + consolidation + uptrend" into an "uptrend + consolidation + downtrend"—how can you even talk about first-type buy points now? You're being led around by the nose.
Also, stop using words like "cooperate." Why should China cooperate with America? China's relationship with America has only two possibilities: one is called "using," the other is called "being used."
Unfortunately, right now it's "being used"—a bunch of idiots!
缠中说禅 2006/12/18 16:27:44
[Anonymous] 中间体
2006-12-18 16:18:34
Thank you. Actually, we just don't understand how you express "overlap." What does "overlap" actually mean? We don't understand.
[Anonymous] 求知
2006-12-18 16:18:38
The "hub" concept is too important and too abstract. I'm slow-witted. Please explain with examples in more detail.
Thanks in advance!!!
=========
Isn't this the simplest question? Segment A goes from 8 to 18, Segment B goes from 18 to 12, Segment C goes from 12 to 24. Tell me: where's the overlapping portion of these three segments ABC?
If you can't even answer this, this ID is helpless—because even kindergartners could answer it.
缠中说禅 2006/12/18 16:34:32
Everyone read this definition carefully:
The concept of the Chan Movement Hub: within a movement type of a certain level, the portion overlapped by at least three consecutive next-lower-level movement types is called a Chan Movement Hub. In other words, a Chan Movement Hub is constituted by the overlapping portion of at least three consecutive next-lower-level movement types.
The key words are: three, consecutive, next-lower-level, overlap.
Example: 580991
From November 8 to November 28, a hub is formed at 0.677 to 0.803.
One look and it's clear. Understanding it from the chart is true understanding.
缠中说禅 2006/12/18 16:36:15
[Anonymous] 如
2006-12-18 16:30:03
The most pressing question right now—please don't stint on your guidance.
Regarding the previous lesson's mention of how to judge whether consolidation will be followed by an uptrend or downtrend—could you explain?
Currently in the stock market, quite a few stocks are in an "uptrend + consolidation" pattern, or "uptrend + downtrend + consolidation"...
How to determine what comes after the consolidation, and how to determine what counts as a valid breakout—these are my most urgent questions right now. Please explain in detail. I'd be very grateful.
=======
Did you see the assignment in this ID's article?
- How are the highs and lows of consolidation created? (This question is somewhat difficult. Hint: analyze using the Chan Movement Hub and level concepts.)
Answer this, and it will solve your problem.
缠中说禅 2006/12/18 16:41:19
[Anonymous] 巴索林
2006-12-18 16:00:26
I've been reading Chan mm's articles continuously. I find Chan mm's thought to be both broad and deep, with rigorous thinking and strong logic, and the writing is witty and humorous. This generation has benefited greatly. I deeply respect and thank Chan mm for teaching without discrimination and tireless guidance. But I have one doubt. Since experts can withdraw from the market whether it's bull or bear, why didn't Chan mm look at stocks at all from 2001 to 2005? Do even experts like you need to avoid bear markets? Then what are professional traders supposed to do during bear markets—switch careers?
==========
This ID doesn't need money to spend—why would I waste energy in a bear market? With technique, you can make money in bear markets—that's true. But this ID lost interest in that kind of money long ago.
Life has many things to do. The key is understanding what's most worth doing in the present. With a big bull market, this ID naturally won't miss it. That pathetic bear market with its pathetic rallies—is it worth this ID's time?
缠中说禅 2006/12/18 16:48:43
This ID fully understands everyone's eagerness to make money, but this very eagerness is one of the biggest taboos for market participants. If you can't even control your own mind, can't control your own greed and desires, you cannot succeed in the market long-term.
Calm down. Anxiety produces no wisdom.
缠中说禅 2006/12/18 16:56:38
[Anonymous] 一剑
2006-12-18 16:44:58
"Before July 2005, the RMB was directly pegged to the dollar, forming a dual-core that exploited all other world systems. China piggy-backed on this to grow—like a vine wrapping around a tree. Now, America is exploiting everyone. China has just entered a breakdown, turning a perfectly good 'uptrend + consolidation + uptrend' into 'uptrend + consolidation + downtrend'..."
---------It's like two strong women visiting a male courtesan shop with only one nearly exhausted courtesan. How do two strong women exploit that? The only outcome is the entire shop collapsing. So now we have to let America—the strong woman—exploit first while we listen from the side. Otherwise, if America the strong woman dies without courtesans, we can't even siphon anything from her anymore, can't even hear a sound...
=======
Wrong. It's about a big cake. Americans habitually take the whole thing, habitually dividing the cake. And certain fools or those with ulterior motives, intentionally or unintentionally, go along with the Americans.
China's problems have always been simple. It's not that there are too many fools, but too many traitors.
缠中说禅 2006/12/18 16:58:17
[Anonymous] 小小
2006-12-18 16:52:25
Chan sister, what day did the second entanglement in the 10-period position for 600519 start and end?
=======
Didn't you see this ID's answer above? Copied below:
Using moving averages or MACD to identify divergence is merely auxiliary—none of it is the most important. The most important thing is to understand today's lesson thoroughly—this is what matters most. Issues related to divergence will continue to be addressed in future posts. First get the logical chain clear:
Movement → Level → Trend → Comparison between sequential trends → Divergence → Using moving averages etc. to assist in judging divergence
So first sort out the earlier parts. Don't get stuck on details—once the earlier parts are clear, the later parts naturally follow.
Do you really think divergence can't be judged without moving averages, without MACD? Obviously not. Those are just aids.
缠中说禅 2006/12/18 17:06:54
Announcement
Do you all know why wisdom is rare? Because the thieving heart won't die—always thinking about shortcuts, always dreaming of overnight riches. Look at the truly successful people—which one of them got there by winning the lottery?
To succeed in the market, first kill that thieving heart. Otherwise, no matter what you learn, you'll get confused the moment you enter the arena, then regret and blame yourself, then get confused again.
Principles are dead; the user is alive. When the person lacks principle, no principle works.
Sure, this ID could give you insider tips, tell you to buy so-called dark horses. But even if you bought one, you probably couldn't hold it. Look back—how many dark horses have you owned in the past? If you'd held them all until now, would you still need to look for dark horses?
Don't say you can't find dark horses. Instead, think carefully about why dark horses keep avoiding you.
缠中说禅 2006/12/18 17:09:28
Everyone, please think through those four assignments carefully—if you truly want to learn something.
Signing off now. See you later.
缠中说禅 2006/12/18 11:56:31
Digest it well. How to transform abstract theory into personal instinct is not a one-or-two-day affair for anyone.