Teaching You to Trade Stocks 58: Chart Analysis Demonstration Three
2007/6/4 22:34:47
Tomorrow after market close I have a business trip — going to the place where I once composed a poem while on a 419 excursion. So the lesson is posted first. I won't have time to write posts for the next few days, but I'll try to keep the after-close market commentary on schedule. As for other content, that'll have to wait until after the trip.
The market's big drop, aside from washing out chips, can also wash out people. This ID has said there's no need for so many people here — if you're not here hoping to become a whale hunter, there's no need to come. Those who panic over a 40% drop aren't really suited for the market. The market has always been a bloody arena — this has been repeatedly stated earlier. Those who can't stand the sight of blood should take their money and buy treasury bonds — that'll give peace of mind. Stocks are just wastepaper. When it's time to sell and you don't, treating stocks as treasures — that's the biggest vulnerability in investing. If you can't achieve a state of no-self, no-stock when reading charts, with only the chart's movement in mind, then basically you can stop looking at charts. Because with self and stocks in mind, pulled along by your own greed and fear, what you see in the chart is nothing but your own greed and fear — so why bother looking?
Let me give the simplest example: even without any technique, if you just follow the simplest rule of exiting when the price breaks below the 5-day moving average, look at when you should have exited — and that's not even talking about individual stocks. This drop is an excellent practical exercise. Think back to those sell points — what were you actually doing? Were you full of fantasies, blinded by your own illusions? When operating based on charts, the only subject is the chart itself. Nobody's words matter — the market is happening right now, and no one can react for you.
Let's set the market aside and continue with chart analysis, carrying the analysis of this decline's charts forward continuously — this should help with everyone's understanding and analysis. Please look at the chart below:
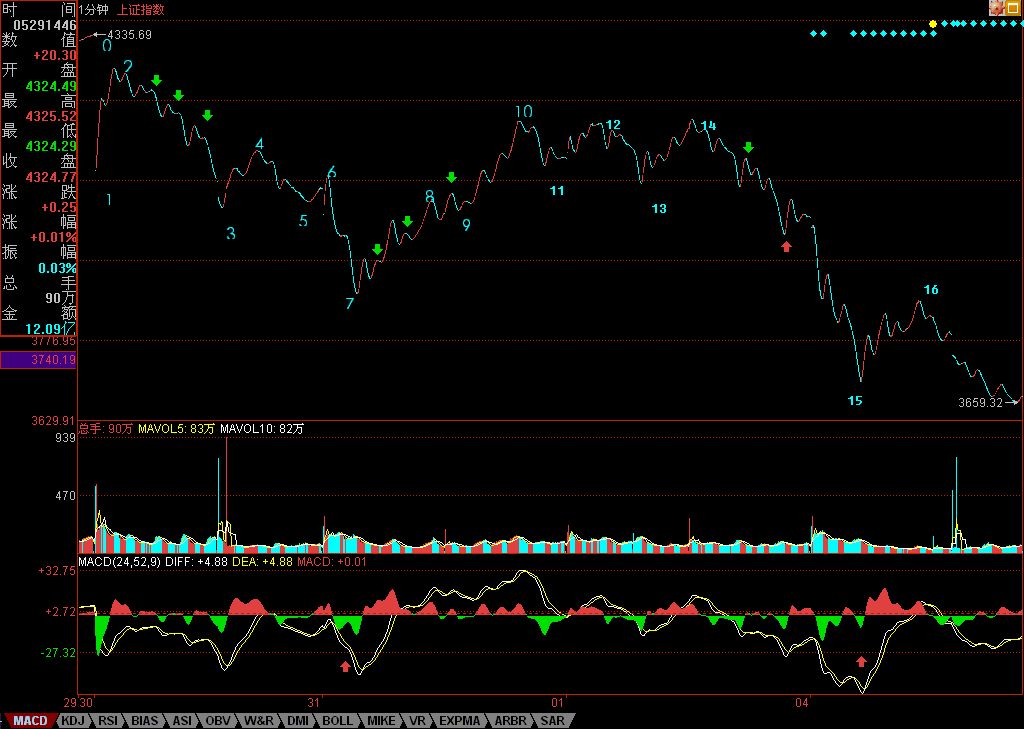
Many of you may still have significant doubts about how to determine line segments. The chart has already marked with numbers the line segments on the 1-minute chart starting from the 30th. Why these markings? For example, why isn't the section between 14-15 with the red and green arrows a separate line segment? This is simple: within that section, the sequence down-up-down-up-down has no overlap — the endpoint of the second up doesn't touch the starting point of the first up. This kind of pattern is no different from a straight drop. And a line segment, unless it's a gap, must consist of at least three folds — up-down-up or down-up-down. As long as adjacent ups or downs don't overlap, this pattern can extend indefinitely while still remaining a single line segment. From this, it's not hard to understand why 14-15 is just one line segment.
So why doesn't line segment 14-15 constitute a suitable buy point? Because in the MACD below, you can see this segment's strength is greater than all preceding ones (this is immediately obvious from the DIFF/DEA lines), so of course it doesn't constitute divergence at any level above 1-minute — at most just divergence at the absolute minimum sub-1-minute level. At the small red arrow below position 15, comparing the green bar areas reveals this small divergence, hence the 15-16 rebound. That rebound was resisted near the last upward within 14-15, which is very technical.
Looking from the 1-minute hub formed by 10-13, the 15-16 rebound actually constitutes a third-type sell point. This ID noticed in the comments that someone called CCTV also identified this as a third-type sell point, but his reasoning was that the rebound didn't break point 7, so it was a third-type sell point — that's incorrect, because if it were based on that point, the corresponding hub would be all wrong. Note: a third-type buy/sell point must involve a sub-level departure, a sub-level pullback, and it must be against the most recent hub at that level. As mentioned before, for rapidly moving markets, the third-type buy/sell point's departure distance can often be very far.
Starting from 16, there's a possibility of entering a divergence segment, but since tomorrow's market hasn't started yet, a sudden acceleration downward tomorrow could destroy this possibility. So whether divergence holds must be determined by the internal interval nesting of tomorrow's real-time movement. If divergence occurs, a rebound at minimum returns to point 15, which would at least form a 1-minute hub starting from point 15.
As for the 5-minute hub of 1-10, if that rebound can't return above 4015, it would form a 5-minute third-type sell point. Based on the current situation, this possibility is quite high. This also indicates that in the coming days, any rebound below 4000 points will constitute a sell point and at minimum trigger a larger-level hub, or even a new round of decline — unless the rebound can return above 4000 points. Clearly, from hub analysis, one can quite definitively analyze the operational characteristics of upcoming movements.
Looking at the even larger picture, for the market to stabilize again, a larger-level hub must form. Starting from 10, not even a new 5-minute hub has formed yet. If the new 5-minute hub ultimately doesn't overlap with the 1-10 five-minute hub, then a 5-minute level downtrend forms, and subsequent pressure would be even greater. So that CCTV person stumbled onto one correct point: point 7 has extremely strong technical significance. If even a 5-minute divergence-triggered rebound can return above that point, the market's trajectory could improve. Otherwise, short-term pressure persists.
Although this ID's theoretical analysis may seem quite complex, it is absolutely clear in logic, and every conclusion is rigorous, with no ambiguity at all. But the crucial first step is decomposing the chart correctly — otherwise everything falls apart. This requires lots of chart study and practice. So in the coming lessons, we'll continue decomposing this chart, at least until we see a daily-level hub form. Such concrete analysis should help with everyone's understanding and mastery.
Appendix:
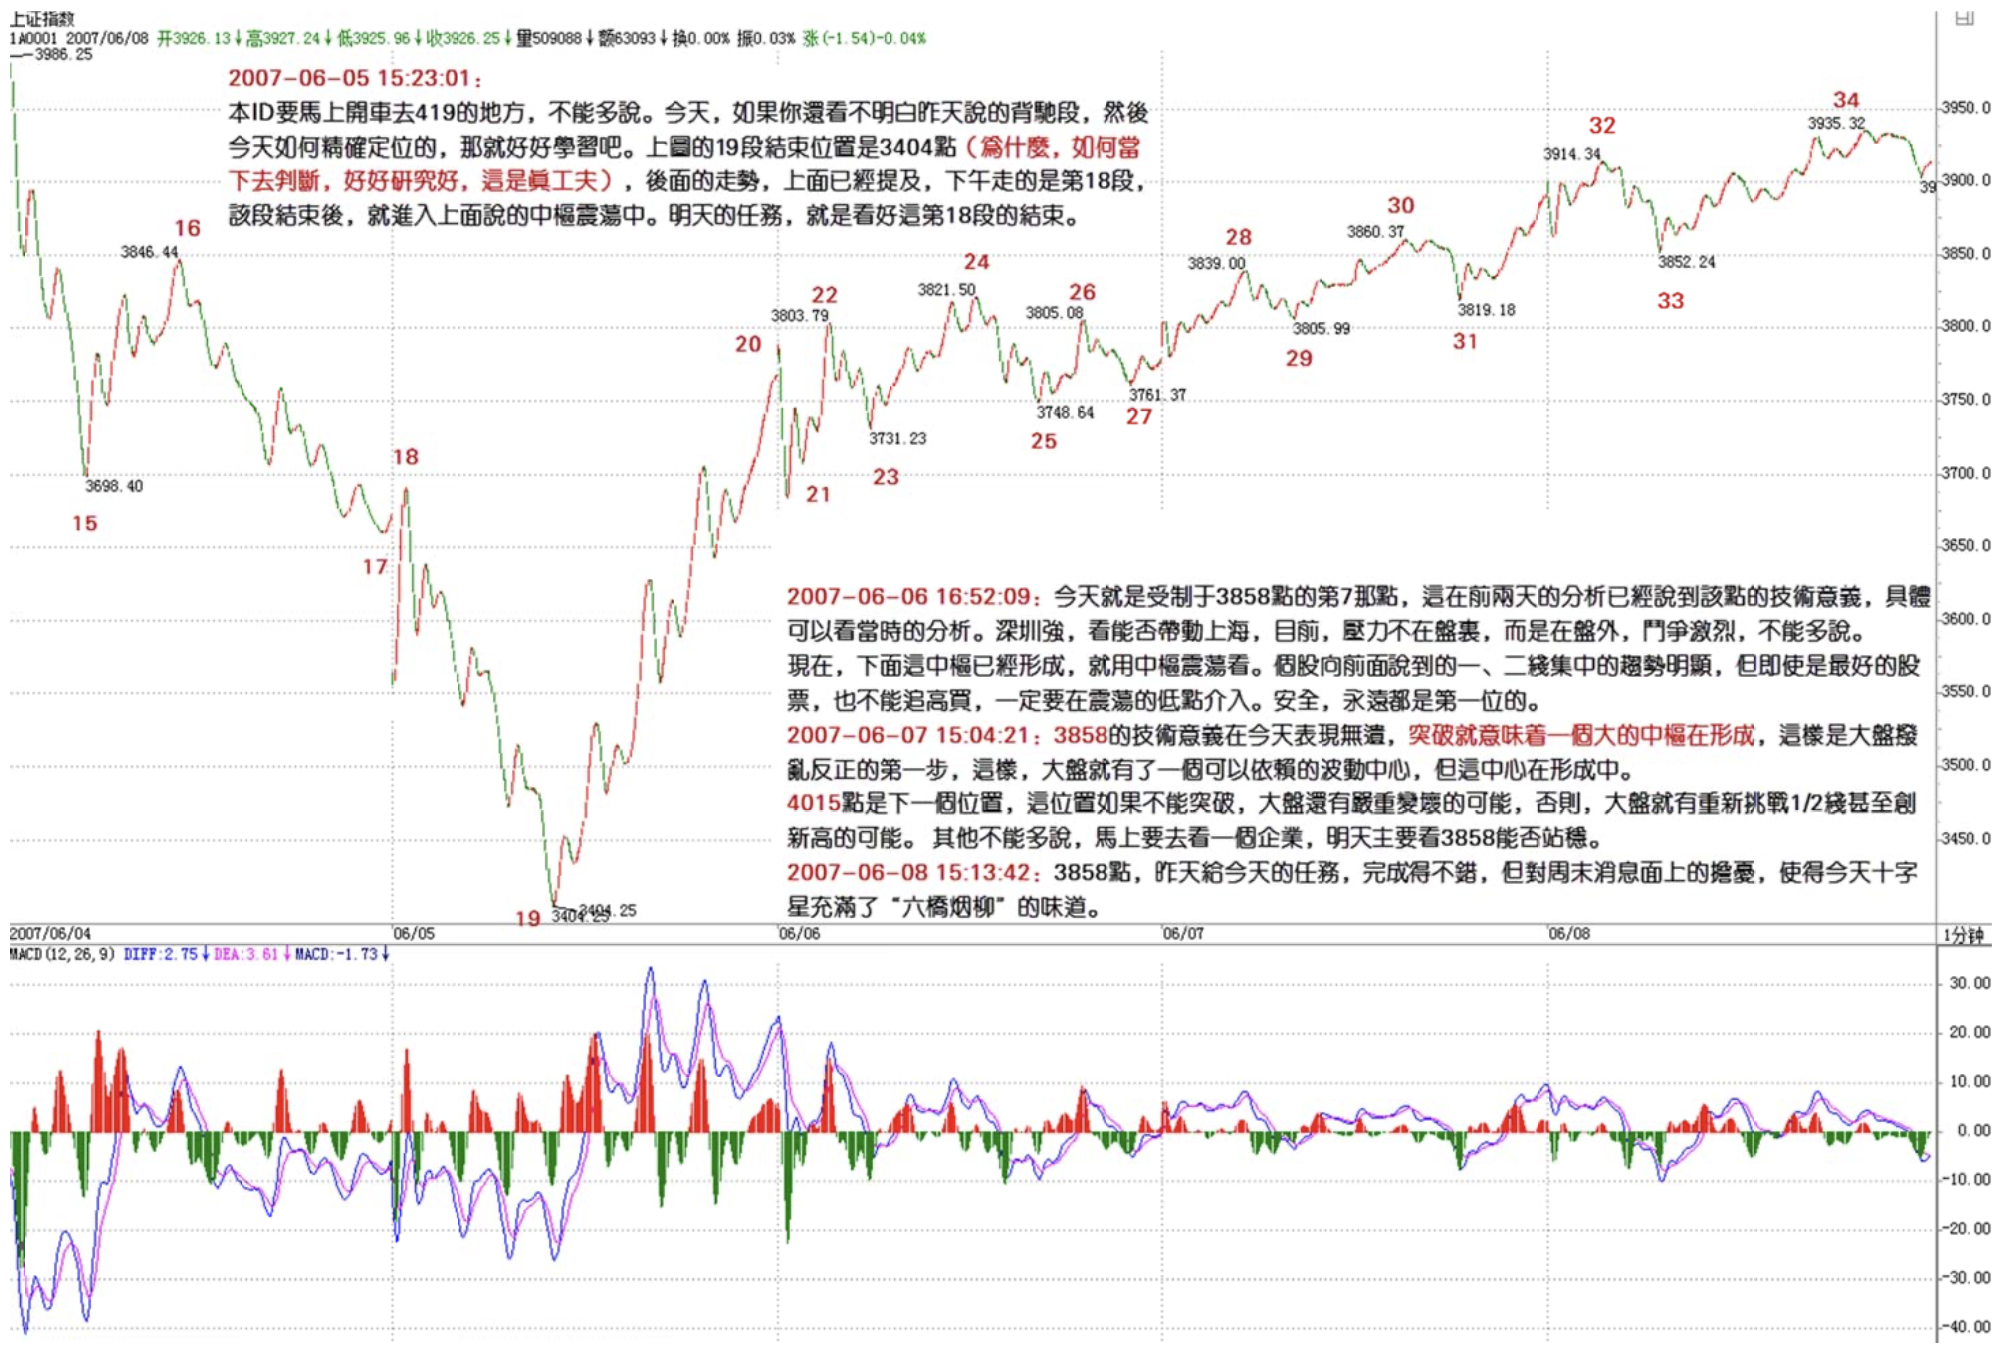
This ID must immediately drive to the 419 spot and can't say much. Today, if you still can't understand the divergence segment discussed yesterday and how it was precisely located today, then study hard. Segment 19 on the chart above ended at 3404 points (why and how to determine this in real-time — study this well, this is real skill). The subsequent movement has been mentioned above. In the afternoon, segment 20 was in progress. After that segment ends, we enter the hub oscillation discussed above. Tomorrow's task is to watch for the end of this 20th segment.
The big picture is the monthly 5-period moving average. Today's intraday false breakout, and at the 3434 general position no less — this isn't hard to spot.
Sorry, can't say more. This ID has done what needed to be done and said what needed to be said. Whether it becomes your own knowledge is not something this ID can determine.
See you at tomorrow's market commentary. No time for new posts.
Replies
缠中说禅 2007/6/4 22:45:33
A note — if you can't see the image, please find the one labeled 20070604 in this ID's photo album and zoom in.
Midnight — time to rest. Signing off, goodbye.
缠中说禅 2007/6/5 15:23:01
This ID must immediately drive to the 419 spot and can't say much. Today, if you still can't understand the divergence segment discussed yesterday and how it was precisely located today, then study hard. Segment 17 on the chart above ended at 3404 points (why and how to determine this in real-time — study this well, this is real skill). The subsequent movement has been mentioned above. In the afternoon, segment 18 was in progress. After that segment ends, we enter the hub oscillation discussed above. Tomorrow's task is to watch for the end of this 18th segment.
The big picture is the monthly 5-period moving average. Today's intraday false breakout, and at the 3434 general position no less — this isn't hard to spot.
Sorry, can't say more. This ID has done what needed to be done and said what needed to be said. Whether it becomes your own knowledge is not something this ID can determine.
See you at tomorrow's market commentary. No time for new posts.
缠中说禅 2007/6/4 22:38:00
Tomorrow I need to drive right after market close, so after appending the market commentary I won't be able to chat much with everyone.
Over the next few days, I'll try my best to write market commentary after the close. If sometimes it has to be in the evening, please understand.
Signing off first, goodbye.