Teaching You to Trade Stocks 32: The Present Moment of Trends and the Investor's Way of Thinking
2007/2/28 8:44:37
Attention all non-traitors, non-spies: there are certainly spies here. If you think of this place as merely a classroom, you're underestimating it. But one thing is beyond doubt: once you master this ID's theory, you have absolutely no need to listen to anyone's words — no matter whose. All words are nonsense; the trend always comes first. Newton cannot violate universal gravitation, and this ID cannot violate this ID's own theory — that is the most critical point. Only with this understanding can there be a correct foundation for thinking. You don't need to respect this ID. In fact, once you've learned this ID's theory, you can even deliberately oppose this ID, attempting to take this ID's money in the market. But you must respect this ID's theory, just as you must respect gravity — otherwise the market's movements will give you ample lessons every second of every minute.
The biggest problem with investors is having only one way of thinking, treating their own preferences as market reality. By that logic, bulls should forever go long and bears should forever go short — isn't that absurd? Take this time, for example. Before the Spring Festival, why go long? Because technically there was the requirement of forming the second segment of a hub — that was the objective condition for going long. When the second segment showed divergence, it meant the objective conditions for going long no longer existed. Stubbornly holding on at that point — wouldn't that be abnormal? Bull markets feature fast drops and slow rises; bear markets feature fast rises and slow drops. This most basic rhythm shouldn't be unknown.
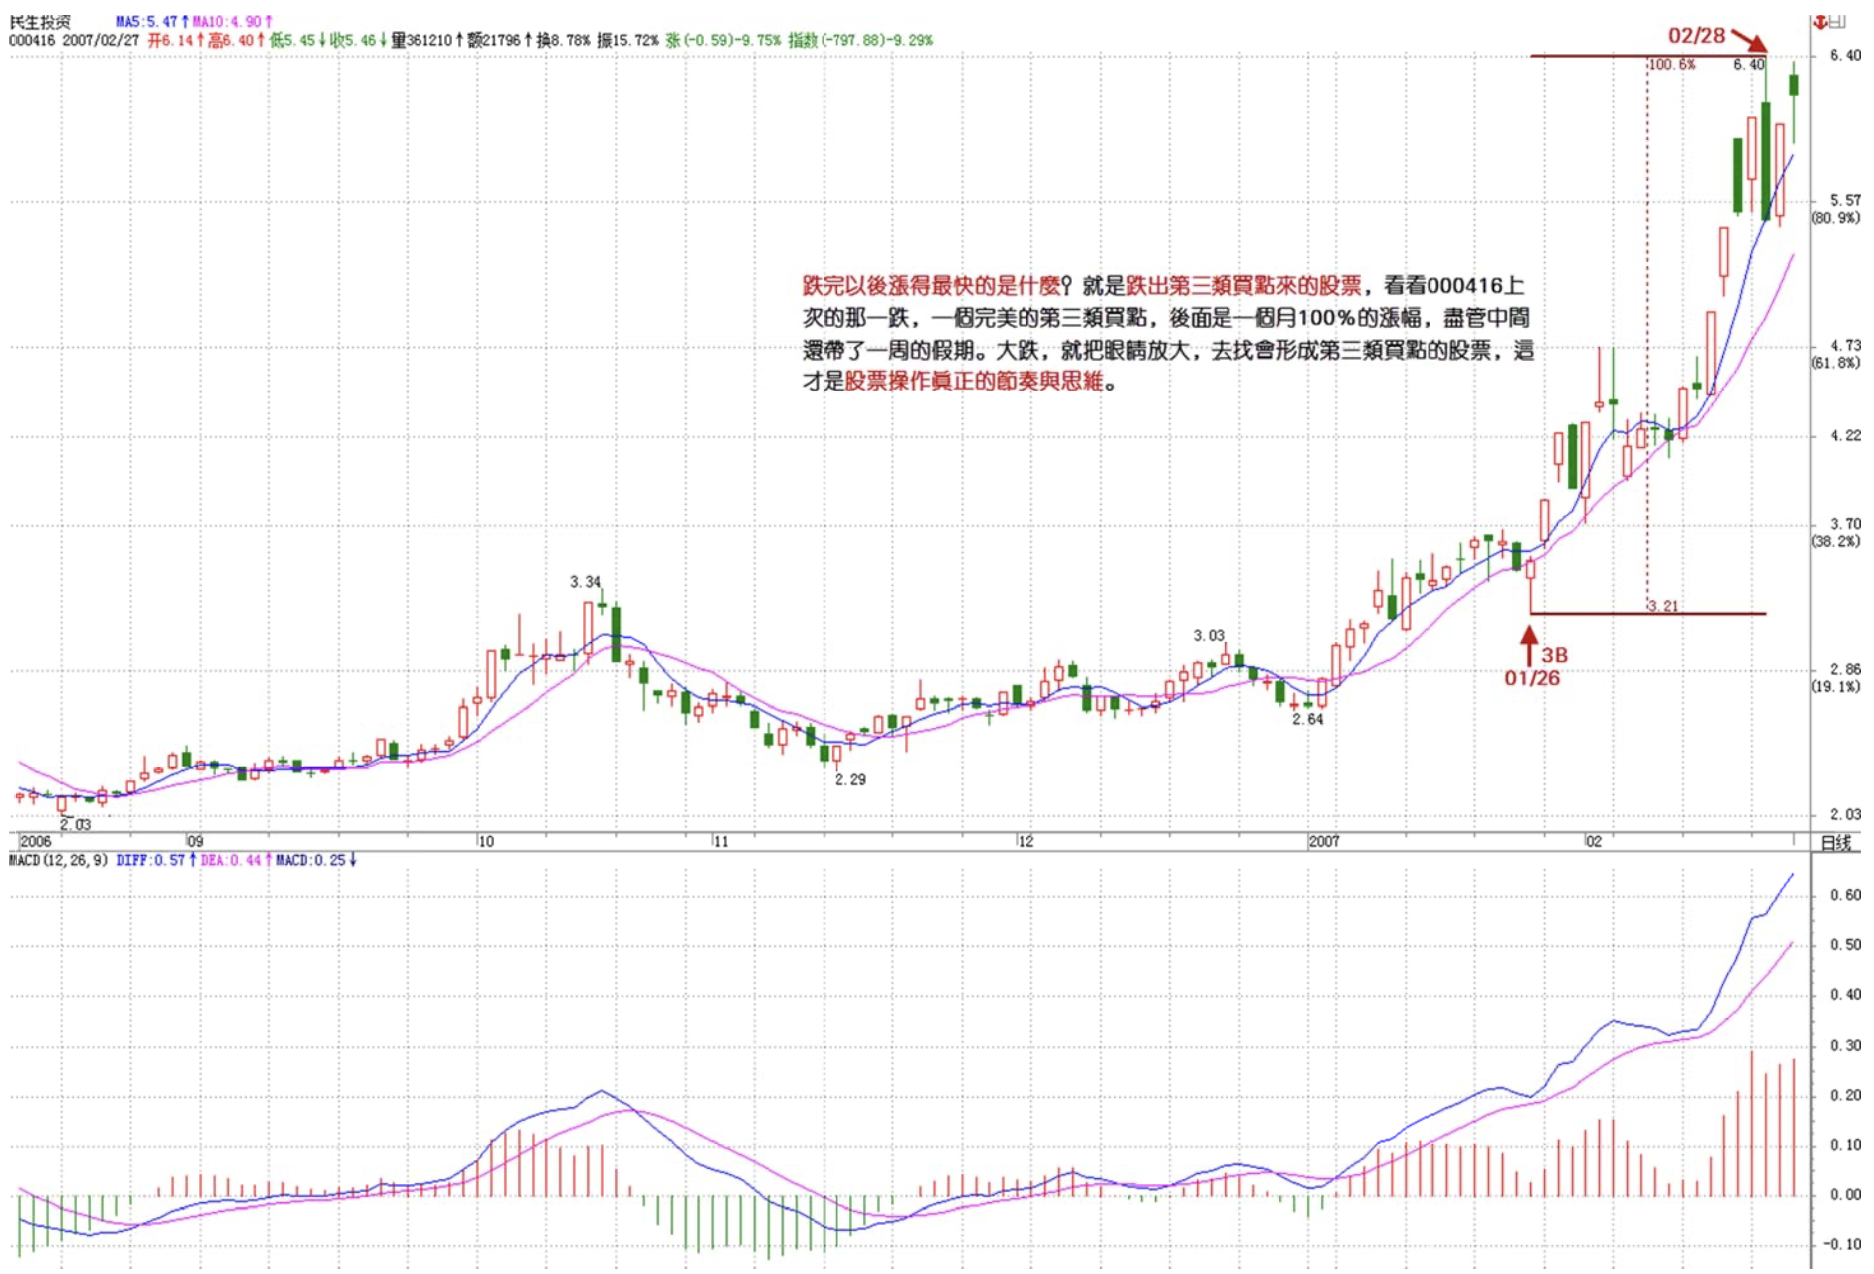
There's an even worse habit: only being happy when prices rise and looking miserable when they fall. Let me ask: if you only go long, how do you bring costs to zero? Stocks are all waste paper. Only going long means perpetually sitting on a ticking bomb. Previous articles have repeatedly emphasized: only zero-cost stocks are truly safe. If you don't change the ultra-bull or ultra-bear mentality, you'll forever be a slave to stocks. Moreover, what rises the fastest after a decline? Stocks that produce a third-type buy point from the decline. Look at 000416's recent drop — a perfect third-type buy point, followed by a one-month rally of 100% magnitude, with a week's holiday in between. During big drops, open your eyes wide and look for stocks that will form third-type buy points — this is the true rhythm and thinking of stock trading. In this ID's theory, there is no concept of risk. Risk is a non-operational, God-like concept. In this ID's eyes, there are only buy points and sell points, only divergence or non-divergence. These all have strict definitions and are operable — this is the only path to making stocks your slave.
Some might talk back to this ID: didn't you say Chinese territory is ruled by Chinese? Well, does being the ruler mean you can only rule when going long, not when going short? What kind of ruler is that? If you've grasped this ID's theory and strictly buy at buy points and sell at sell points, then you are the master of stocks. The so-called traitors merely hope to suck China's blood through their schemes. But if you have the skill to make traitors sell low and buy high, then the traitors are doomed. Just like this time — go ask who ate the bitter pill on China Unicom. This ID mentioned before that N years ago, an interception was carried out — pushing a stock from 14 yuan to 25 yuan in just over two weeks, selling everything, also around Spring Festival, without spending a penny. Why? Because certain people's rhythm was disrupted. You should remember Zhao Benshan and Fan Wei's auction skit — somewhat similar. The specifics of how it was done can wait until we discuss interception strategies later. But let me tell you the final result: that stock eventually fell back to just over 3 yuan.
Stocks are like dancing — the key is rhythm. Once the rhythm is off, nothing works. Buy at buy points, sell at sell points — that's the most perfectly matched rhythm. Anything that doesn't match this rhythm will cause trouble. For example, if you're operating on the 30-minute level, and there's clearly a top divergence but you don't sell, insisting it will go higher, then when the bottom divergence comes you can't take it anymore and cut your position — after a few rounds of this, you can stop playing stocks, because stocks will play you to death. Trends have their rhythm. When you trade stocks, it's like dancing with the stock — you must dance until your hearts are in sync, meaning, as discussed before, you're aligned with the resultant force. Only then are you going with the trend, only then are you an outstanding dancer. If you don't understand, go dancing today. Find a partner and treat their rhythm as the stock's rhythm — feel it out.
Feeling is in the present moment. If in the present you're thinking about before or after, you'll definitely dance poorly. Stocks are the same — there is only ever the present state of the trend. A stock's movement has no inevitable, God-like meaning; all meaning is conferred in the present. For example, in a 30-minute a+A+b+B+c upward movement, you cannot say after A has formed that B must exist — that would be prediction, assuming some mysterious force guarantees B's inevitable existence, which is impossible. So how do you know whether to stay during segment b or leave? It's simple and requires no prediction, because whether to stay during b is not determined by your preferences but by b's present trend. If b shows obvious divergence compared to a, that means it's time to leave; otherwise, stay. By referencing b's 5-minute and 1-minute charts, you can clearly feel how b grows organically — this constitutes a present-moment structure. As long as this present-moment structure doesn't produce any movement meeting the nested interval divergence conditions, you simply wait. The trend will naturally extend enough power at the 30-minute level to make divergence impossible. This all happens naturally, without any prediction from you.
In detail: in the above 30-minute a+A+b+B+c example, A has already appeared and is a 30-minute hub — this can be strictly confirmed by definition, with no ambiguity or prediction. Segment b absolutely cannot contain a 30-minute hub, meaning at most it's at the 5-minute level. If even one 5-minute level upward move in b already makes it impossible for the 30-minute chart to show divergence, then you have sufficient time to wait for the trend to extend, waiting for it to form a 5-minute hub, until the 5-minute trend shows divergence — this means B is about to appear, a new 30-minute hub is forming. Whether to exit relates to your capital operation: if you prefer short-term trading, you can sell some, then after the first segment of this hub appears, buy back; at the high point of the second segment, watch for 5-minute or 1-minute divergence to sell again; then buy back on the third segment coming down; and then watch whether this hub can break upward to produce the c segment. Note: the c segment is not divinely ordained — just as a is not divinely ordained. For a c segment to appear, like a b segment, there must be a third-type buy point relative to the 30-minute level. So your operation is simple: each time a 5-minute upward departure from the hub diverges, you should exit. Then if a 5-minute level pullback doesn't return to inside the hub, that means there's a third-type buy point, so you should buy back and await segment c's rise. And operating c is the same as b — whether to stay can be entirely judged by the present-moment trend, without any prediction. No divergence means there will be a third hub appearing, and so on. Obviously, the operations above don't require you to predict anything — you just need to feel the present-moment rhythm of the trend. And this feeling has nothing mysterious about it; it's simply being able to read according to definitions.
Now, in the 30-minute a+A+b+B+c, must B necessarily be the same level as A? Posing this question again shows a lack of understanding of a trend's present-moment nature. When you have a+A+b, you cannot know B's level. However, as long as b doesn't diverge, B is at least the same level as A. But B could very well be a larger level than A. In that case, you can't say a+A+b+B+c represents a certain level's uptrend — instead, a+A+b becomes an a', taking on the meaning of a'+B. But regardless of the interpretation, in present-moment operations there's no difficulty. For example, when B expands into a daily hub, then you need to explore its operational meaning on the daily chart. If there's a subsequent c segment, use daily-level standards to assess its divergence — this is all present-moment. As for hub expansion, the procedures all have strict definitions — just operate according to them. Inside the hub is the easiest place to make short-term trades and lower costs — the key is to make good use of various sub-level divergences or consolidation divergences.
So all prediction is meaningless — present-moment feeling and reaction are what matter most. You must read the market's signals at all times. This is the most fundamental and essential point of applying this ID's theory. If you can't even read the market's signals and rhythm, everything else is meaningless. But there's another very important point: even if you can read the market but don't operate according to the signals — always harboring lucky-break mentality — that's also meaningless. Following the nested interval principle, you can trace all the way down to order-flow information. If you discover order-flow anomalies within a divergence that conforms to the nested interval principle, then you can succeed at operating at the most precise turning points. This ID's theory rejects no method — order-flow skills can equally be integrated into this theory. But the key is applying them in the right context, not every order-flow anomaly is meaningful. Because this ID's theory examines the market from its very roots, once you've grasped it, you can integrate various theories — fundamentals, policy, capital flows, market makers, and so on. How these factors work and whether they're effective are all reflected in this basic framework of market trend movements.
Since the market is in the present moment, investors' thinking should also be in the present moment. Anyone who habitually fantasizes is substituting fantasy for the present moment, obscuring their sensitivity to the current real trend. In this market, what matters is operations, not boasting or predicting. Some might retort: doesn't this blog also frequently say prediction-like, boastful things? For example, this ID said a couple of days ago to let the traitors dump Unicom shares. Let me ask: could the traitors possibly hold billions of Unicom shares? Must this ID catch their dumps? Why can't this ID dump first? Why must this ID catch dumps at top divergences? This ID isn't crazy. If the traitors have a hobby, they should preferably dump at bottom divergences — this ID would certainly welcome that. And for this ID, if a few words can serve as a million troops, why wouldn't this ID say them? This ID also has no interest in knowing who had a stroke between 9:36 and 9:45 yesterday on Unicom, bravely pushing out a top divergence at 5.52 — at that moment, this ID saw only a sell point, nothing more. Even without knowing this ID's theory, at the most basic level, can't you even see where the line connecting January 4th and January 30th is?
Attention all non-traitors, non-spies: there are certainly spies here. If you think of this place as merely a classroom, you're underestimating it. But one thing is beyond doubt: once you master this ID's theory, you have absolutely no need to listen to anyone's words — no matter whose. All words are nonsense; the trend always comes first. Newton cannot violate universal gravitation, and this ID cannot violate this ID's own theory — that is the most critical point. Only with this understanding can there be a correct foundation for thinking. You don't need to respect this ID. In fact, once you've learned this ID's theory, you can even deliberately oppose this ID, attempting to take this ID's money in the market. But you must respect this ID's theory, just as you must respect gravity — otherwise the market's movements will give you ample lessons every second of every minute.
Supplement: There are many replies, and I'm afraid some people might miss it, so I'm putting today's closing commentary here:
The reason for publishing the lesson so early today was to let everyone learn in real time. Watch how a+A+b+B+c transforms into a'+B. If you didn't dare to buy back this morning, then the third-type buy point at 13:51 should have been impossible to miss. Moreover, individual stocks have different rhythms from the index — how have low-priced Shenzhen local stocks performed these two days? Which sector hit the daily limit first today? Unless your eyes have problems, you should be able to see clearly. If you didn't see the lesson this morning, then carefully study the past two days' 1-minute charts in conjunction. If you can digest this lesson, your level can advance to second year of middle school.
The subsequent market trend is simple: it's about 2,915, yesterday's 1-minute hub high. If you can't understand, look at the 5-day moving average. If it can't get above it, then a second bottom test; otherwise it's a V-shaped reversal, attacking 3,000 again.
As for individual stocks, there's nothing much to say. Today's lesson specifically directed everyone to find third-type buy points: "During big drops, open your eyes wide and look for stocks that will form third-type buy points — this is the true rhythm and thinking of stock trading." Not just the thinking itself, but also how to adjust your mindset. With this live broadcast, has everyone gotten a feel for the rhythm? Those who read the lesson this morning and could understand it — you're blessed.
Commendation for CCTV, for these words:
[Anonymous] CCTV
2007-02-28 10:20:59 [Anonymous] 老新手
2007-02-28 09:53:25 The second 1-minute hub has formed, now let's see whether there's divergence afterward.
-
Not necessarily — study closely the two examples sister gave in today's article.
[Anonymous] CCTV
2007-02-28 10:24:40 I think there's another possibility for the market, which is to form the a'+B that sister described in the article, then break through B and go straight up. It should now be viewed as a'+B.
Replies
缠中说禅 2007/2/28 8:51:37
[Anonymous] 风
2007-02-28 08:49:29
So early today
==
Good morning. Time to prepare for the market open — logging off first. I'll be back after the close. See you.
缠中说禅 2007/2/28 15:15:26
The reason for publishing the lesson so early today was to let everyone learn in real time. Watch how a+A+b+B+c transforms into a'+B. If you didn't dare to buy back this morning, then the third-type buy point at 13:51 should have been impossible to miss. Moreover, individual stocks have different rhythms from the index — how have low-priced Shenzhen local stocks performed these two days? Which sector hit the daily limit first today? Unless your eyes have problems, you should be able to see clearly. If you didn't see the lesson this morning, then carefully study the past two days' 1-minute charts in conjunction. If you can digest this lesson, your level can advance to second year of middle school.
The subsequent market trend is simple: it's about 2,915, yesterday's 1-minute hub high. If you can't understand, look at the 5-day moving average. If it can't get above it, then a second bottom test; otherwise it's a V-shaped reversal, attacking 3,000 again.
As for individual stocks, there's nothing much to say. Today's lesson specifically directed everyone to find third-type buy points: "During big drops, open your eyes wide and look for stocks that will form third-type buy points — this is the true rhythm and thinking of stock trading." Not just the thinking itself, but also how to adjust your mindset. With this live broadcast, has everyone gotten a feel for the rhythm? Those who read the lesson this morning and could understand it — you're blessed.
Commendation for CCTV, for these words:
[Anonymous] CCTV
2007-02-28 10:20:59
[Anonymous] 老新手
2007-02-28 09:53:25
The second 1-minute hub has formed, now let's see whether there's divergence afterward.
-
Not necessarily — study closely the two examples sister gave in today's article.
[Anonymous] CCTV
2007-02-28 10:24:40
I think there's another possibility for the market, which is to form the a'+B that sister described in the article, then break through B and go straight up. It should now be viewed as a'+B.
缠中说禅 2007/2/28 15:24:53
[Anonymous] 水房姑娘
2007-02-28 15:21:18
Chan M, now junk stocks are being speculated. Does this mean the rally is in its third wave and about to end?
==
Even if it's the third wave, it's the third wave of the first major wave. This bull market running for 10 or 8 years — what's so strange about that? The last bull market lasted a total of 13 to 14 years.
缠中说禅 2007/2/28 15:29:13
[Anonymous] Little Bird
2007-02-28 15:16:28
Sister, is this now the first segment of a 5-minute hub?
==
The current trend is simple. This morning was a 5-minute hub, and in the afternoon a third-type buy point appeared, then a departure. The key question now is whether another hub can form above this one. If this hub can hold above the 5-day MA and 2,915, then we can look forward to another push at 3,000. If not, then it'll come back down to form a 30-minute hub.
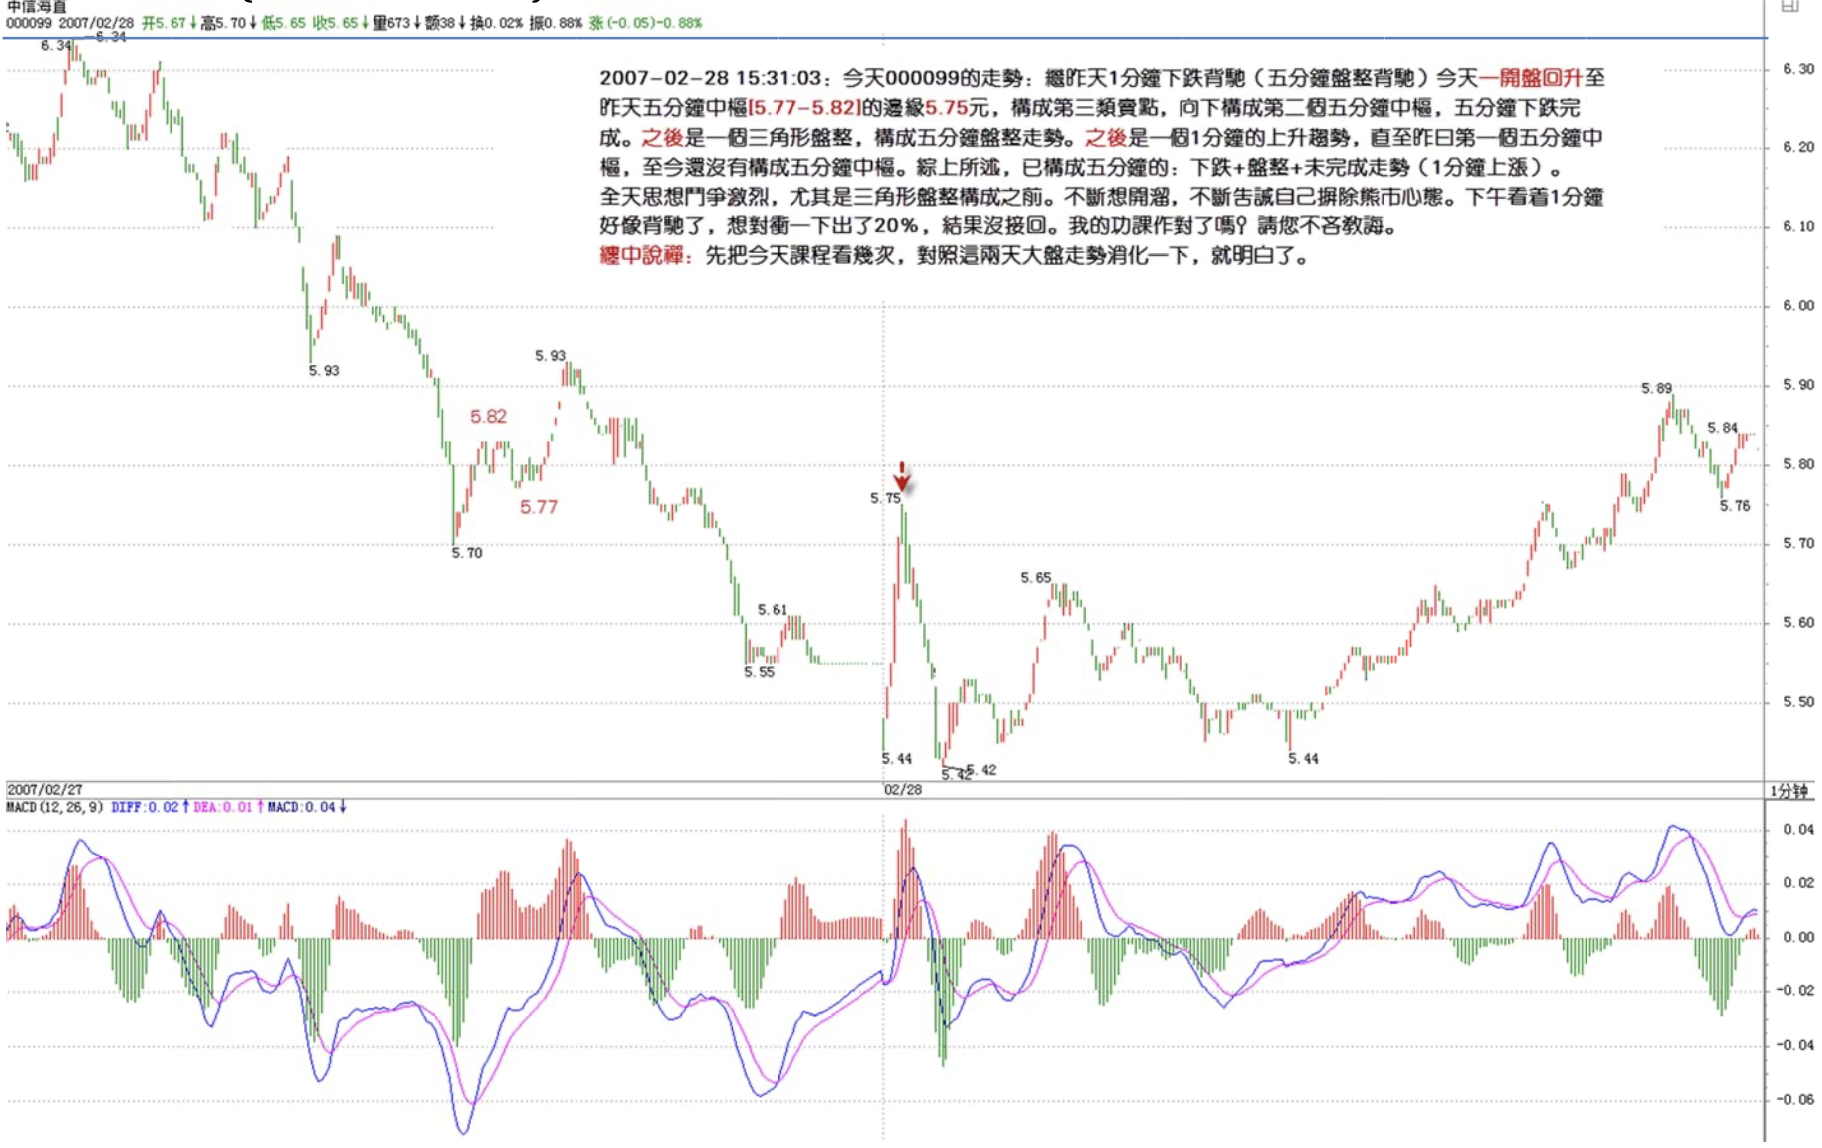
缠中说禅 2007/2/28 15:31:03
[Anonymous] 戈石
2007-02-28 15:19:41
Dear Queen:
Today's movement of 000099: Following yesterday's 1-minute downward divergence (5-minute consolidation divergence), at the open today it recovered to the edge of yesterday's 5-minute hub [5.77-5.82] at 7.74 yuan, forming a third-type sell point. It then moved down to form a second 5-minute hub, completing a 5-minute decline. After that was a triangular consolidation forming a 5-minute consolidation pattern. Then a 1-minute uptrend followed, all the way up to yesterday's first 5-minute hub — still hasn't formed a 5-minute hub yet. In summary: a 5-minute structure of decline + consolidation + incomplete movement (1-minute rise).
All day long my thoughts were battling, especially before the triangular consolidation formed. Constantly wanting to flee, constantly reminding myself to abandon the bear market mentality. In the afternoon, seeing what looked like 1-minute divergence, I sold 20% to hedge, then didn't buy back.
Did I do my homework correctly? I beg the Queen's guidance.
Invincible Chan theory!!!!!!!!!!!!!!!!!!!!!!!!!!!!!!!!!!!!!!!!!!!!!!!!!!!!!!!!!!!!!!!!!!!!!!!!!!!!!!!!!!!!!!!!!!
==
First read today's lesson several times and digest it in conjunction with the past two days' market movements ��— then you'll understand.
缠中说禅 2007/2/28 15:31:47
[Anonymous] 好养的鱼
2007-02-28 15:29:25
Chan MM's theory is too profound. I haven't even learned the basics yet.
Hope it can also apply to stocks like China Merchants Bank.
==
It applies to any stock, unless only one person is trading it.
缠中说禅 2007/2/28 15:33:55
[Anonymous] 面甲
2007-02-28 15:31:21
"The subsequent market trend is simple: it's about 2,915, yesterday's 1-minute hub high."
Chan sister, isn't the hub's high and low points Min(a1,b1,c1) and Max(a2,b2,c2)?
Why would it be 2,915? Shouldn't it be 2,894?
=
Sorry, not stated precisely enough — it's the highest point GG of the oscillation around the hub. The hub's upper boundary is around 2,894.
缠中说禅 2007/2/28 15:35:28
[Anonymous] 酒吧心情
2007-02-28 15:32:05
Reading Chan JJ's lesson this morning, although I didn't immediately grasp what it meant,
but today there were indeed significant gains, especially the third-type buy point at 13:51.
However, I still have a question for JJ:
The pullback to 2,809 at 13:35 — why wasn't that a third-type buy point?
Is it because it fell back into the hub's oscillation range at 2,811?
So the subsequent pullback at 13:51 then formed the third-type buy point.
If JJ could tell me the answer, I think I'd have a completely new understanding of the third-type buy/sell point.
I hope JJ can provide guidance! Thank you!!!
==
You need at least a sub-level pullback, so on the tick chart at minimum there should be three segments: down-up-down.
缠中说禅 2007/2/28 15:36:28
[Anonymous] 快
2007-02-28 15:35:27
So would you say the first 5-minute hub is nearly complete now?
==
You still haven't understood today's lesson. It already formed this morning, and the third-type buy point in the afternoon confirmed its completion.
缠中说禅 2007/2/28 15:38:56
[Anonymous] 满目山河
2007-02-28 15:32:45
Chan sister is truly full of surprises — who knew new material would appear so early? Just arrived, only now seeing it.
Chan sister, are you in a rush to teach us?
I'd rather see the complete course sooner. Looking forward to it.
==
With this live version, watching in real time leaves a deep impression. Watching after the fact, even ignoring the chatter, isn't as good for understanding. Those who didn't see it today will just have to look at the already-formed charts and imagine that live atmosphere.
缠中说禅 2007/2/28 15:41:05
[Anonymous] 盖楼
2007-02-28 15:15:01
Reading your articles, I feel they're very difficult for the general public to grasp. Why not be more direct? Stock price movements are essentially the process of chip migration, like building a tower — first lay the foundation, then go up floor by floor. Understanding the characteristics of each phase is most important. Trading without considering cost is suicide.
==
You probably haven't read all the articles. Don't use those vague, ethereal concepts. Only when the cost is zero is it truly safe — everything else is nonsense.
缠中说禅 2007/2/28 15:43:20
[Anonymous] Little Bird
2007-02-28 15:37:06
Once again I realize: don't predict, just observe the present!
This was completely different from what I had estimated beforehand.
==
Prediction is actually acceptable, but you need to list all possible scenarios clearly. Like this ID's live broadcast of today's trend — you didn't think of it, so you missed it. Actually, all scenarios are basically the one you predicted plus the one broadcast live today. If you figure out all these scenarios, you can advance to second year of middle school. Keep working at it.
缠中说禅 2007/2/28 15:46:14
[Anonymous] Little Bird
2007-02-28 15:42:27
Need to see if a second 5-minute hub forms tomorrow and whether it holds, right?
==
If your technique is good, you can use the hub's oscillation for some hedging. For example, if it can't break through the 5-day MA, sell first; when it drops back, if there's no one-sided movement and a hub can form, buy back. Of course, this depends on specific stocks. Some stocks are strong, already in uptrends — just watch for the individual stock's divergence. If your technique isn't up to par, trade less. Research thoroughly first.
缠中说禅 2007/2/28 15:51:25
[Anonymous] 惊鸿一慕
2007-02-28 15:44:33
Thank you Chan sister for the theory.
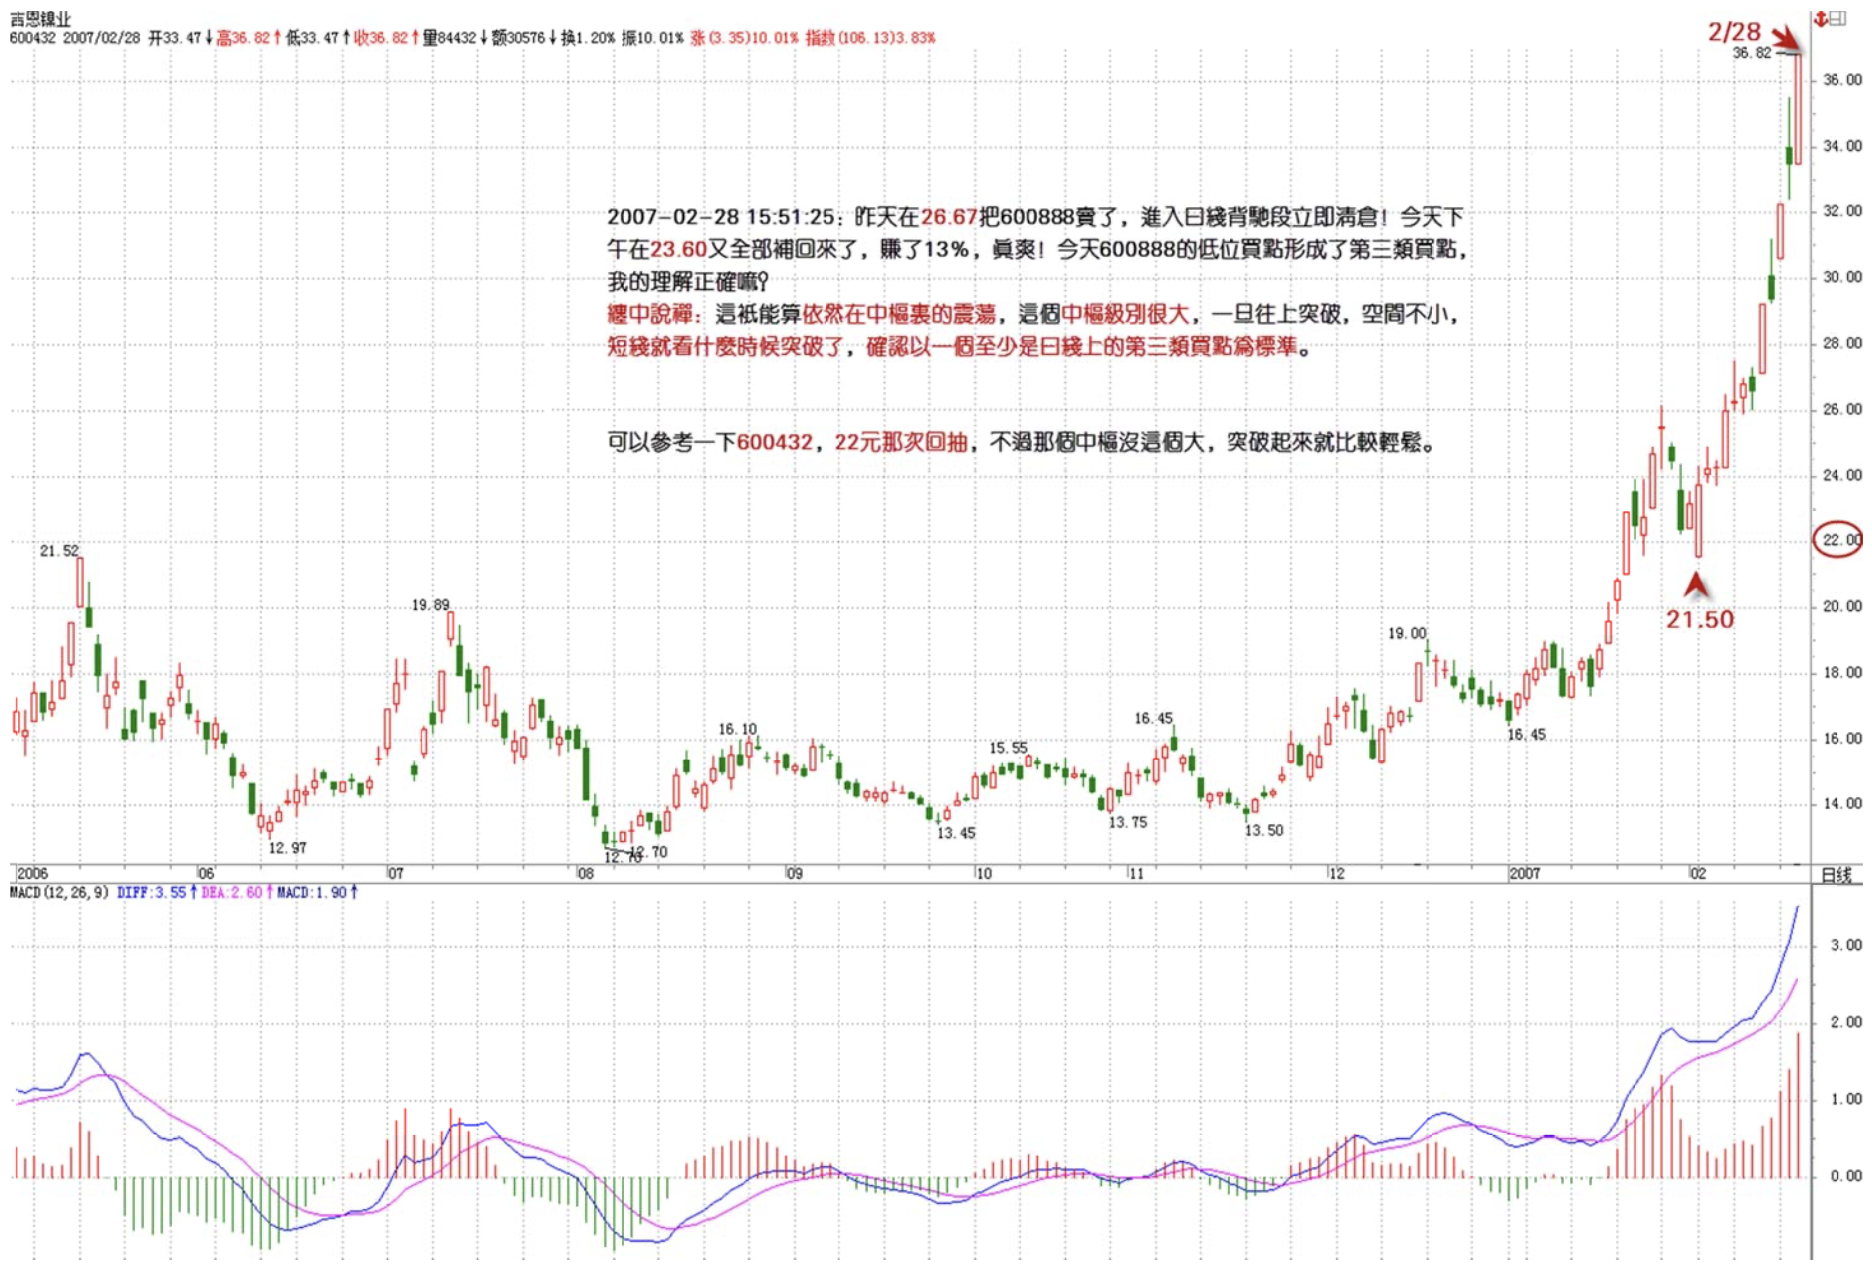
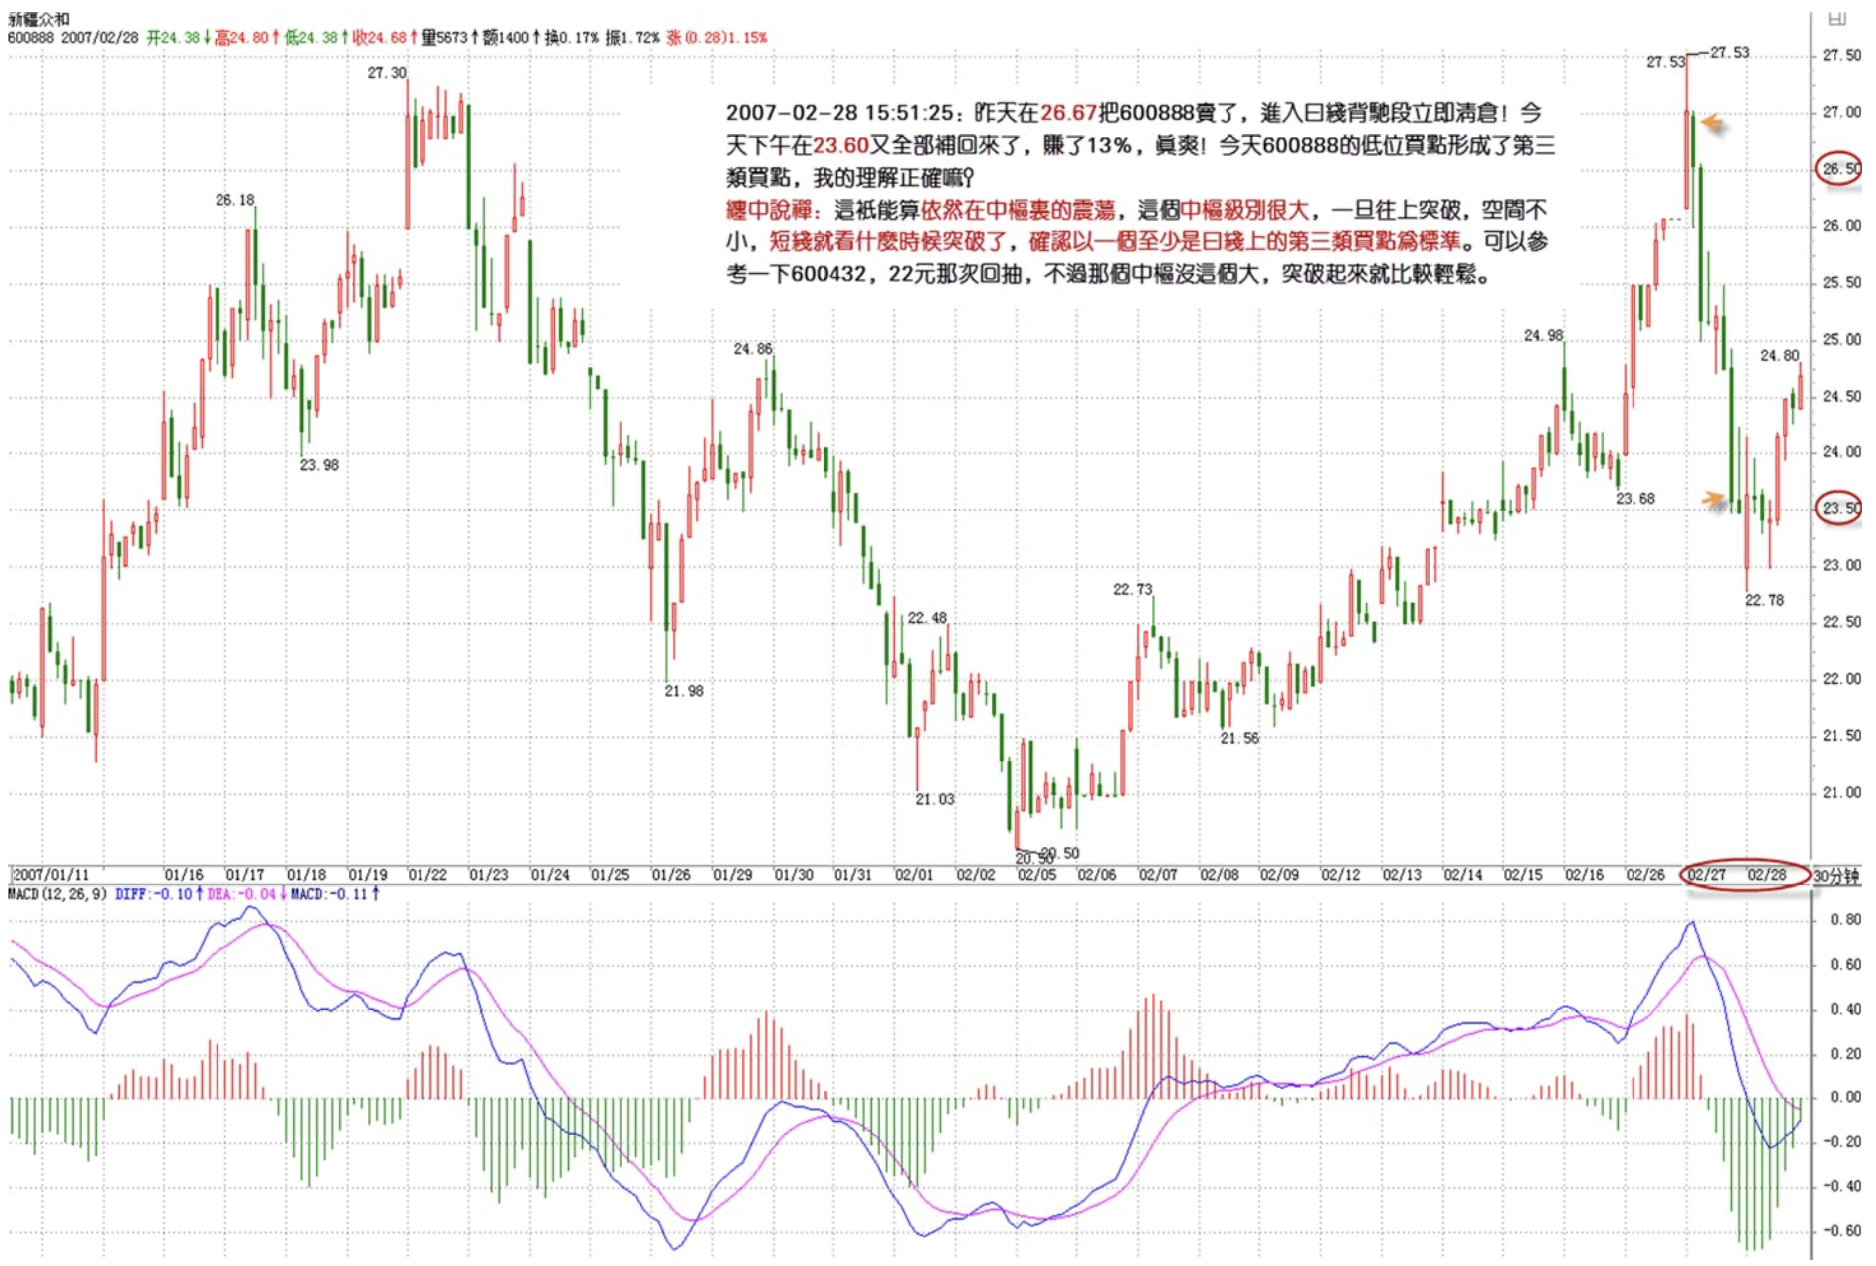
Yesterday I sold 600888 at 26.67 — cleared the position immediately upon entering the daily divergence segment!
Today afternoon I bought everything back at 23.60, earning 13%. Feels amazing!
Chan sister, didn't today's low buy point on 600888 form a third-type buy point? Is my understanding correct? Thank you.
==
This can only be considered oscillation still within the hub. This hub is quite large in scale — once it breaks upward, the upside is considerable. For short-term trading, just watch for when the breakout happens, confirmed by at least a daily-level third-type buy point. You can reference 600432's pullback at around 22 yuan, though that hub wasn't as large as this one, so the breakout was relatively easy.
缠中说禅 2007/2/28 15:58:26
[Anonymous] 瞎鼓捣
2007-02-28 15:52:33
Strange! I can't find my question. Retyping:
If I entered at a 30-minute buy point, do I have to wait for 30-minute divergence to exit? Is it possible for a reversal to occur without waiting for 30-minute divergence? If so, how should I operate?
==
You still haven't understood this lesson. If it's a+A+b+B+c, then naturally it's 30-minute divergence. If it evolves into a'+B, then perhaps even a lowest-level divergence triggers a B, and then it breaks below or above B. In that case, you don't necessarily wait for 30-minute divergence, because by then B is already at the daily level or above, and you need to judge based on this larger hub. Think it through — these are two different situations. Future lessons will analyze this in detail, but you can start thinking about it now.
缠中说禅 2007/2/28 16:00:07
[Anonymous] 也许认识你
2007-02-28 15:55:15
One more question: after the third-type buy point appears and there's a rise, what if it then directly falls back into the previous hub? How should this be handled?
==
If divergence appears during the rise, you should have already exited — no need to wait for the decline. If no divergence appears, at minimum a new hub forms above, and there's absolutely no problem. Don't get the rhythm wrong.
缠中说禅 2007/2/28 16:01:29
[Anonymous] Hindsight
2007-02-28 15:58:33
Thanks to the blog host's care, I saw today's third-type buy point and captured it. Also shared it with fellow students in the group.
It's just that the stock I bought hasn't started moving yet.
==
You need to follow the stock's own trend. The market index is just a reference. Generally, as long as the market isn't in a one-sided decline, second- and third-tier individual stocks aren't greatly affected by the index.
缠中说禅 2007/2/28 16:03:25
[Anonymous] 箭梦弦歌
2007-02-28 15:56:25
During the formation of a'+B, my only basis was that the consolidation pullbacks kept getting higher, so I believed it probably wouldn't break below the hub, until the third-type buy point formed, finally confirming that a+B had formed — is my thinking correct? Chan mm, please answer!
==
The movements within B also have sub-levels, and you can equally use divergence and similar methods to determine buy/sell points. Consolidation can actually be handled simply — just look at the sub-level. Decompose and operate segment by segment. Of course, for particularly small levels, there's no need to operate.
缠中说禅 2007/2/28 16:10:12
[Anonymous] 大盘
2007-02-28 16:01:36
Blogger, why can't we view the Shanghai index from January to now as still oscillating within the daily hub formed in January? Hasn't every 30-minute rise been followed by a 30-minute return to the hub?
Doesn't daily hub expansion require two non-overlapping daily hubs whose oscillation high/low points momentarily overlap?
I feel like many stocks are currently still in first daily hub extension. How do we judge the low points of hub extension and reversals — also by sub-level divergence within the extension segment? I'm quite confused.
==
Extension cannot exceed 9 sub-level segments, otherwise it becomes a larger level — this is easily understood from the definition. For example, 9 thirty-minute extensions, every three forming a daily level, three daily levels naturally becoming a weekly level. You can count how many there are now — it's already enough to form a weekly hub. Note: if the stock price is a straight line without fluctuation, you can't add up this way. For example, a stock locked at the daily up limit can only count as at most 1-minute level, because to form larger levels you first need fluctuation. Without fluctuation, there's no question of expansion or extension.
缠中说禅 2007/2/28 16:12:29
General Secretary
2007-02-28 16:03:47
Blogger,
Once A has formed, must there necessarily be a b?! What if a reversal happens inside A?
First, what are the conditions for b to form?
What if A already forms a daily-level hub?
Also, is the market currently within a 5-minute A? Then the preceding a only has one hub?
Blogger, you haven't answered many of my previous questions. Please answer today!
Many thanks!
==
Haven't I already said this repeatedly above? Third-type buy point. Why did the market break through the morning's 5-minute hub in the afternoon? Because there was a third-type buy point. Study this more carefully.
缠中说禅 2007/2/28 16:15:33
[Anonymous] 大盘
2007-02-28 16:10:38
Blogger:
Regarding hub expansion — for example, if a top divergence appears at the second 5-minute hub, and the subsequent decline expands into a 30-minute hub, and if the decline is severe enough to break below not just the first 5-minute hub's highest point but also the highest point of a preceding daily hub — does the hub directly expand to weekly level, or is it still considered daily hub extension?
==
Whether to act on a 5-minute divergence depends on the 30-minute and daily situation at that time. If the larger level is in the main uptrend, even if you exit you should buy back. If it matches the nested interval conditions, then you can't casually buy back. So the problem of "what to do if it falls back" doesn't exist, because at that point what you need to consider is whether to buy, not whether to sell. Don't get the rhythm wrong.
缠中说禅 2007/2/28 16:16:17
[Anonymous] 新年好
2007-02-28 16:07:22
This morning I was worried it wouldn't go up, so I sold part of my position. Now I regret it terribly.
==
Look at the chart, not at your own worries.
缠中说禅 2007/2/28 16:19:38
Got a dinner engagement tonight. Logging off first. Everyone study well.
Bye.
缠中说禅 2007/2/28 16:22:01
[Anonymous] 三藏
2007-02-28 16:19:04
Blogger, I didn't see your response. Posting again — I really don't understand:
You said today:
"The subsequent market trend is simple: it's about 2,915, yesterday's 1-minute hub high. If you can't understand, look at the 5-day moving average. If it can't get above it, then a second bottom test."
What's the principle behind this?
Why would failing to hold above ZG lead to another decline? I don't understand the principle of this bottom test.
Please explain. Thank you!!
==
Every hub's GG and DD are among the most important positions, both creating resistance or support. The principle will be explained in future lessons.
Logging off now. Bye.
缠中说禅 2009/6/13 12:08:17
When the destiny arrives.
缠中说禅 2007/2/28 8:50:44
Any movement in the market is the best free training. Paper trading is useless — what matters is actual operations, achieving unity of mind and hand. Otherwise it's a waste of time. The market only recognizes the trend itself; everything else is superfluous. Without a round of tempering, one cannot become an accomplished instrument — do your best, everyone. Today I'm posting the article early, hoping that through the major oscillation, each of you can have an epiphany. If so, that would truly do justice to both the oscillation and this ID's article.