Teaching You How to Trade Stocks 49: The Operation Mode with Maximum Profit Rate
2007/4/26 8:16:56
This week we won't be interpreting "The Analects" — not because this ID doesn't want to write, but because the May Day holiday is a good opportunity for those who want to learn more of this ID's theory. So this ID will write more on this topic, preparing extra material for those in need. After all, this is more urgent for most people. Having discussed so many scenarios previously, from a practical standpoint, to clarify the basic operational thinking, let's insert this lesson first.
Suppose a person takes money originally destined for a 419 outing and prepares to enter the market. First, you must clarify what level you'll operate at — this has been discussed repeatedly before. Let's assume that level is 30-minute. Upon entering the market and opening the chart, what should you look for first? You should find the last 30-minute hub before the current moment. This principle applies equally to any newly entered stock. For example, if you exit a stock and select a new one, you'll face the same situation.
Obviously, three scenarios will arise: 1. The current price is within that hub. 2. The current price is below that hub. 3. The current price is above that hub. Note: this last 30-minute hub can be confirmed immediately without any prediction — of course, the prerequisite is that you've first mastered the theory this ID has explained previously. If you can't even identify a hub, then there's nothing to be done.
For the first scenario, obviously the hub is still extending. For the latter two scenarios, each can be subdivided into two subcategories using the third-type buy/sell points. For the second scenario: 1. No third-type sell point of that hub has appeared before the current moment. 2. A third-type sell point of that hub has already appeared before the current moment (including cases where it's currently forming — by the strictest definition, this most precise sell point is completed instantaneously, and the operationally meaningful third-type sell point is actually a sufficiently small interval containing that most precise sell point). For the third scenario, similarly: 1. No third-type buy point of that hub has appeared before the current moment. 2. A third-type buy point of that hub has already appeared before the current moment.
For the first major category, since you're inside the hub and any evolution here would be correct, not operating is the best operation — wait for it to evolve into category two or three. Of course, if your technical skill is better and you can identify second-type buy points at the sub-level, many of which appear within the hub, then you can certainly participate. But if you lack this skill, wait until you do. Only seize opportunities that your current technical level can handle — this is what matters most.
For the second scenario, sub-type 1: since the hub oscillation continues, first find a certain segment from the hub's previous oscillation, and use a method similar to comparing divergence strength with MACD assistance, to identify the current segment of downward departure from the hub as the divergence segment in divergence analysis. Then, based on the sub-level trend of that segment, progressively use the nested interval method to determine as precise a buy point as possible. Note: the segment used for comparison — in the most standard case — is naturally the most recent downward one. Generally, hub oscillations gradually converge, so if the hub oscillation continues, the strength of each subsequent downward departure from the hub must be less than the previous one. Of course, there are some special hub oscillations where expansion occurs, meaning the strength is even greater than the previous one, but this doesn't necessarily mean the hub oscillation will be destroyed to form a third-type sell point. This issue is quite complex and will be discussed in detail later when we talk about the various graphical patterns of hubs. Generally speaking, this kind of situation can be completely resolved using various methods of pattern decomposition and consolidation divergence.
For the second scenario, sub-type 2: since that hub has already ended, analyze the completion of the sub-level trend type containing that third-type sell point, and determine the buy point using the divergence method. Of course, there's an even more straightforward approach: don't participate in this kind of movement at all, because afterward it can only either form a new downward hub or evolve into a larger-level hub. You can completely wait for these to complete, then decide on the entry timing based on the movement at that time. This way, you might miss some large rebounds, but there's no need to participate in declines at or above the operation level, or consolidations exceeding the operation level. This habit must be cultivated.
For the third scenario, sub-type 1: there's no suitable buy point at this time — wait. For the third scenario, sub-type 2: if the formation and position of that buy point aren't far away, you can enter, but it's best to enter right when it forms. Once a sub-level trend completion and consolidation top divergence have occurred from that buy point, you must wait afterward, because what follows will be a larger-level consolidation. Following the habit above, you don't need to participate — wait until that consolidation ends. Of course, if there's nothing worth entering across the entire market and you still want to operate, you can operate based on the hub oscillations of these larger-level hubs, which can also yield safe returns.
The above has completely classified and correspondingly analyzed all possible operation scenarios for a fixed operation level. Obviously, for a hub, the most valuable buy points are its third-type buy point and the buy point where the downward oscillation strength from the hub shows divergence. For the former, the worst case is the formation of a larger-level hub, and you can use whether subsequent movement shows consolidation divergence to decide whether to sell. Once this doesn't occur, it means an upward movement process to form a new hub — such a process is of course the most profitable. As for the latter, it's the process of capturing price differentials around hub oscillations — this is for reducing cost and increasing share holdings.
Note — you absolutely must note: many people don't know how to capture price differentials; it seems like all opportunities can be used for this. But from the strictest mechanical operation standpoint, only price differentials around the operation-level hub oscillations are the safest, because they can definitely be captured and you absolutely won't lose your position. The same principle applies in operations to gain shares after cost reaches zero. That is, after determining the buy/sell level, you cannot capture price differentials during upward moves after hub completion. When the hub is moving upward, you should be fully positioned — this is the only correct position. When oscillating around the hub, reduce positions above the hub and increase positions below the hub. Note: the premise is that the hub oscillation continues. Once a third-type sell point appears, you cannot buy back. Using the hub oscillation strength assessment method, you can completely avoid oscillations that might subsequently produce a third-type sell point.
Then, if the upward move completing this hub shows divergence, you must sell all shares, because this level's trend type is complete — you need to wait for the next buy point. If there's no divergence, it means a new hub will form. Note: small-level-to-large-level transitions are actually not complicated — they can also be viewed as a new hub, just one that might overlap with the previous one, which is impossible in a trend. This hub can continue using the hub oscillation method for short-term differentials, then continue with the hub's upward completion move, until the move shows divergence.
Actually, it can be proven rigorously:
Chán Zhōng Shuō Chán First Maximum Profit Theorem: For any fixed trading instrument, under a determined operation level, the above Chán Zhōng Shuō Chán operation mode has the maximum profit rate.
The key to this mode is to only participate in consolidation and uptrends at the determined operation level. For consolidation, use the hub oscillation method to ensure cost reduction and no loss of shares (after cost reaches zero, shares increase — of course, for small-level operations, the cost won't reach zero). After the hub's third-type buy point, hold shares until a new hub appears, then continue hub oscillation operations without participating in short-term differentials in between. Finally, after the upward move completing the hub shows divergence, sell all shares, completing one buy-sell operation at that level, and wait for the next buy point to appear.
Here you must note: the segments resembling consolidation divergence that appear during hub oscillation are different from the divergence segments in the upward move completing the hub. The two are respectively before and after the third-type buy point. Before the third-type buy point appears, the hub hasn't been broken, so there's naturally so-called hub oscillation. Afterward, the hub is already complete, so there's no such thing as hub oscillation. This issue must be clear — there's a strict distinction that cannot be confused.
Also, during hub oscillation, in essence you should operate with full positions — sell all shares above the hub and buy back the same amount below the hub. Of course, this requires high technical precision. If you misjudge the hub oscillation, you might sell incorrectly. So those who aren't proficient can operate with less than full positions. But this carries a risk: after hub oscillation, a third-type buy point doesn't necessarily have to appear; it can directly produce a third-type sell point and decline — this is perfectly permissible both theoretically and practically. In that case, if you didn't completely exit above the hub, some shares would need to be sold at the third-type sell point, thereby affecting overall profit. If you strictly follow the above Chán Zhōng Shuō Chán operation mode, this problem doesn't exist. As for whether you can meet the requirements of this Chán Zhōng Shuō Chán operation mode — that's a matter of technical precision, something that needs to be honed in practice.
Of course, there's a viable training method: even if you sell incorrectly, strictly follow the method. After all, even if your technical judgment ability is zero, the probability of selling incorrectly is only 50%, and there's still a third-type buy point afterward allowing you to buy back in. If you sell correctly, each price differential could be 10% or more. Don't underestimate the power of hub oscillations — when done well, hub oscillations generate money faster and more safely than so-called dark horses, with much higher operable frequency and actually greater profits produced.
The above method is for fixed operation instruments, meaning without switching stocks. There's also a more aggressive operation method: constantly switching stocks — not participating in hub oscillation, only buying at the third-type buy point, and exiting once a new hub forms. For example, if the operation level is 30-minute, when the hub completes an upward move and a 5-minute downward segment appears, and the next 5-minute upward segment can't make a new high or shows divergence or consolidation divergence, you must sell. Why? Because a new 30-minute hub must follow. Using this method, you'll often sell at the highest price range of that level's upward movement. Of course, whether you can actually achieve this is a matter of technical precision — it requires doing it many times before doing it well.
Actually, it can likewise be proven rigorously:
Chán Zhōng Shuō Chán Second Maximum Profit Theorem: For trading across different instruments, under a determined operation level, the above aggressive Chán Zhōng Shuō Chán operation mode has the maximum profit rate.
Note: the second theorem isn't necessarily more impressive or meaningful than the first. The profit rate mentioned here refers to average profit per operation / average time capital is tied up. But what truly generates total profit also relates to operation frequency. The second is more aggressive but also requires aggressive market opportunities. If the market has no third-type buy points at the operable level, you can only wait. The first doesn't require such strong market conditions — basically, except for the most severe continuous one-sided declines without even a decent-sized hub, it's always operable. So in actual operations, neither should be neglected.
Obviously, for large capital, the above methods require special treatment. The larger the capital, the lower the profit rate, because many levels of operation can't be participated in with full positions, which affects overall capital utilization. Generally speaking, small capital can grow extremely rapidly. Using this ID's method, whether in bull or bear markets, even the dimmest person, completely randomly picking stocks, completely unable to find so-called dark horses, can maintain over 200% annual profit without any problem. If your technical precision is high, even in a bear market, achieving 500% annual growth isn't difficult, because bear markets actually have more hub oscillation opportunities, and big rebounds — essentially big-level hub oscillation opportunities — are plentiful. Handle them well, and it's no slower than making money in a bull market. But this kind of growth can only be sustained for a few years. Once capital grows to a certain level, you'll encounter a capital growth bottleneck. How to break through that bottleneck is another issue to be discussed later.
Appendix:
The market today was another typical balanced day — the high and low both appeared in the first three 30-minute candlesticks. Handling this kind of movement is very simple, so we won't elaborate. Tomorrow, as long as it can hold above 3745, it will continue to develop upward. With this kind of movement that doesn't even break the 5-day moving average, there really isn't much to say.
Honestly, this ID wants to go on vacation right now. That exchange is ridiculous — next Monday they still open for just one standalone day, which will leave a tiny-volume bar on the weekly chart that looks terrible. They might as well end tomorrow and reopen on the 7th. But since they're still open, this ID can't leave either, lest someone cause trouble. Probably many people have the same thought — utterly boring.
Today you have time to study the article above. If you truly master it, you'll have achieved a preliminary result. This ID needs to head to Zhongguancun shortly to discuss a VC matter — scheduled for 4 PM, can't skip it. Will return tonight to answer questions.
See you at 9.
Replies
缠中说禅 2007/4/26 15:21:18
The market today was another typical balanced day — the high and low both appeared in the first three 30-minute candlesticks. Handling this kind of movement is very simple, so we won't elaborate. Tomorrow, as long as it can hold above 3745, it will continue to develop upward. With this kind of movement that doesn't even break the 5-day moving average, there really isn't much to say.
Honestly, this ID wants to go on vacation right now. That exchange is ridiculous — next Monday they still open for just one standalone day, which will leave a tiny-volume bar on the weekly chart that looks terrible. They might as well end tomorrow and reopen on the 7th. But since they're still open, this ID can't leave either, lest someone cause trouble. Probably many people have the same thought — utterly boring.
Today you have time to study the article above. If you truly master it, you'll have achieved a preliminary result. This ID needs to head to Zhongguancun shortly to discuss a VC matter — scheduled for 4 PM, can't skip it. Will return tonight to answer questions.
See you at 9.
缠中说禅 2007/4/26 21:21:16
[Anonymous] 新年好
2007-04-26 21:17:04
明天只要能站稳3745,就继续向上发展
----------
May I ask, Sister Chan, where does this 3745 come from? It looks like it might be the price one minute before yesterday's close. Is that right?
=
The upper edge of the hub.
缠中说禅 2007/4/26 21:22:03
[Anonymous] 傻子
2007-04-26 21:17:56
Teacher hasn't arrived yet — did today's meeting not go well?
==
Sorry, got back late.
缠中说禅 2007/4/26 21:24:36
[Anonymous] touchnet
2007-04-26 21:14:33
The text on Sina is too small — you need to protect your eyesight!
=
There should be a zoom ratio in the bottom right — viewing at 150% should work.
缠中说禅 2007/4/26 21:30:30
[Anonymous] Sina User
2007-04-26 21:05:50
Boss, Liverpool's prospects aren't looking good. When will you also buy a football team like Abramovich and sweep the football world unchallenged????
=
This ID has friends whose team is currently in the Chinese Super League — they've been holding on by a thread. It's absolute torture.
缠中说禅 2007/4/26 21:40:35
[Anonymous] 飞
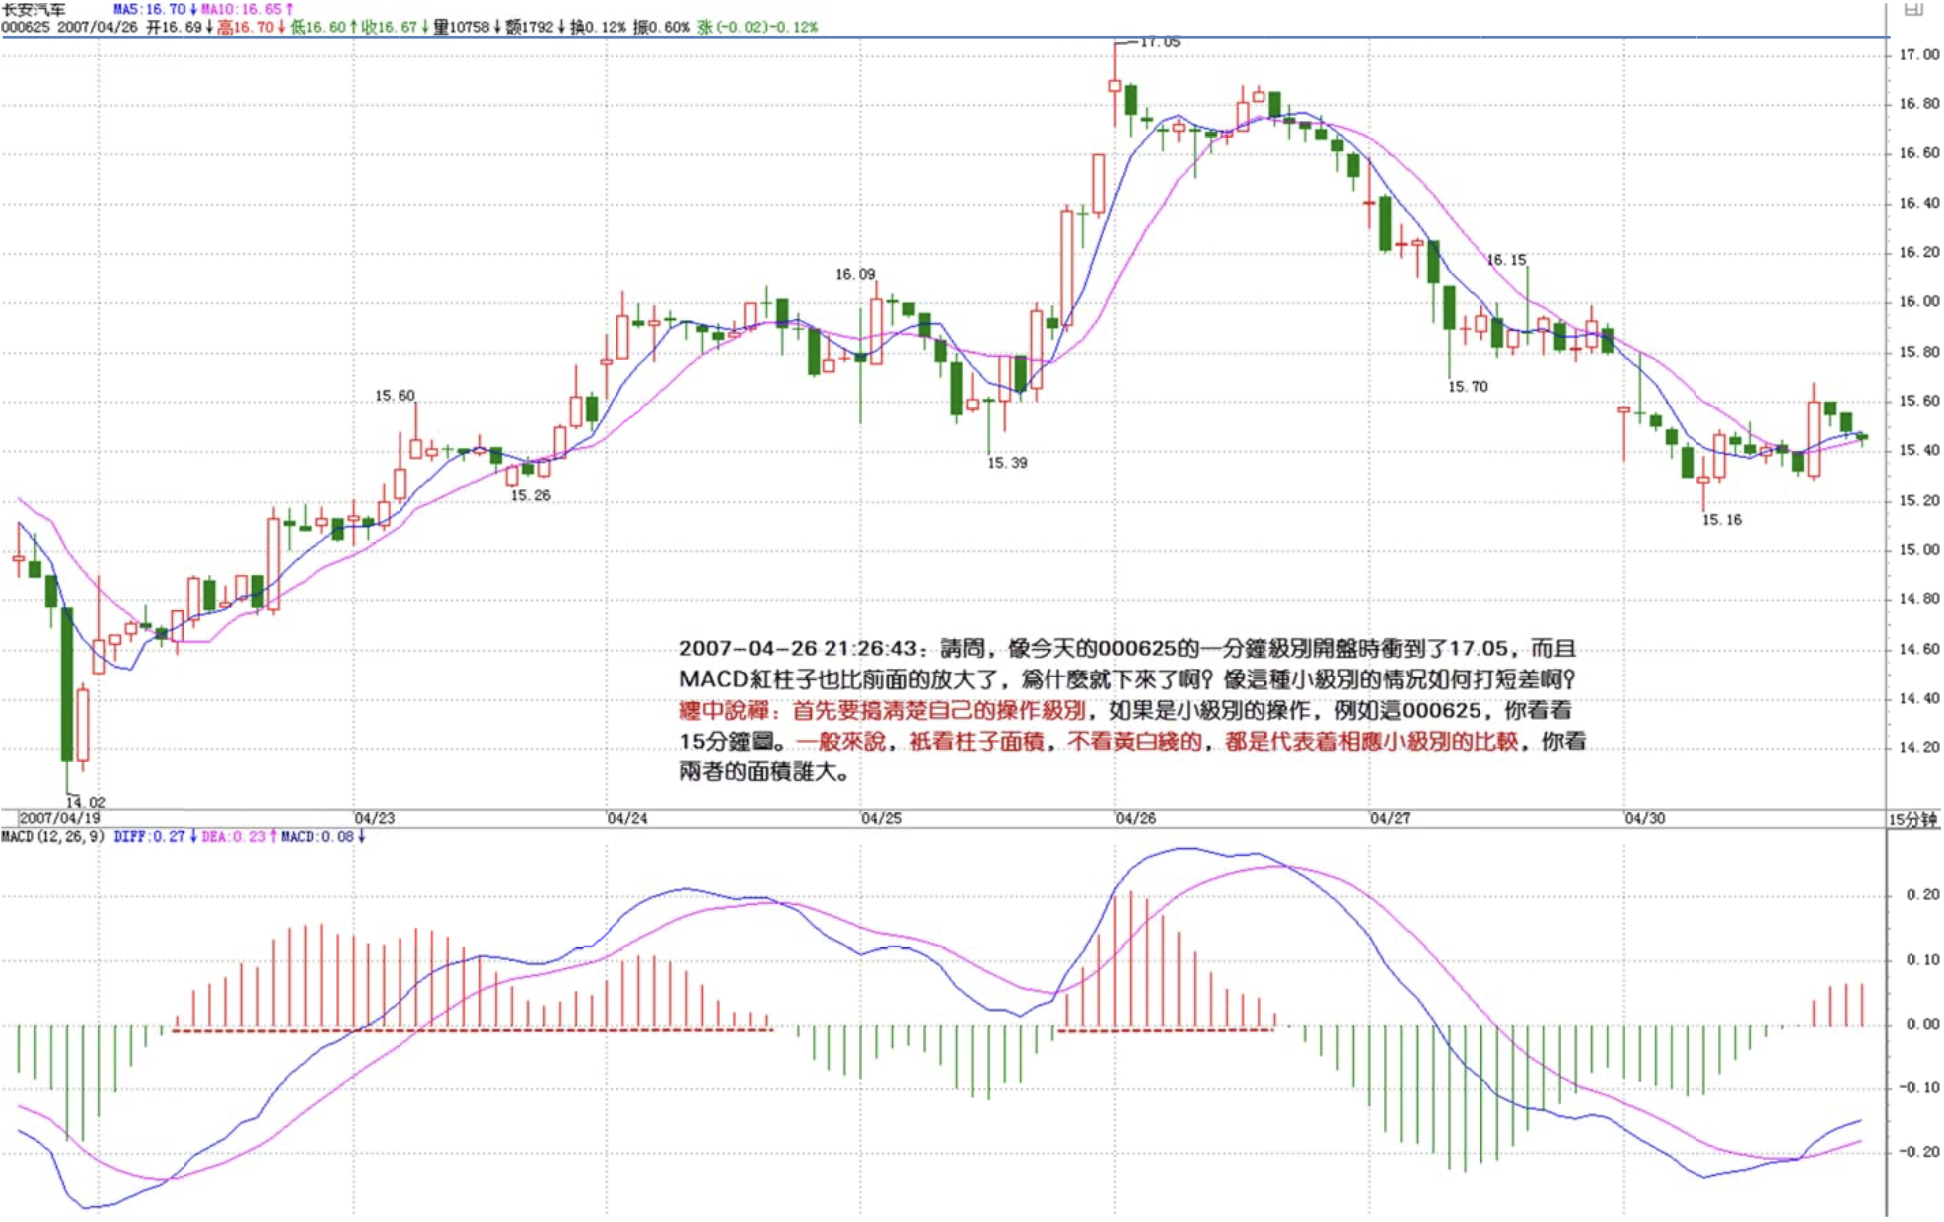
2007-04-26 21:26:43
Thank you, blogger! Today's lesson was great! It's fairly close to actual operations and easier to understand. May I ask the blogger: like today's 000625 at the 1-minute level, the opening surge reached 17.05, and the red bars were also larger than before — why did it come back down? How do you play short-term differentials in this kind of small-level situation? I hope the blogger can answer. This situation seems very common!
==
First you need to clarify your own operation level. If it's small-level operations, for example with this stock, look at the 15-minute chart. Generally speaking, you only look at bar area, not distinguishing between yellow and white bars — they all represent comparisons at corresponding small levels. See which has the larger area.
缠中说禅 2007/4/26 21:41:47
[Anonymous] 新年好
2007-04-26 21:31:35
Sister Chan, could you explain today's hub to me? I looked carefully but still can't see it. It seems like today was oscillating within a large hub, but how do you determine the upper and lower edges?
=
It's not today's hub — it's the hub starting from 04240935.
缠中说禅 2007/4/26 21:44:24
[Anonymous] 笨笨
2007-04-26 21:34:22
Sister, please take care of your health. What are your plans for May Day?
==
Not planning anything is the best plan — 24 hours, any moment, doing whatever I want.
缠中说禅 2007/4/26 21:46:48
[Anonymous] Hindsight
2007-04-26 21:32:23
Greetings, Master Chan. You're finally here.
Today's question — I hope it won't trouble you. I'd like you to analyze 600198, preferably aspects beyond the chart. This isn't one of the 14, so I hope you'll speak freely and not hold back!
Thanks!
==
Isn't this exactly the kind of stock this ID has described as deliberately playing tricks? No need to chase the high. With this kind of stock, buy when bad news is announced, and let go once it rallies.
缠中说禅 2007/4/26 21:48:33
[Anonymous] 笨笨
2007-04-26 21:45:33
Sister, if the oscillation ranges of two sub-level hubs overlap, they expand into a hub of this level. So once this expanded hub is formed from these two overlapping sub-level hubs, is it completed or not?
Please answer, sister.
==
How could there be only two sub-level segments? The connection between the two sub-level segments includes a third-type buy point, so there's definitely another sub-level segment — doesn't that already give three sub-level segments?
缠中说禅 2007/4/26 21:54:29
[Anonymous] 漂泊
2007-04-26 21:47:28
Good evening, Master Chan. How do you see 600601? It always feels like it wants to break upward but never does. Very puzzling. Please advise, thank you.
==
This way of thinking is wrong. Don't be troubled by the market's choices — instead, react promptly to the market's choices. Stocks require patience. Today's article was written very clearly. If your technique is adequate, you can use the aggressive second method, which doesn't require waiting through consolidation. Otherwise, you must endure the consolidation. If your technique is slightly better, you can use the consolidation to reduce costs. First change your way of thinking — there's nothing to criticize about market movements.
缠中说禅 2007/4/26 21:58:57
[Anonymous] 飞
2007-04-26 21:44:59
Got it, thank you blogger! Will you write another stock trading lesson tomorrow so we can study well over May Day instead of joining the tourist crowds? Hehe, seems a bit greedy...
==
Actually, truly mastering today's lesson alone is not something you can figure out in one or two days. You need to really digest it — otherwise, with doubts in your heart, your operations will inevitably be filled with hesitation.
缠中说禅 2007/4/26 22:04:21
[Anonymous] 萝卜白菜
2007-04-26 21:30:39
Please help take a look at:
600201 Jinyu Group — the turnover rate at the high, both today and yesterday, exceeded 14%. What's going on? Is it starting to distribute? I can't read it. I'm a bit scared. Please, Master Chan, shed some light. Thank you!!!!!!!!
=
These concepts are meaningless. Every day someone is selling and someone is buying — otherwise where would the trading volume come from? The key is to look at the movement itself, along with your own operation level. If your operation level is 1-minute, there's almost always a time to sell every day. If your operation level is the daily chart, is there divergence now?
缠中说禅 2007/4/26 22:11:53
[Anonymous] Stock Louse
2007-04-26 22:03:39
In an upward cycle, after forming two hubs and continuing to rise, if no divergence appears and a new hub forms, then it continues rising, should the conditions for judging divergence at this point also be:
- The last hub pulls the MACD yellow/white lines toward the zero axis;
- The strength of the last rising segment is less than the previous one.
Taking a+A+b+B+c+C+d as an example, the last hub C pulls the yellow/white lines back to the zero axis, and if d's strength is less than c's, then it's divergent.
Stock Louse
==
The order is exactly reversed. You first need to select which two segments to compare, and then reference the MACD to compare strength. As for choosing whether to use the 30-minute or 5-minute MACD, the principle is the same — just different levels of convenience. MACD is an auxiliary tool for judging strength, not a standalone "condition 2" for judging strength.
缠中说禅 2007/4/26 22:14:39
[Anonymous] christine
2007-04-26 22:09:47
Sister Chan, may I ask:
Under the premise of a large-level bull market on the yearly scale, can we be more aggressive in reducing costs and accumulating shares?
For example, if we're bullish on certain stocks now, can we start accumulating shares whenever there's an opportunity — accumulate a whole lot — and then when the stock price doubles to a certain degree, sell off 50% (or 80%, etc.)? Wouldn't the profit be faster this way? Also, accumulating shares at the bottom means lower cost? After all, I'm a small retail investor — the money I put into the stock market won't be in the tens of millions, let alone hundreds of millions. I won't accumulate so many shares that I become a major shareholder.
==
Start by reducing costs. Once costs are low, your mentality for holding naturally improves. Operations cannot be based on assumptions — you must be able to handle any situation with ease.
缠中说禅 2007/4/26 22:16:25
[Anonymous] 走失的爱犬
2007-04-26 22:09:32
Sister Chan, you're in great spirits.
I've watched two days of football. During the day I still have to watch stocks. Hehe, my head's about to explode :)
==
No problem. The key is to be asleep before midnight (the zi hour). This way, even if you get up at 2:45, the impact isn't too great.
缠中说禅 2007/4/26 22:17:52
[Anonymous] 同龄人
2007-04-26 21:59:36
I read your articles every day, just like watching the Premier League!
==
Next year watching the Premier League will cost money, but this ID's place is forever free. How can it be "just like"?
缠中说禅 2007/4/26 22:27:37
[Anonymous] yaa
2007-04-26 22:22:09
Posting again.
[[[[[[[
Sister Chan, hello. I have a question.
What do you think of those so-called Level 2 market data software programs?
Supposedly they let you see detailed tick-by-tick data.
Could Chán Zhōng Shuō Chán's theory be even more effective with them?
==
Actually, you don't need precision down to individual ticks at all. Tick-level divergence can be compared using 1-minute bar areas. Even if you can't see 1-minute data, you can use 5-minute bar area comparison to detect 1-minute divergence. In actual operations, the key is to understand the relationships between levels, not to obsess over overly fine details.
If you want to look at fine details, you can study the order flow language. Observant people can observe how order flow language changes at tops and bottoms of various levels — that's more meaningful.
缠中说禅 2007/4/26 22:30:17
Leap Seconds Like Clouds
2007-04-26 22:15:18
Hello, blogger.
Interesting question: can Chán Zhōng Shuō Chán theory be applied to lotteries? If so, how should one operate with 51 million in capital? And what about with small capital?
=
No, it cannot. It doesn't satisfy the two prerequisites for this ID's theory.
缠中说禅 2007/4/26 22:31:15
It's almost midnight (the zi hour). This ID must rest. Too many questions — please forgive those left unanswered.
Heading out first, see you later.
缠中说禅 2007/4/26 8:19:44
Will append today's market analysis after the close.
Heading out first, see you later.