Teaching You to Trade Stocks 56: Chart Analysis of the 530 Stamp Tax Day
2007/5/30 22:49:10
Originally I didn't want to talk about stocks, but knowing that if I discussed other topics now, most people would be slow to respond, their minds muddled by stocks — so I might as well go with the flow and continue with stocks for a bit, discussing how to analyze the 530 stamp tax day's intraday movement in real-time.
This problem is actually quite simple, and this ID posted a reminder before 7 AM urging everyone to reduce positions at the second or third-type sell points. I'm pleased to see that many people were able to identify that second-type sell point at 9:48. Note, the reason for simultaneously emphasizing the third-type sell point is that some particularly weak stocks might only present a third-type sell point. The broader market's movement is an average movement, and it was actually stronger than many individual stocks that day, so the market showing a second-type sell point doesn't mean individual stocks are also at second-type sell points.
Many people probably still don't understand why this ID's theory requires three types of sell points. In fact, the second-type sell point, aside from being superior to the first-type sell point in small-level-to-large-level transitions, is the optimal sell point in certain special sudden situations. This occasion is a perfect example. Because on May 29th, although the 30-minute chart clearly entered a divergence segment, since the closing that day was high, the interval nesting theorem couldn't confirm divergence at that time — after all, there was still the next day's movement to consider. The sudden overnight news immediately confirmed this divergence. At that point, the first-type sell point was no longer practically achievable in actual operations, so the only operable sell points were the second or third type. This could be determined before the market opened — meaning, once a large gap-down occurred, the realistic sell points fully guaranteed by theory were the second-type or third-type sell points.
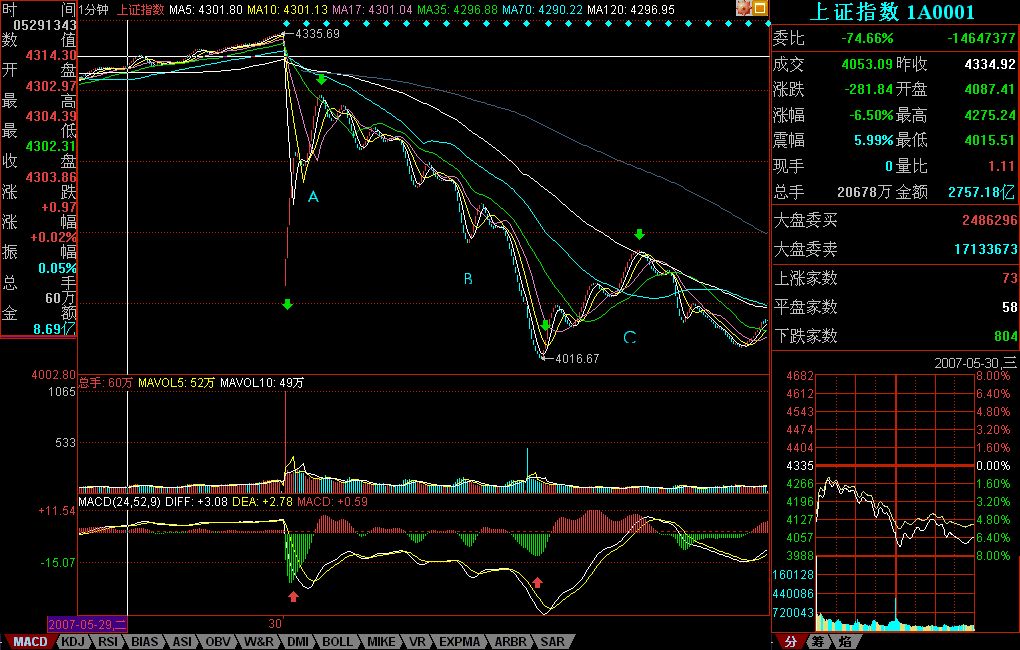
The chart above shows yesterday's 1-minute chart of the movement. Gaps are treated as the lowest level, and sub-1-minute levels appear on the 1-minute chart as line segments with no internal structure, so gaps and sub-1-minute levels are of the same level on the 1-minute chart. The green arrows in the chart point to the boundary points between two sub-1-minute level segments; between adjacent green arrows is a sub-1-minute level trend type. Segment B appears to form three 1-minute hubs, but since the third leg of each actually slopes downward, they are essentially part of the second downward leg and cannot be counted as forming a hub. Yesterday's movement was really just this simple — a combination of five sub-1-minute trend types.
Clearly, the first sub-1-minute level trend type was formed by the downward gap. According to the definition of the second-type sell point, once a sub-1-minute upward process fails to make a new high or shows divergence, it constitutes a second-type sell point. Therefore, when segment A appeared on the chart, a movement forming a second-type sell point was taking shape in real-time.
Someone might ask, how do you know segment A will definitely form a second-type sell point rather than directly breaking to new highs in a strong rally? This is simple — the specific method is the same as the interval nesting theorem: examine A's internal structure. Once internal divergence appears at a position that hasn't made a new high or shows consolidation top divergence relative to the preceding movement, then it's definitely a second-type sell point. In yesterday's specific movement, when segment A showed an up-down-up internal structure, the second upward move clearly showed divergent movement. This can be assessed using volume, or by comparing the absolute values of the MACD green bars (pointed to by the first red arrow) with the subsequent red bars. Therefore, this second-type sell point could be clearly and completely confirmed using theory, with no ambiguity whatsoever. If you couldn't understand this in real-time, then you need to study harder, because this problem really is too simple.
After the second-type sell point, segment B starting from the second green arrow needs its strength compared against the gap segment. Comparing the green bar areas pointed to by the two red arrows on MACD — note, for the second one you need to add the three small green bars preceding it — you can see that even so, the latter's strength doesn't exceed the former's. From this you know that segment B constitutes consolidation divergence, meaning the subsequent rebound must return above the first green arrow's position. (Note: this is a sub-1-minute level strength comparison, requiring only bar area comparison. If it were a 1-minute level comparison, you'd also need to consider the DIFF/DEA lines' pullback toward the zero axis.) And the subsequent C segment's movement confirmed this point. Additionally, C segment's high point can be determined using the divergence method by comparing the heights of MACD bars below C segment. Thus, segments A, B, and C overlap, forming a 1-minute hub with a range of 4087 to 4122 points. This becomes the most critical reference point for all subsequent movement including tomorrow — whether it's hub oscillation, or the formation of a third-type buy/sell point leading to a larger hub or trend, everything is based on this. And this is strictly guaranteed in real-time by the theory, with absolutely no room for ambiguity.
Some finer details could still be discussed. For example, C segment's high point didn't return to the starting position of the last rebound within segment B. This doesn't violate the theory, because within segment B, the final downward leg didn't show divergence — its reversal was entirely caused by a small-level-to-large-level transition (due to the extremely small level, this can be inferred from the shortening of the bars). This naturally means it doesn't have to return to the last rebound's starting position. Within segment B, from the progressively increasing green bar areas, you know that the preceding downward legs won't form divergence to end segment B, so you can wait in real-time for the final break below segment A's low, forming B segment's consolidation divergence with the gap segment. This example demonstrates that the internal structure of a large consolidation divergence segment can entirely lack a same-level divergence — it can be entirely a small-level-to-large-level transition. Yesterday's chart provides just such a textbook example.
In actual operations, whether to participate in the buy point created by segment B's consolidation divergence after the second-type sell point depends on your operational level. For stock index futures, this corresponds to a 100-point range and is certainly worth participating in. But since T+0 isn't available, and transaction costs have now increased, whether to participate for stocks depends on the specific stock you're operating — this must be handled flexibly based on your own situation. But as long as you understand the small-level situation, large-level operations are identical — just with higher safety, better operability, and lower frequency. This ID discusses these examples here only to help everyone better understand the theory.
Appendix:
Understanding the article above, if you still couldn't grasp today's movement, then you need to put in overtime studying. Yesterday's 4087-4122 hub — this morning's early surge didn't touch 4087 points, so it constituted a third-type sell point for that hub. The subsequent three waves of decline, compared with yesterday's B segment, showed clear divergence. Internally, the last wave showed clearly shortened green bars on the 1-minute chart, so internal divergence was also present. Using the interval nesting method, one could precisely locate the 10:02 AM low in real-time. This is the simplest technique in this ID's theory — if you couldn't perform this analysis today, please study and review thoroughly.
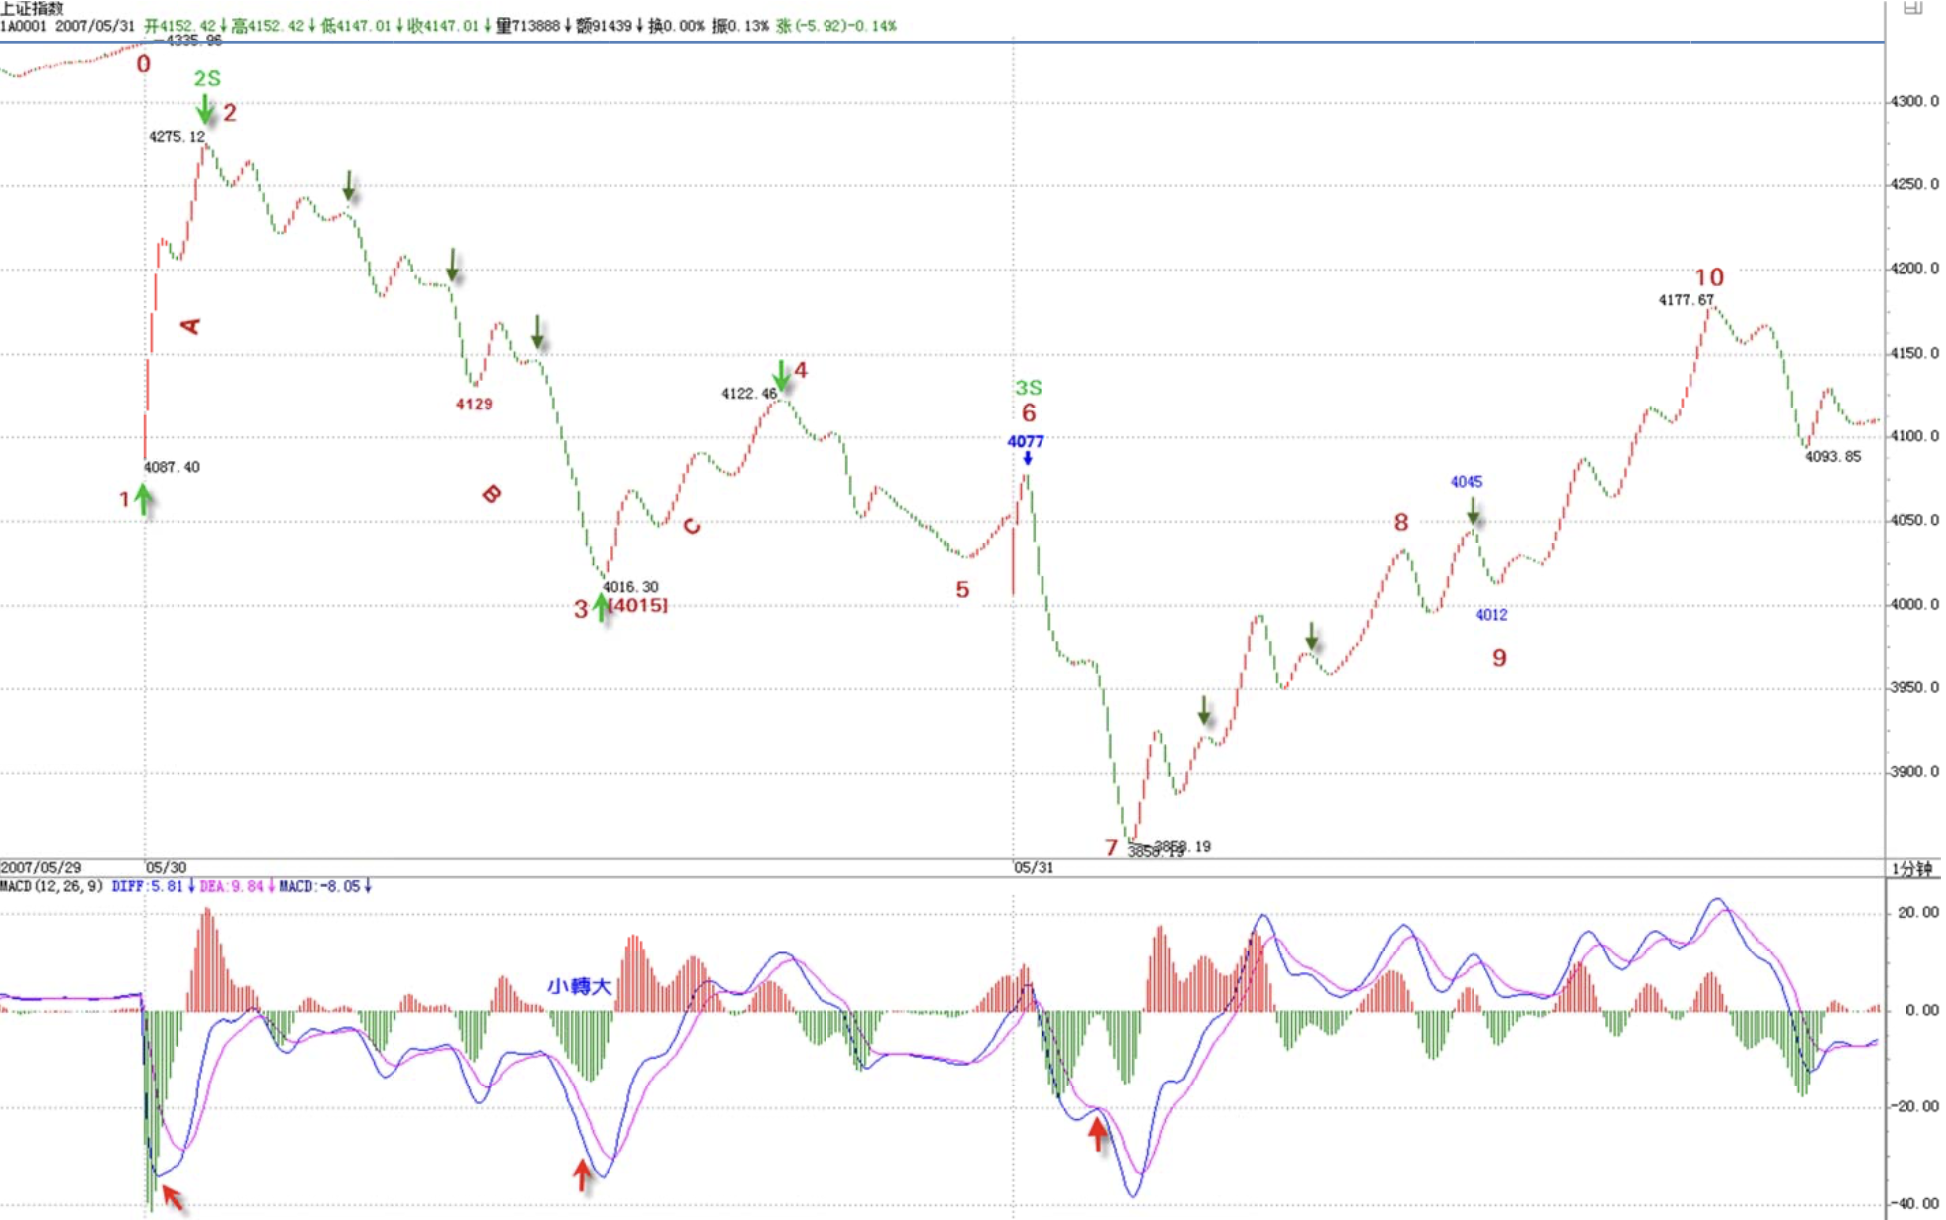
The subsequent rebound, as this ID pointed out — when a third-type sell point doesn't lead to a trend, it forms a larger hub. So now the original 1-minute hub has expanded into a 5-minute hub. The range is 4015 to 4122 points, and subsequent movement will be oscillation within this hub until a third-type buy or sell point appears. It's that simple, not a bit of difficulty.
On the bigger picture, the 1/2 line that this ID has repeatedly emphasized remains the most important level, serving as the standard for the market's strength or weakness. Currently, this line happens to be right at the middle position of this major oscillation, which tells you how significant this line is. In the early May articles, it was already clearly stated that this line would govern the market for at least 3 months — this view remains unchanged.
Today's monthly closing is already good enough — at least the upper shadow isn't too long, much better than the worst-case inverted T. So next month, there's at least considerable room for chart maneuvering. Note that the recent market action will again be led by quality first and second-tier component stocks. Third-tier stocks will have to wait until the broader market basically stabilizes before slowly regaining momentum. But tomorrow and Monday, those that rebounded weakly today will gradually perform — this follows the principle of rotation.
Tomorrow is Friday, and the news front has again become the biggest psychological pressure. The overall market oscillation won't stabilize until next week. Of course, this kind of large-amplitude oscillation is paradise for this ID's theory — here you can extract even greater profits than during one-sided markets. Note, don't assume this ID's theory only works for oscillations — it oscillates when it should oscillate and goes one-sided when it should go one-sided. If you don't even understand this, you've studied in vain.
Replies
缠中说禅 2007/5/30 22:54:41
A note for those who can't see the images — please go to this ID's photo album, it's the 4th image.
缠中说禅 2007/5/31 15:43:16
Understanding the article above, if you still couldn't grasp today's movement, then you need to put in overtime studying. Yesterday's 4087-4122 hub — this morning's early surge didn't touch 4087 points, so it constituted a third-type sell point for that hub. The subsequent three waves of decline, compared with yesterday's B segment, showed clear divergence. Internally, the last wave showed clearly shortened green bars on the 1-minute chart, so internal divergence was also present. Using the interval nesting method, one could precisely locate the 10:02 AM low in real-time. This is the simplest technique in this ID's theory — if you couldn't perform this analysis today, please study and review thoroughly.
The subsequent rebound, as this ID pointed out — when a third-type sell point doesn't lead to a trend, it forms a larger hub. So now the original 1-minute hub has expanded into a 5-minute hub. The range is 4015 to 4122 points, and subsequent movement will be oscillation within this hub until a third-type buy or sell point appears. It's that simple, not a bit of difficulty.
On the bigger picture, the 1/2 line that this ID has repeatedly emphasized remains the most important level, serving as the standard for the market's strength or weakness. Currently, this line happens to be right at the middle position of this major oscillation, which tells you how significant this line is. In the early May articles, it was already clearly stated that this line would govern the market for at least 3 months — this view remains unchanged.
Today's monthly closing is already good enough — at least the upper shadow isn't too long, much better than the worst-case inverted T. So next month, there's at least considerable room for chart maneuvering. Note that the recent market action will again be led by quality first and second-tier component stocks. Third-tier stocks will have to wait until the broader market basically stabilizes before slowly regaining momentum. But tomorrow and Monday, those that rebounded weakly today will gradually perform — this follows the principle of rotation.
Tomorrow is Friday, and the news front has again become the biggest psychological pressure. The overall market oscillation won't stabilize until next week. Of course, this kind of large-amplitude oscillation is paradise for this ID's theory — here you can extract even greater profits than during one-sided markets. Note, don't assume this ID's theory only works for oscillations — it oscillates when it should oscillate and goes one-sided when it should go one-sided. If you don't even understand this, you've studied in vain.
缠中说禅 2007/5/31 15:58:38
[Anonymous] 美女
2007-05-31 15:56:46
Yesterday's 4087-4122 hub — this morning's early surge didn't touch 4087 points, so it constituted a third-type sell point for that hub. The subsequent three waves of decline, compared with yesterday's B segment, showed clear divergence. Internally, the last wave showed clearly shortened green bars on the 1-minute chart, so internal divergence was also present. Using the interval nesting method, one could precisely locate the 10:02 AM low in real-time. This is the simplest technique in this ID's theory — if you couldn't perform this analysis today, please study and review thoroughly.
==============
"The subsequent three waves of decline, compared with yesterday's B segment, showed clear divergence" — how do you see that? When I analyze the 1F chart, the MACD green bar areas didn't decrease. Are there any other techniques for judging divergence?
==
You need to add up all the areas for comparison — this is the most basic knowledge. Please review the corresponding lessons.
缠中说禅 2007/5/31 16:00:35
[Anonymous] 竹子
2007-05-31 15:56:56
Chan MM,
Hello! May I ask, will S and ST stocks have any performance going forward? I'm heavily positioned — originally planned at least mid-term holding. But these past two days with daily limit-downs, profits have shrunk dramatically in a flash. I don't know what to do. Thanks!
==
These stocks dropping two daily limits is only like one drop for others. Most have already pulled back over 20%, so if they've only dropped 10%, naturally there's no rebound momentum — this is common sense. When there's enough rebound room, they'll naturally bounce.
缠中说禅 2007/5/31 16:03:22
[Anonymous] Sina User
2007-05-31 15:49:44
You've worked hard, blogger! No forces threatening you, right? Take care of yourself
==
Thank you, but it's not that serious. This ID isn't made of tofu.
缠中说禅 2007/5/31 16:14:00
[Anonymous] asd
2007-05-31 15:46:49
Requesting Master Chan's explanation:
- Even gaps are sub-1-minute level trend types, so why aren't the three up-down-up segments inside segment A also sub-1-minute level trend types, while segment A itself must be classified as sub-1-minute? In "An Analysis of a Specific Trend," every up or down segment with obvious highs and lows (except d7g7, which is at the 1-minute level) are all sub-1-minute level!
- "C segment's high point can be judged using the divergence method by comparing the MACD bar heights below segment C." How exactly does one judge this?
==
How to judge it? Just look at the chart — one tall, one short. What's there to explain? Sub-1-minute level means all levels below are treated as line segments with no internal structure. Of course, by a different standard, there could be countless levels below. As for each chart, it's like using different magnification microscopes — the key is that the standard within each chart is unified. The baseline for this standard is: first determine a minimum level, then treat everything below as line segments. This has been discussed repeatedly in the lessons. For example, if you put two different charts together, the viewing standard might change — perhaps you'd use a 5-minute standard, and then what needs to be ignored changes. The principle is very simple.
If you still can't figure it out, use the analogy of naked eyes — like reading a book, our level only goes down to individual characters, but inside each character there are countless levels, all the way down below electrons. A sub-character level versus an electron — to the naked eye, they're both sub-character level, fundamentally indistinguishable, both invisible.
缠中说禅 2007/5/31 16:17:53
[Anonymous] hunter
2007-05-31 16:05:33
Boss, why isn't the hub 4027-4077?
==
First get the three segments of the hub straight. Here's a hint: yesterday's C segment is the first segment of this decomposition's new hub. Of course, you can define the hub's position according to another decomposition, but then the discussion must follow that decomposition, which would make this ID's explanation too long. Hasn't this ID already specifically demonstrated this? Please refer to the lessons.
缠中说禅 2007/5/31 16:22:13
[Anonymous] 果
2007-05-31 16:12:25
Miss Chan, is it necessary now to switch third-tier stocks and ST stocks for blue-chip stocks?
==
That's not how you operate. The correct approach was to clear your position at yesterday's third-type sell point, then pivot to first and second-tier stocks — that's called rhythm. Now those stocks have already risen, and if you dump third-tier to buy first-tier, you'll get slapped on both sides.
Trading, when you get down to it, is a rhythm problem. If the rhythm is off, better to stand still and get the rhythm back.
缠中说禅 2007/5/31 16:32:58
[Anonymous] 大盘
2007-05-31 16:21:36
[Anonymous] 大盘
2007-05-31 16:02:49
A question for the blogger:
From 1-minute to weekly charts, could you give us an introduction to the minimum time typically needed for consolidation and trending movements at each level? This should help us retail investors with chart-watching schedules and swing trading rhythm. Our own summaries never feel reliable enough since there are too few reference examples
==
Look at the minimum time needed for MACD to diverge from top to bottom — at any level, it needs at least several dozen candlesticks, right? This is something you can statistically measure. Actually, reading charts should be like watching a plant grow in real-time — too many rigid concepts aren't useful.
缠中说禅 2007/5/31 16:35:14
[Anonymous] 鸢鸢
2007-05-31 16:30:25
Chán Zhōng Shuō Chán
2007-05-31 16:22:13
[Anonymous] 果
2007-05-31 16:12:25
Miss Chan, is it necessary now to switch third-tier stocks and ST stocks for blue-chip stocks?
==
That's not how you operate. The correct approach was to clear your position at yesterday's third-type sell point, then pivot to first and second-tier stocks — that's called rhythm. Now those stocks have already risen — if you dump third-tier to buy first-tier, you'll get slapped on both sides.
Trading, when you get down to it, is a rhythm problem. If the rhythm is off, better to stand still and get the rhythm back.
===========
So Miss Chan's point is that since we missed the rhythm, we shouldn't chase highs to switch stocks, and instead should use our current holdings to make short-term trades to lower costs — is that right?
==
Sector rotation is the principle. The best rhythm is naturally jumping from one to the next, hitting every timing perfectly. But if you don't have that skill yet, master one first. When your skills improve, then attempt the harder stuff — that's the goal.
缠中说禅 2007/5/31 16:43:34
[Anonymous] Xiao Ming
2007-05-31 16:28:24
Boss, that Fushun steel stock is yours, isn't it?
How come it hasn't kept up with the broader market, let alone the steel sector's movement?
==
When did this ID ever mention that stock? The stock this ID mentioned is currently suspended — everyone here should know this very well.
Also, let me say this: regarding that certain pair of stocks, this ID came up specifically that morning to say don't buy the small-cap one because it would mess up the chart. That day happened to be the last trading day for the suspended one. Those who bought the suspended one that day — what problems could they have now? The small-cap one even made another new high afterward — such obvious divergence, if you bought it then, why didn't you sell?
The small-cap stock, of course it's fine mid-term, but if a crowd of people piled in, then there's a problem. If the copper mine goes in as planned, it'll soar. If there's chaotic buying, it'll just lie flat — wait until everyone gives up and then we'll see.
Note, that's a float of only 30-odd million shares — it can't accommodate many people. This is why this ID specifically came up that morning to warn against randomly buying the small-cap. Remember why 600777 looked like it wanted to die in January? Because there were 4 groups of people involved — this ID mentioned this at the time. Why was 416 so fierce? Because it was clean. It's that simple, nothing more to say.
缠中说禅 2007/5/31 16:45:31
Sorry, lots of gatherings these days — unify thinking, then there's fighting power. This ID needs to go to a gathering.
Signing off first, see you tomorrow morning.
缠中说禅 2007/5/30 22:53:01
Got back at 10 PM, rushed to write the post so everyone has more time to study the lesson. Posting it early so there's no need for a morning post.
Midnight, signing off. Market commentary will be appended to tomorrow's post after market close. Goodbye.