Teaching You to Trade Stocks 28: Next Target — Destroying the Funds
2007/2/6 15:04:50
Funds, whether public or private, are frankly just legalized pyramid schemes. This ID has never respected any fund, public or private. Theoretically, as long as this legalized pyramid extends indefinitely, the earliest participants will inevitably become phenomenally successful. Many people love citing Buffett and so-called value investing, but that's nothing more than a pyramid-selling tactic. Stocks are ultimately just pieces of waste paper, and their pyramid nature determines that the so-called value of stocks can work as a perfect trap: 1 yuan of profit in the company the stock represents can generate at least 10 yuan of appreciation on the stock. This is simply the amplification function of asset virtualization. Therefore, any shell company, theoretically, as long as it can legally issue a fund, then use part of the pyramid money to invest in the shell company's assets, can earn 10x or more appreciation on the stock. With money, what quality assets can't be purchased and injected? With money, what quality assets won't get priority selection? Then, the fund investing in this stock makes money, and a new round of pyramid selling begins. That's all there is to it.
Any theory that doesn't acknowledge the waste-paper nature of stocks is absurd. Holding any stock because it "has value" is nothing but a trick to fool people. The only reason to hold a stock long-term is that a long-term buy point has appeared and the long-term sell point hasn't arrived yet. From this perspective, the yearly chart is the longest-term chart there is, because any person can probably only experience 70-80 annual candlesticks. One yearly first-type buy point plus one yearly first-type sell point — and that's basically it. Master these two points and you'll outperform any value investor, because those people merely rode between the buy and sell points on at most a yearly chart.
Given the reality of China's stock market, a major correction in this bull market will inevitably bring about some degree of fund collapse. The last bull market destroyed quite a few securities companies; this bull market will destroy funds. The first rule of investing is: "The money in your hands must be able to stay in the stock market stably for the long term — there absolutely cannot be any borrowing situations." Yet funds have merely legally borrowed a lot of money. Even without interest, the nature is the same. Once the market turns significantly worse, funds inevitably face enormous risk — a single major redemption wave is enough to ensure many funds never recover. Pyramid schemes typically have only one outcome: going to zero. Funds, for the majority at least, will end the same way. This is the fund's biggest fatal flaw — one that seriously violates the primary investment principle: none of the money is theirs. For open-ended funds, this is even more severe because redemptions can happen at any time. And China's open-ended funds are even more terrifying — the behavioral convergence of Chinese people is extraordinarily frightening. The consequences of Chinese people rushing to do the same thing en masse — whether in politics, economics, or academia, without exception — you've probably seen plenty.
From this major fatal flaw of funds comes an inevitable minor flaw: fund managers must inevitably use net asset value as their standard, just as officials use GDP as their standard. Funds also have a laughable regulation that's like visiting prostitutes while demanding a chastity monument — there's a limit on what percentage of any single stock a fund can hold. In this regard, funds are even worse than market makers. Once overweight, the only option is to find other funds to help push the price, with several funds jointly holding shares — which is essentially joint market manipulation. If they're all overweight, or if all the funds are simultaneously too busy for this, it creates an excellent opportunity for ambush. From this ID's standpoint, funds are like stupid giants — they can't do short-term trades, can't support or dump prices at will, and the practical effect of their holdings is merely to shrink the stock's effective float. Even without using some non-market methods — some under-the-table games that definitely work like a charm in China — a well-designed ambush is enough to make these funds either quietly suffer losses, or in severe cases, force their liquidation. Note: this market is open. It's not that this ID is cold-blooded — it's that as long as a fatal flaw exists, someone will inevitably attack it. Would this fatal flaw not exist just because this ID doesn't attack?
Playing games with a stupid giant — if they can tough it out, at worst you've made an excellent short-term trade while their held shares effectively evaporated for a period. In investing, the only thing that truly matters is cost. Once your cost is lower than the stupid giant's, when prices rise again, the stupid giant is even more vulnerable. If one attack doesn't kill them, you can try twice, three times — eventually they die. Once pushed down, the fund's net value can't hold up, and the fund manager can pack up and leave. Then those shares can be picked up at Cinda/Orient asset management prices. During a large-level adjustment, say a monthly hub adjustment, a concentrated attack breaking through one point to take down one fund company will cause all fund companies to face severe redemption waves. Then the entire market can be thoroughly picked clean at Cinda/Orient prices. What fun is eating retail investors? Funds are retail investors bundled up together, letting you swallow them in one bite — much less hassle.
Recently, a small weekly hub oscillation has been enough for this ID to test things out. A pullback of less than 20%, a stock that would drop only 5% even on a limit-down, one with fundamentals facing serious improvement — and already some people can't sit still. Some stupid giants are overweight, and finding help for support was fruitless since nobody had time. Look at last week's fund net values — if this situation continues for one more week, some people probably can't hold out anymore. Of course, funds still have strength right now, and one blow definitely won't kill them. This time is just playing around — feels pretty good. At worst it's just a wash trade, making an excellent short-term trade. This ID has no intention of knocking anyone down this round. If it doesn't work at 12 yuan, who says we can't do it at 20 yuan? As long as the short-term trade profits are extracted, the ones who die are certainly those who didn't make short-term trades!
This ID has always been merciful to retail investors — serious warnings were given at the highs about wash trading coming. If you didn't hear it, that's not this ID's problem. Not every stock has a market maker now — funds have become an increasingly important ambush target. This target exists in reality, and moral sermonizing is useless. If you don't do it, do you think nobody else will? As for how to neutralize this fatal flaw and prevent it from becoming a major breakthrough target for foreign hot money — that's something the management, whose level is still at elementary school, couldn't possibly understand. On this matter, this ID's attitude has always been very clear: why not take what's free? What's been done is done. This ID simply follows the technical signals — buying at buy points, selling at sell points. Anything with a fatal flaw can generate profit, can have its blood drawn — why not play? The guilty party isn't this ID for exploiting the flaw, but whoever created such a flaw to invite attack.
The market economy is forever bloody. All of this is determined by the virtualization of capital. Virtual capital is like a zombie — without drinking blood, how does it survive? This must be clearly recognized. Once markets are opened, they inevitably face all kinds of attacks. If the management's intelligence doesn't reach even a thousandth of the attacker's, they can only flounder. The next to die will definitely be the funds. During a monthly-level adjustment, this scene will inevitably play out. The only remaining question is: could this show start early even in just a weekly-level adjustment? The probability is low — but if it really happens, these funds are truly weak. Against opponents this weak, this ID has no interest. The stronger the opponent, the more fun the game.
Investing — be a lone wolf. Bear all things yourself. And this ID's theory is an objective description, unrelated to any subjective analysis, like sunlight and air — existing regardless of whether you recognize it. Without understanding this point, you cannot possibly comprehend this ID's theory.
Plagiarism is strictly prohibited; violators will be prosecuted.
Replies
缠中说禅 2007/2/6 15:16:44
[Anonymous] abc
2007-02-06 15:14:43
May I ask LZ, regarding yesterday's 000002 quarterly chart, why not consider the impact of ex-rights and ex-dividends on price?
==
Not considered — no ex-rights adjustment. (Translator's note: wordplay on fuquan 'husband's rights' vs fuquan 'dividend adjustment')
缠中说禅 2007/2/6 15:22:24
[Anonymous] 曦月
2007-02-06 15:15:04
Could the blogger please help analyze 600343
Bought in at 15.8
What should I do?
Should I find a sell point to sell, then re-enter to bring the cost down?
Or continue holding?
Afraid it'll drop again tomorrow..
==
Why did you buy so high? Buy at buy points. When was there ever a buy point at 15.8? If you make a mistake, fix it first. Today there was a position at 16 yuan — why didn't you exit? Such an obvious sell point and you didn't take it? Study the theory well. From now on, stick to buying at buy points and selling at sell points. This stock's medium-term is fine, but short-term there's some pressure. After all, the market dropped so much and this stock didn't fall — unless the market subsequently attacks above 2720 showing strength, only then would a breakout to new highs be relatively reliable. Otherwise, rashly going up now means everyone is happy but the ones who pushed it up are in trouble. This ID never plays Lei Feng — only follows market rules. What are market rules? This ID's theory.
缠中说禅 2007/2/6 15:24:36
[Anonymous] 摄影之友
2007-02-06 15:21:09
Dear blogger:
Thank you for your new article. Let me upvote first, read later.
Today I specifically took the day off to stay home. In the morning I first sold some Jiuyao, then applied your theory — at the 5-minute divergence, I entered at 9.73 yuan and made a small short-term trade. My heart doesn't feel as awful as yesterday (my currency fund also stopped hurting today, halted the decline and warmed up). Thank you!~~~~
P.S.: I only have a tiny portion of Life Insurance in hand. It's what I use to practice short-term trading.
Thank you, dear blogger. I really want to stay home watching charts and making short-term trades. This feeling is wonderful.
==
No need to thank this ID. The technique is yours. The key is mastering it yourself — it has nothing to do with anyone else.
缠中说禅 2007/2/6 15:28:04
[Anonymous] 听缠说禅
2007-02-06 15:26:34
Blogger, China Unicom finally moved too — this is a 30-minute divergence, I didn't misjudge, right?
==
Knowing how to buy AND sell — that's a perfect trade!
缠中说禅 2007/2/6 15:34:55
[Anonymous] 老无用
2007-02-06 15:17:36
Been lurking for many days, but have been carefully reading the blogger's articles — there's much I don't understand. Today the blogger listed several classic stocks' quarterly and monthly charts to illustrate how to find major bottoms. After carefully studying these stocks' quarterly charts, I still have many unresolved questions. The biggest issue is 600640 — by the several criteria for divergence signals, this stock's Q4 2003 had already hit new lows, the MACD area was obviously smaller than the prior period, seemingly qualifying as divergence. Of course, the signal/fast lines compared to Q3 were still slightly declining, but compared to the prior period they clearly hadn't made new lows. 000001, 000002, 000006, 000009, etc. were all judged as divergence under the same conditions. But this stock, after experiencing a fairly strong rebound, crashed heavily again, not bottoming until Q3 2005. Of course this is an obvious divergence — MACD area smaller than the prior period — but similarly the signal/fast lines compared to the previous quarter were still declining. The only difference is the MACD bars shortened compared to the previous quarter, but other stocks also had bars that didn't shorten, such as 000001, 000009, etc. This creates enormous confusion in judging divergence.
Additionally, when 000012 was at its bottom, the MACD area didn't shrink, the signal/fast lines were still declining, and the bar lengths didn't shorten either — so how do you judge its divergence? Are there other analytical criteria that the blogger hasn't yet disclosed?
Finally, the dividend adjustment issue. Two months ago the blogger jokingly said they oppose "husband's rights" (fuquan), hence no dividend adjustment (fuquan), and later said either way is fine. But there's a huge difference between the two, because after adjustment there are no new lows to speak of, and the premise for divergence analysis is lost. These questions have plagued my mind for a long time, causing great difficulty in both studying and live trading. I sincerely hope the blogger can clarify. Thank you.
==
Are your charts adjusted for dividends? Don't adjust. For ultra-long-term, there's even less need to adjust. For short-term there's some necessity, since sudden gaps from ex-dividends change some indicators. But that's only within a certain period after the ex-dividend. If you're skilled, there's absolutely no need to adjust.
缠中说禅 2007/2/6 15:36:17
[Anonymous] 三藏
2007-02-06 15:31:52
Could the blogger please explain the Chán Zhōng Shuō Chán trend average force? I can't understand it
I've been thinking about it for a long time. Any classmates who know, please tell me!
Today is my first day studying
===
Use MACD — it's simpler. To use this ID's indicator, you'd need to build a custom indicator yourself. Only then is it useful. Otherwise, ordinary people can't use it well.
缠中说禅 2007/2/6 15:46:48
[Anonymous] 听缠说禅
2007-02-06 15:39:01
Chán Zhōng Shuō Chán
2007-02-06 15:28:04
[Anonymous] 听缠说禅
2007-02-06 15:26:34
Blogger, China Unicom finally moved too — this is a 30-minute divergence, I didn't misjudge, right?
==
Knowing how to buy AND sell — that's a perfect trade!
===========================
Blogger, do you know — in order to study your theory, during this market oscillation, I've been following along with my own judgments and practicing, but because I'm slow-witted, my skills aren't polished, and sometimes other matters delayed me from watching the market, I still made some mistakes and had some regrets. At least I managed to lower my cost on China Unicom by 0.2 yuan, which already made me quite happy. Among everyone here, probably few can match Class Monitor Luoguo's 20% performance — I really envy him!
===
Lowering cost is an achievement. Transitioning from one mindset and trading method to another is a difficult process. Many people will regress — perseverance is the key. If you're not yet skilled, start by reducing your trading capital.
缠中说禅 2007/2/6 15:49:20
[Anonymous] 并不完美
2007-02-06 15:44:02
The blogger's theory doesn't seem to work on ICBC though:
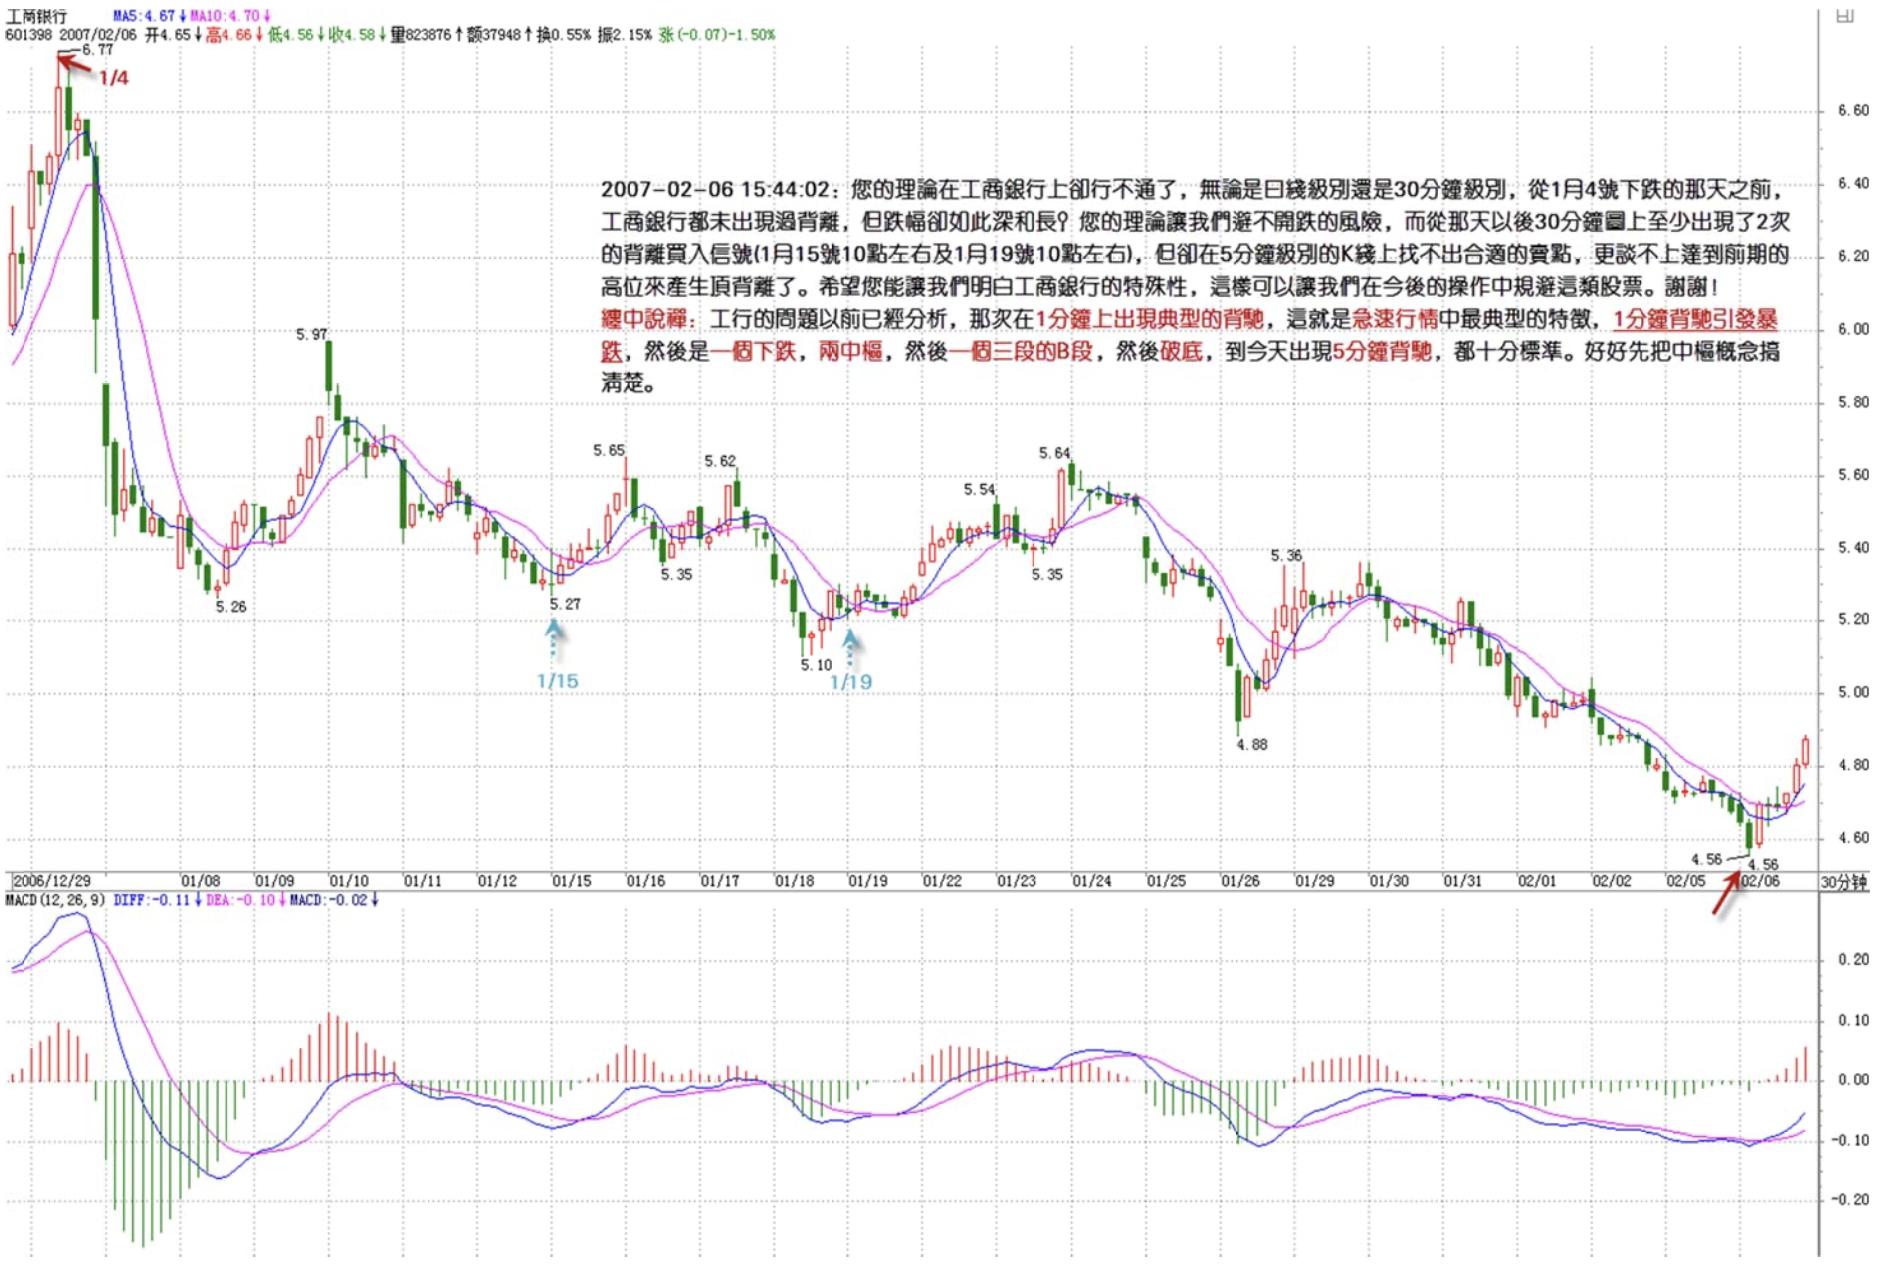
Whether on the daily level or the 30-minute level, before the day it started dropping on January 4th, no divergence had appeared, yet the decline was so deep and prolonged? LZ's theory couldn't help us avoid the downside risk. And after that day, at least 2 divergence buy signals appeared on the 30-minute chart (around 10 AM on January 15th and around 10 AM on January 19th), but on the 5-minute K-line you couldn't find suitable sell points, let alone reaching the previous high to produce a top divergence.
I hope LZ can help us understand what's special about ICBC, so we can avoid this type of stock in future trades.
Thank you
==
The ICBC issue was analyzed previously. That time it showed a typical divergence on the 1-minute chart — this is the most typical feature in rapid movements. A 1-minute divergence triggers a crash, followed by a decline with two hubs, then a three-segment B-segment, then breaking the bottom, and today showing a 5-minute divergence — all absolutely textbook. First get the hub concept properly clear.
缠中说禅 2007/2/6 15:53:06
[Anonymous] 下下
2007-02-06 15:47:00
Master Chan, what's going on with Guanzi today? All the other steel stocks turned green, but why did it choose today to consolidate with no rebound?
==
Dropped less, naturally rebounds less.
Attention everyone!
When playing a rebound, generally two types are definitely safe: First, index heavyweights — you can't get sentiment going without pulling index stocks, so they must be pulled up. Second, stocks that showed divergence after heavy declines — a small rebound alone gives 10%+ of space.
缠中说禅 2007/2/6 15:55:08
[Anonymous] 三藏
2007-02-06 15:46:14
Could the blogger please explain the Chán Zhōng Shuō Chán trend average force? I can't understand it
I've been thinking about it for a long time. Any classmates who know, please tell me!
Today is my first day studying
===
Use MACD — it's simpler. To use this ID's indicator, you'd need to build a custom indicator yourself. Only then is it useful. Otherwise, ordinary people can't use it well.
===
Seems really hard... So the prerequisites for using the blogger's "trend average force" indicator are: 1. first use MACD, 2. build a custom indicator yourself.
But how can you build an indicator when you don't even understand the definition?
Could you re-explain the definition in a different way?
Thank you, blogger!!
==
No, no — MACD alone is sufficient. Normal people don't need this ID's indicator. It's precise but very cumbersome to use, and you'd have to code it yourself. Ordinary people simply can't handle it. Better to just use MACD directly. The accuracy is slightly lower, but as long as you combine it well with hubs and divergence, 95%+ accuracy is absolutely no problem. That's more than enough.
缠中说禅 2007/2/6 15:58:55
[Anonymous] 我
2007-02-06 15:46:44
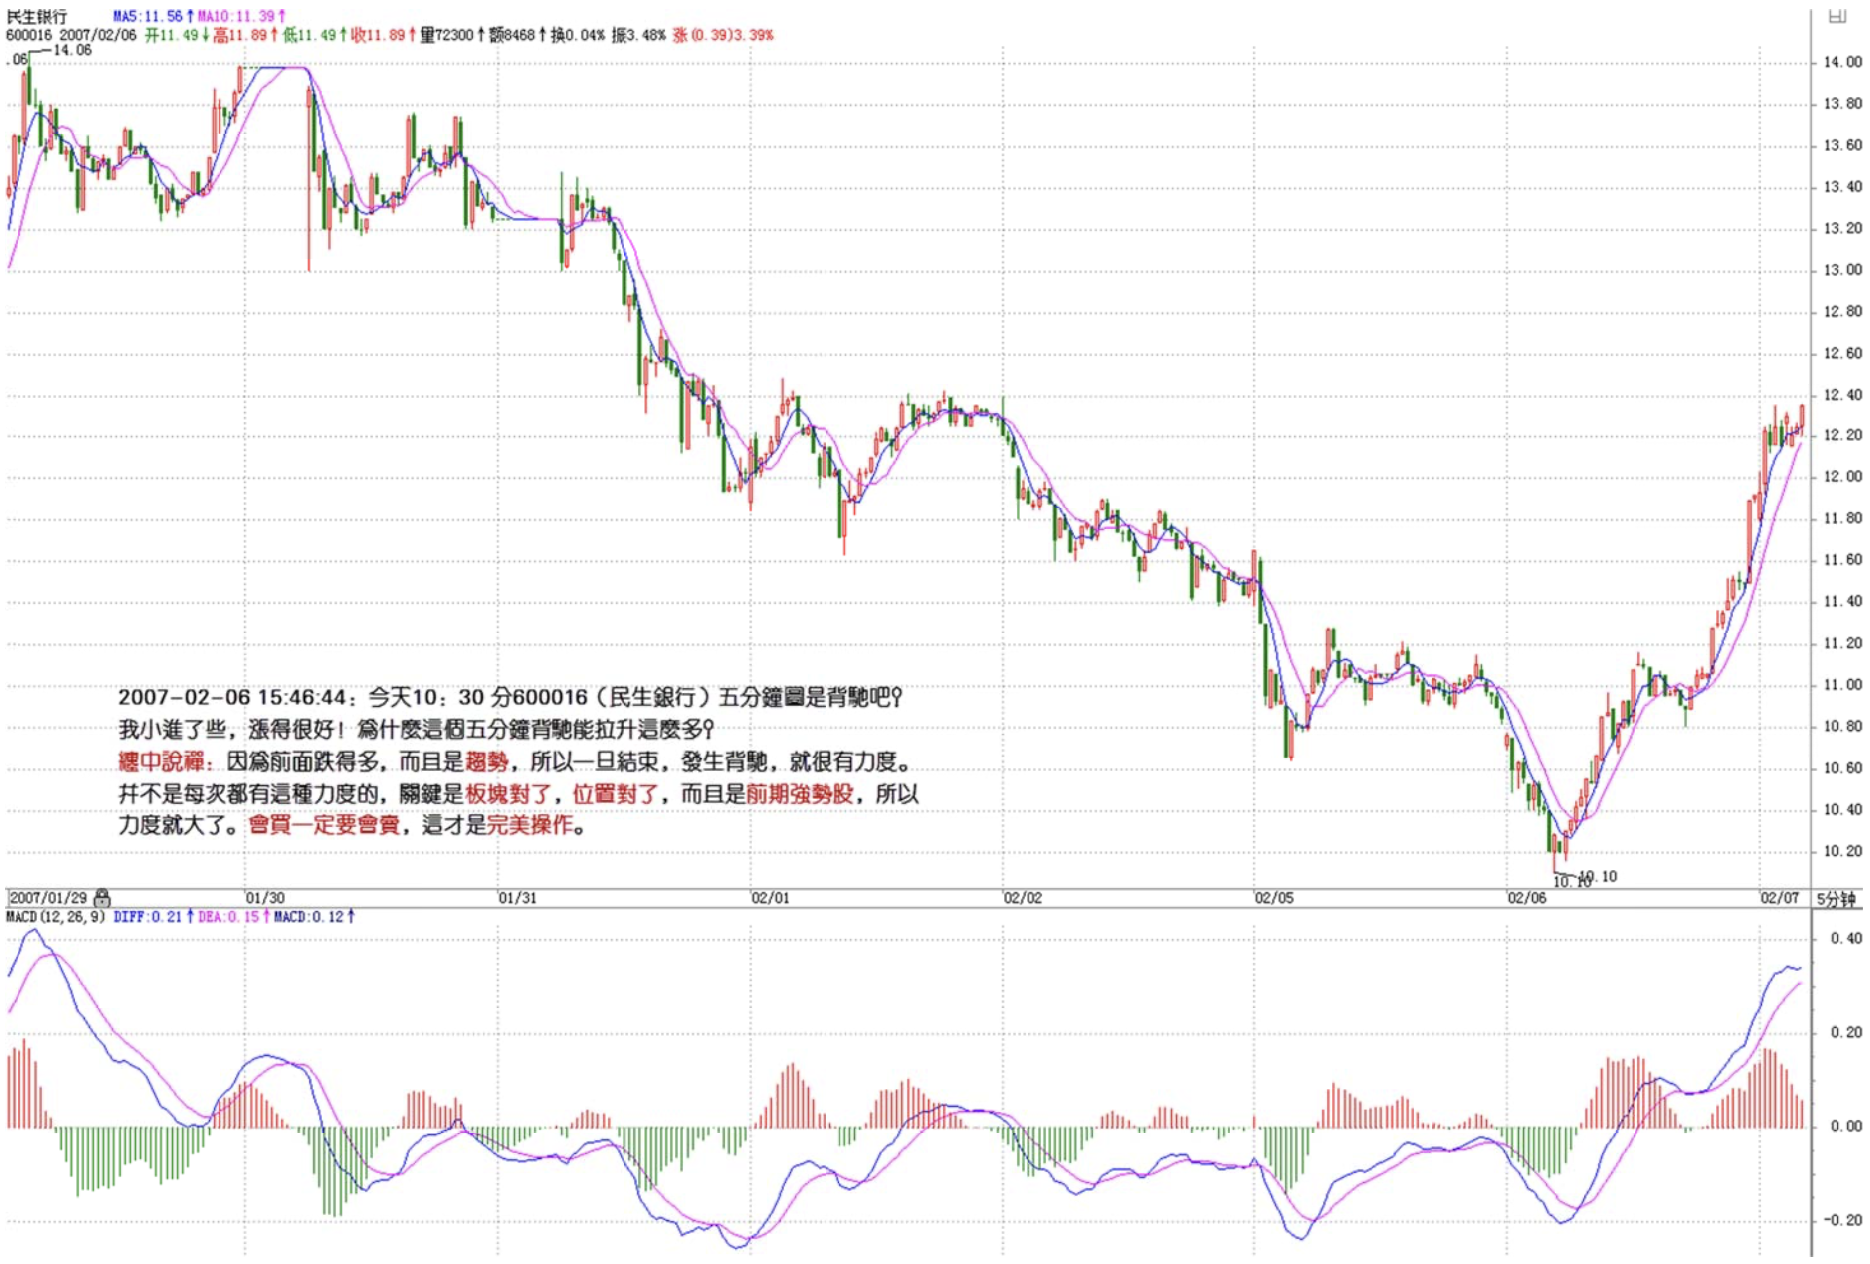
Master Chan, 600016's 5-minute chart at 10:30 today was a divergence, right! I bought a small position and it rose nicely! Why could this 5-minute divergence rally so much!
==
Because the prior decline was large and it was a trend — so once it ended with divergence, the resulting move was very powerful. Not every instance will have this kind of force. The key is getting the sector right, the position right, and the stock being previously strong — so the force was large. Knowing how to buy means you must also know how to sell — that's a perfect trade.
缠中说禅 2007/2/6 16:00:15
[Anonymous] 新手
2007-02-06 15:55:58
Math girl, I've only been studying your theory for a short while~ When using MACD to assist with divergence, how do you judge when the bars are red?~ Thanks for the reply
==
It's all very clearly explained in the lessons. Read them carefully and repeatedly. Especially from the hub section onward.
缠中说禅 2007/2/6 16:07:50
[Anonymous] 老无用
2007-02-06 16:02:39
Today, following the blogger's divergence theory, at 9:55 AM I spotted a 15-minute divergence on 600784, entered with a small position, and the profit rate on that single trade was very satisfying. Could the blogger comment on whether my judgment was correct? Thanks!
==
Good — but knowing how to buy means you must know how to exit too. If the quantity isn't large, you can exit on a small-level divergence, then buy back when it returns. This kind of back-and-forth is how technique gets honed.
缠中说禅 2007/2/6 16:10:59
[Anonymous] Leisurely
2007-02-06 16:05:51
Boss, don't you think you should feel a little ashamed?
The boss won't act as the main force to push stocks up, only wants to suck blood — just like a super-sized retail investor.
Others charge into battle at the front, the boss enjoys the results, and once things look wrong, turns and runs...
If everyone with big capital acted like this, the market would never have any action.
==
The market is not a charity. When it should rise, be fierce — like 777 right now. When it should fall, be equally fierce — like 999 these past few days. The key is your technique.
So this ID has repeatedly said: if your technique isn't good, absolutely don't follow this ID's stock picks. Of course, following this ID's stocks will definitely sharpen your technique. These stocks are all definitely fine for the medium-term, but the short-term oscillations — isn't that exactly where technical skills find their use?
缠中说禅 2007/2/6 16:13:13
[Anonymous] 木香珠
2007-02-06 16:02:27
Here's my homework — hoping for Master Chan's guidance, don't let me foolishly overthink and waste time and opportunities. On 600028's daily chart, on January 19th I judged a continuation as a reversal, entered the next day. Then I judged the January 24th lip kiss as a wet kiss. Because I'm not skilled at reading charts, when a lip kiss appeared on January 30th during the rebound, I couldn't clear my position in time. The stock then plummeted, and yesterday I decisively cleared out. Could have profited 10%, ended up losing 10% — painful. Today, looking at the 5-minute chart, at 1:55 PM at the No. 2 buy point I added back a small position at the low.
==
Not selling at a sell point is the biggest mistake — even worse than not buying at a buy point. Also, please read more of the chapters from the hub section onward. With hubs, the earlier material is less important.
缠中说禅 2007/2/6 16:15:11
[Anonymous] 学生古代
2007-02-06 15:46:44
Teacher, I feel there's a lot of capital on the sidelines, always waiting for something? China won't end up like Southeast Asia years ago, but there are too many wolves eyeing the sheep!
==
Why not turn yourself into a wolf? This has nothing to do with capital size. As long as you can buy at buy points and sell at sell points, you are the fiercest wolf.
缠中说禅 2007/2/6 16:19:35
[Anonymous] 中间体
2007-02-06 16:00:31
Please, Chan sister, point out what's wrong with the following trade (and thinking).
000407, I'm very bullish on it. The daily K-line is in the upward phase of the No. 6 hub segment. Today before close, on the 1-minute chart, the red bars started shortening, and the 5-minute was about to start diverging, so I sold 1/3 of my position. But I'm still worried it'll immediately surge back up tomorrow. According to Chan sister's theory, that shouldn't be possible — please respond.
==
That's a divergence at even below the 1-minute level. You could actually have waited until the 1-minute deteriorated before acting. Once you've sold, so be it — absolutely don't chase it higher to buy back. Money sitting there won't go moldy. Wait for the next opportunity — the next opportunity where you have confidence.
缠中说禅 2007/2/6 16:26:19
[Anonymous] 大河
2007-02-06 16:17:03
Yesterday I read LZ's reply about Rocket Stock — I thought it had formed a weekly No. 3 buy point. Even knowing the market would drop this morning, I still bought at the open at 18.35, and it dropped 5 points. Did I make another mistake? At the low of 17.17 I didn't dare to buy back in because there was no divergence. I want to ask, where did I go wrong? Has this stock been in a consolidation since 9:35 AM on February 1st? Because I see the red bars on the closing 5-minute chart are decreasing — does that mean it'll drop again tomorrow? May I ask, Chan sister, did I buy at a sell point?
==
After studying this ID's theory, chasing the opening like a regular person is utterly pointless. Learn to patiently wait for buy points. Was that price this morning a buy point? When it crashed down later, that's when a short-term buy point appeared, right when the market also hit a precise 5-minute buy point. That's when you should have entered, then hedged out or held and waited for a 1-minute sell point — either works. This is how you lower costs — otherwise, what's the point of studying this ID's theory? You might as well just listen to some random advice.
Fix these bad habits of chasing highs or not buying at buy points and selling at sell points — otherwise it's very hard to improve.
Also, by the way — if anyone chased 000938 higher today, that's also problematic. Wait for buy points. Stocks aren't something you absolutely need to own immediately. Wait for a buy point first. Without a buy point, any stock is garbage.
缠中说禅 2007/2/6 16:29:26
[Anonymous] 老无用
2007-02-06 16:26:10
Chán Zhōng Shuō Chán
2007-02-06 16:07:50
[Anonymous] 老无用
2007-02-06 16:02:39
Today, following the blogger's divergence theory, at 9:55 AM I spotted a 15-minute divergence on 600784, entered with a small position, and the profit rate on that single trade was very satisfying. Could the blogger comment on whether my judgment was correct? Thanks!
==
Fine, but —
==
You can't just look at one level — you must also look at the sub-level to find the precise buy point. As said yesterday, yesterday only entered the divergence segment, while the precise buy point requires looking at the sub-level. Go review the previous lesson. What applies to large levels applies equally to small levels.
缠中说禅 2007/2/6 16:31:28
[Anonymous] 刻股铭心
2007-02-06 16:22:47
Let me ask the most basic question — what is a "kiss"? Is it when the short-term and long-term moving averages cross? Don't laugh at me
==
Yes, but it's not important — just auxiliary. MACD serves the same purpose. The key is hubs — if you can't distinguish hubs clearly, you can't graduate from kindergarten.
缠中说禅 2007/2/6 16:35:33
[Anonymous] Little Bird
2007-02-06 16:29:10
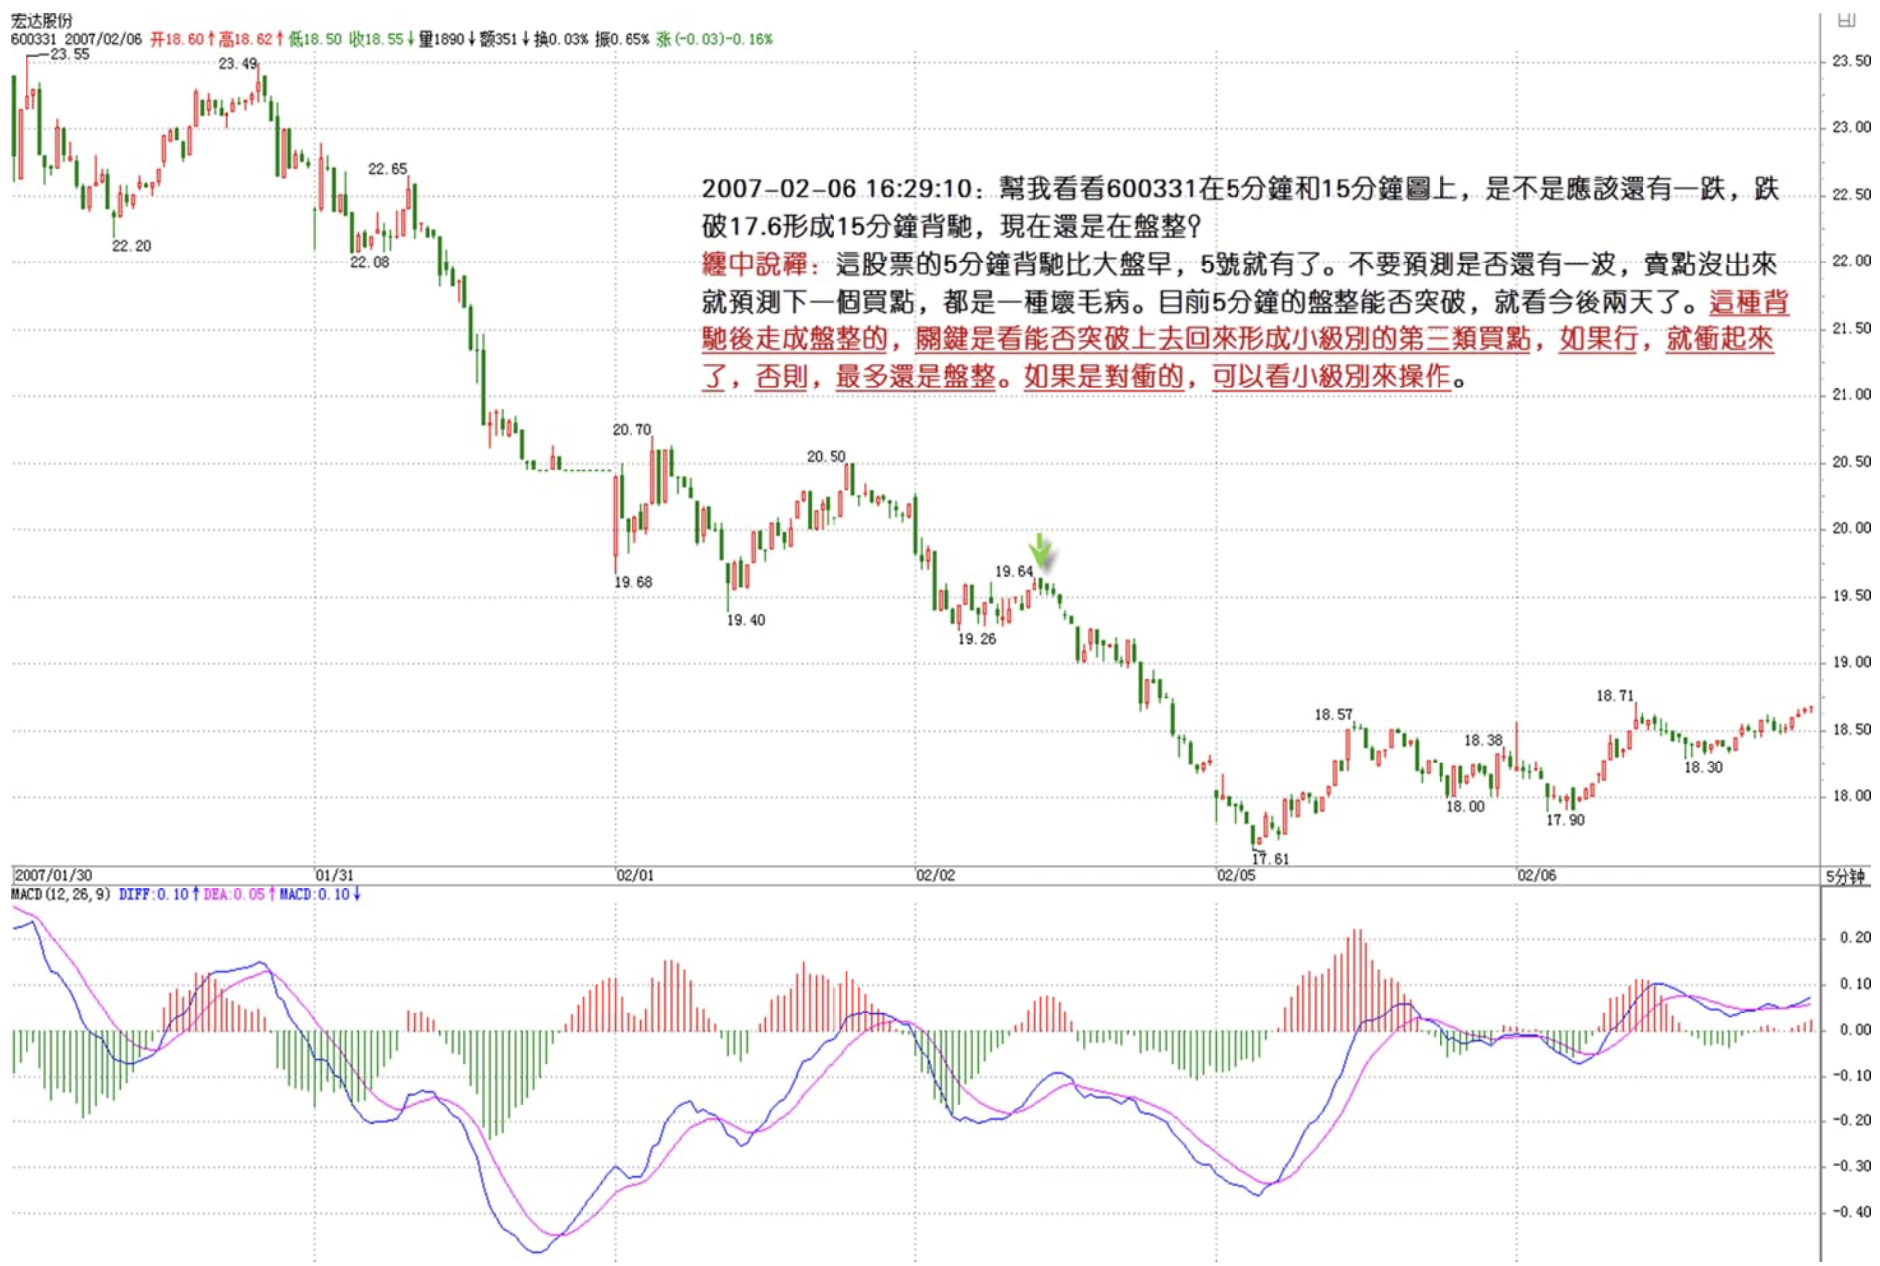
Sister, please help me look at 600331 on the 5-minute and 15-minute charts — should there be another drop, breaking below 17.6 to form a 15-minute divergence? Is it still in consolidation right now?
==
This stock's 5-minute divergence came earlier than the market — it happened on the 5th. Don't predict whether there's another wave. Predicting the next buy point when the sell point hasn't even materialized is a bad habit. Currently the key is whether the 5-minute consolidation can break through — that'll be determined in the next two days. For this kind of consolidation after divergence, the key is whether it can break through and come back to form a small-level third-type buy point. If yes, it'll surge. Otherwise, at most it remains consolidation. For hedging, you can trade on the small level.
缠中说禅 2007/2/6 16:40:04
[Anonymous] Hindsight
2007-02-06 16:35:13
A newcomer here. My understanding of Master Chan's theory is shallow, but I can still memorize and visualize some of the lectures and chart patterns from specific chapters.
In my watchlist, I noticed 600495 Jinxi Axle's daily blue bars were no longer extending, so I checked the 60-minute K-line — the blue bars were also shortening. The 30-minute K-line showed the blue bars had already returned to the zero axis, with the 15-minute heading toward zero. Then on the 5-minute K-line, the signal/fast lines had crossed above the zero axis and pulled back twice. I recalled the scenario Master Chan described — there should be three pullbacks — so I waited patiently. Sure enough, after the third pullback, the small blue bars gradually shortened, and at that point I felt it was the buy point Master Chan described. Combined with the broader market where stocks were turning positive, I decisively bought in at 21.7. After buying, it fluctuated slightly up and down, just a few cents' worth. Closed with a 3% profit.
This was purely luck — I still don't understand the underlying logic.
Could Master Chan or classmates please do a case analysis of this stock combining K-lines with Master Chan's theory? It would help me improve.
I'd also appreciate Master Chan's guidance on future operations for this stock. Thank you.
==
You do have a bit of luck there — you bought between a buy point and a sell point, not at an actual buy point. But that's okay, just find the sell point early. For instance, find a 1-minute divergence for an ultra-short-term sell point. If the movement is very strong, look for a larger-level one. Repeated trading is what produces results.
Note that short-term doesn't mean ignoring large timeframes. Since the large timeframe is clearly in a hub, of course you should do more short-term trades to bring costs down.
缠中说禅 2007/2/6 16:43:14
[Anonymous] 听缠说禅
2007-02-06 16:32:17
I suggest the blogger assign one homework problem every day, with the correct answer published the next day, to help everyone check whether their analysis was wrong and where the errors lie. This way your students will improve faster overall.
==
Sure — today's homework is to use 5-minute and 1-minute charts together to clearly analyze this 5-minute divergence.
Many people here actually identified it in real-time during the session, but doing a post-mortem analysis still has its value.
Signing off first — back tonight. Goodbye.
Answer will be published at 9 PM.
缠中说禅 2007/2/6 21:33:34
Sorry, had some other matters — running late.
缠中说禅 2007/2/6 21:37:23
[Anonymous] 酿酒制药
2007-02-06 21:09:59
Hi Chan sister, that medicine stock still hasn't released any news? Wasn't the result supposed to come out at the end of January? 39 has no credibility at all
==
This constitutes one of the external conditions for this ambush — otherwise it would be genuinely hard to set up. After all, current total fund holdings already exceed 50%, and without market cooperation plus the delayed news, a downward ambush wouldn't be easily launched. So pure technique isn't enough — multiple factors must be combined. Of course, if it's purely short-term trades, that's a different story. Why? Because within the short-term timeframe, other factors can basically be assumed constant, so considering only technical factors suffices.
缠中说禅 2007/2/6 21:41:34
Shuiyu Qingchan
2007-02-06 21:35:34
Chan sister, when will you play the <1812 Overture> for us to listen to?
==
Already played it — it's in the earlier music sessions. If you like it, tomorrow it'll be set as the blog background music.
缠中说禅 2007/2/6 21:47:49
[Anonymous] 淡定
2007-02-06 21:17:04
Blogger, one more question — for a stock like 600050, if you trade based on short-term indicators, most of the time the round-trip spread barely covers the fees. So from a medium-term perspective, how should one bring the cost down?
Looking forward to your answer, much appreciated!
==
Nobody told you to use 1-minute indicators all day. 5-minute will definitely give you more than the fees. Moreover, you need to look at this comprehensively — if it's in the divergence segment of a 30-minute decline, then a 1-minute divergence could constitute the precise bottom. In that case, you can't ignore it just because it's 1-minute.
缠中说禅 2007/2/6 21:52:33
[Anonymous] 努力学2
2007-02-06 21:42:09
Continuing my dumb questions:
Blogger's original text or reply
=================
Chán Zhōng Shuō Chán Trend Decomposition Theorem 1": Any trend of any level can be decomposed into the connection of three same-level trend types: "consolidation," "decline," and "rise."
=================
And this also answers Homework 1 from the previous chapter: "Must what connects two adjacent same-level Chán Zhōng Shuō Chán trend hubs be a trend? Must it be a sub-level trend?" First, it's not necessarily a trend — any trend type is possible. The most extreme case is a gap forming a new "Chán Zhōng Shuō Chán trend hub." Second, it's not necessarily sub-level either — it just needs to be sub-level or below. For example, a gap belongs to the lowest level; if the chart is daily or weekly, it wouldn't be sub-level.
======================
Question: My understanding of trend decomposition is non-overlapping but end-to-end connected (the blogger's examples also suggest this) — closed interval [X1,Xn]=[X1,X2]+[X2,X3]+...+[Xn-1,Xn]. My confusion is: why doesn't the connecting part between hubs have to be sub-level?
By definition, a hub consists of the overlapping part of three completed sub-level trend segments. So on the sub-level chart, between two three-segment movements there must also be 0 or more completed movements, otherwise it contradicts the earlier theorem. If there are no other movements between the two three-segment movements, then they're end-to-end connected — meaning the K-line before the gap belongs to both the last segment of the preceding hub and the No. 1 segment of the following hub. Where did my understanding go wrong?
==
Go look carefully at the 1-minute chart of Capital Stock — then you'll understand why. Consecutive limit-ups only constitute upward shifts of 1-minute hubs, while gaps are at levels lower than 1-minute. Not even a 5-minute hub can form in between.
缠中说禅 2007/2/6 22:14:35
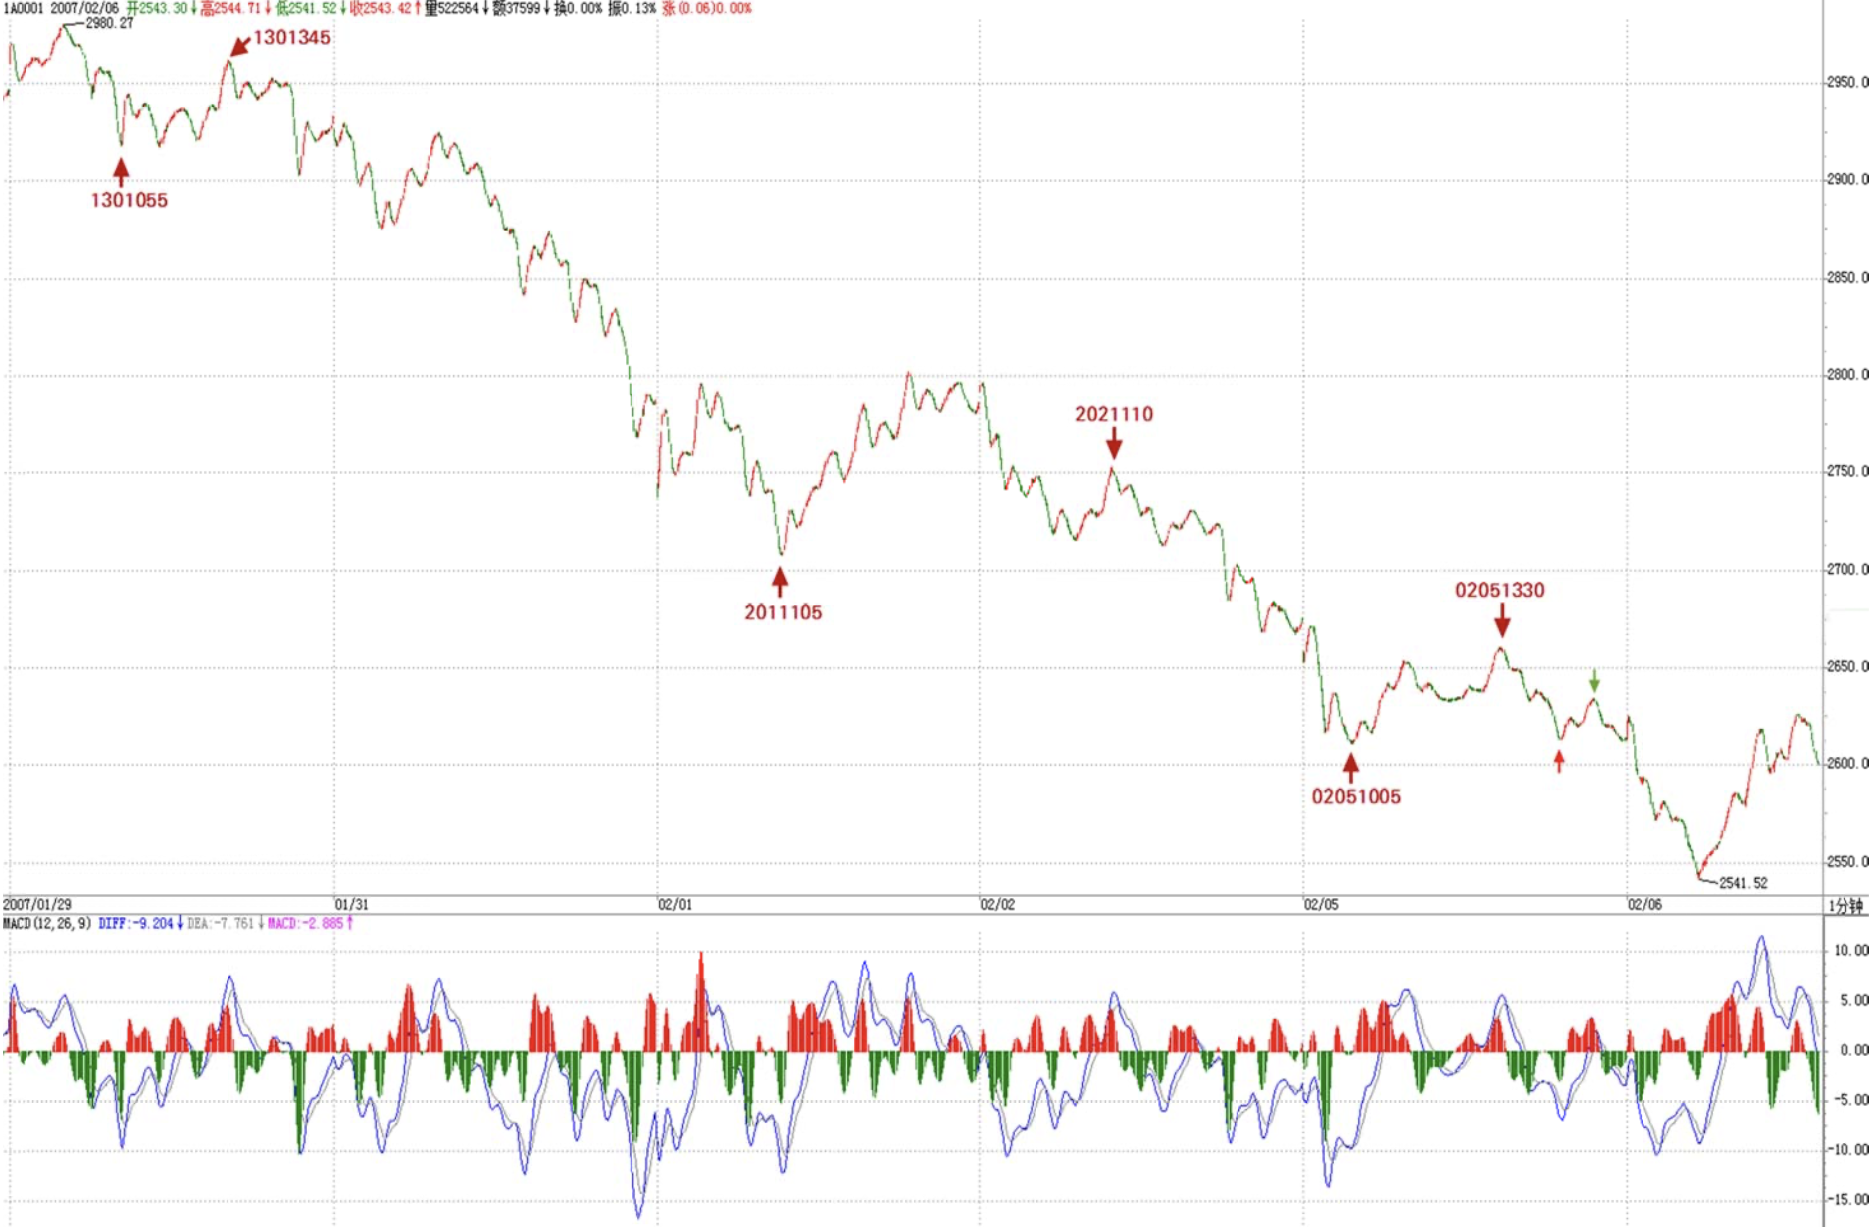
Publishing the homework answer — everyone please refer to this:
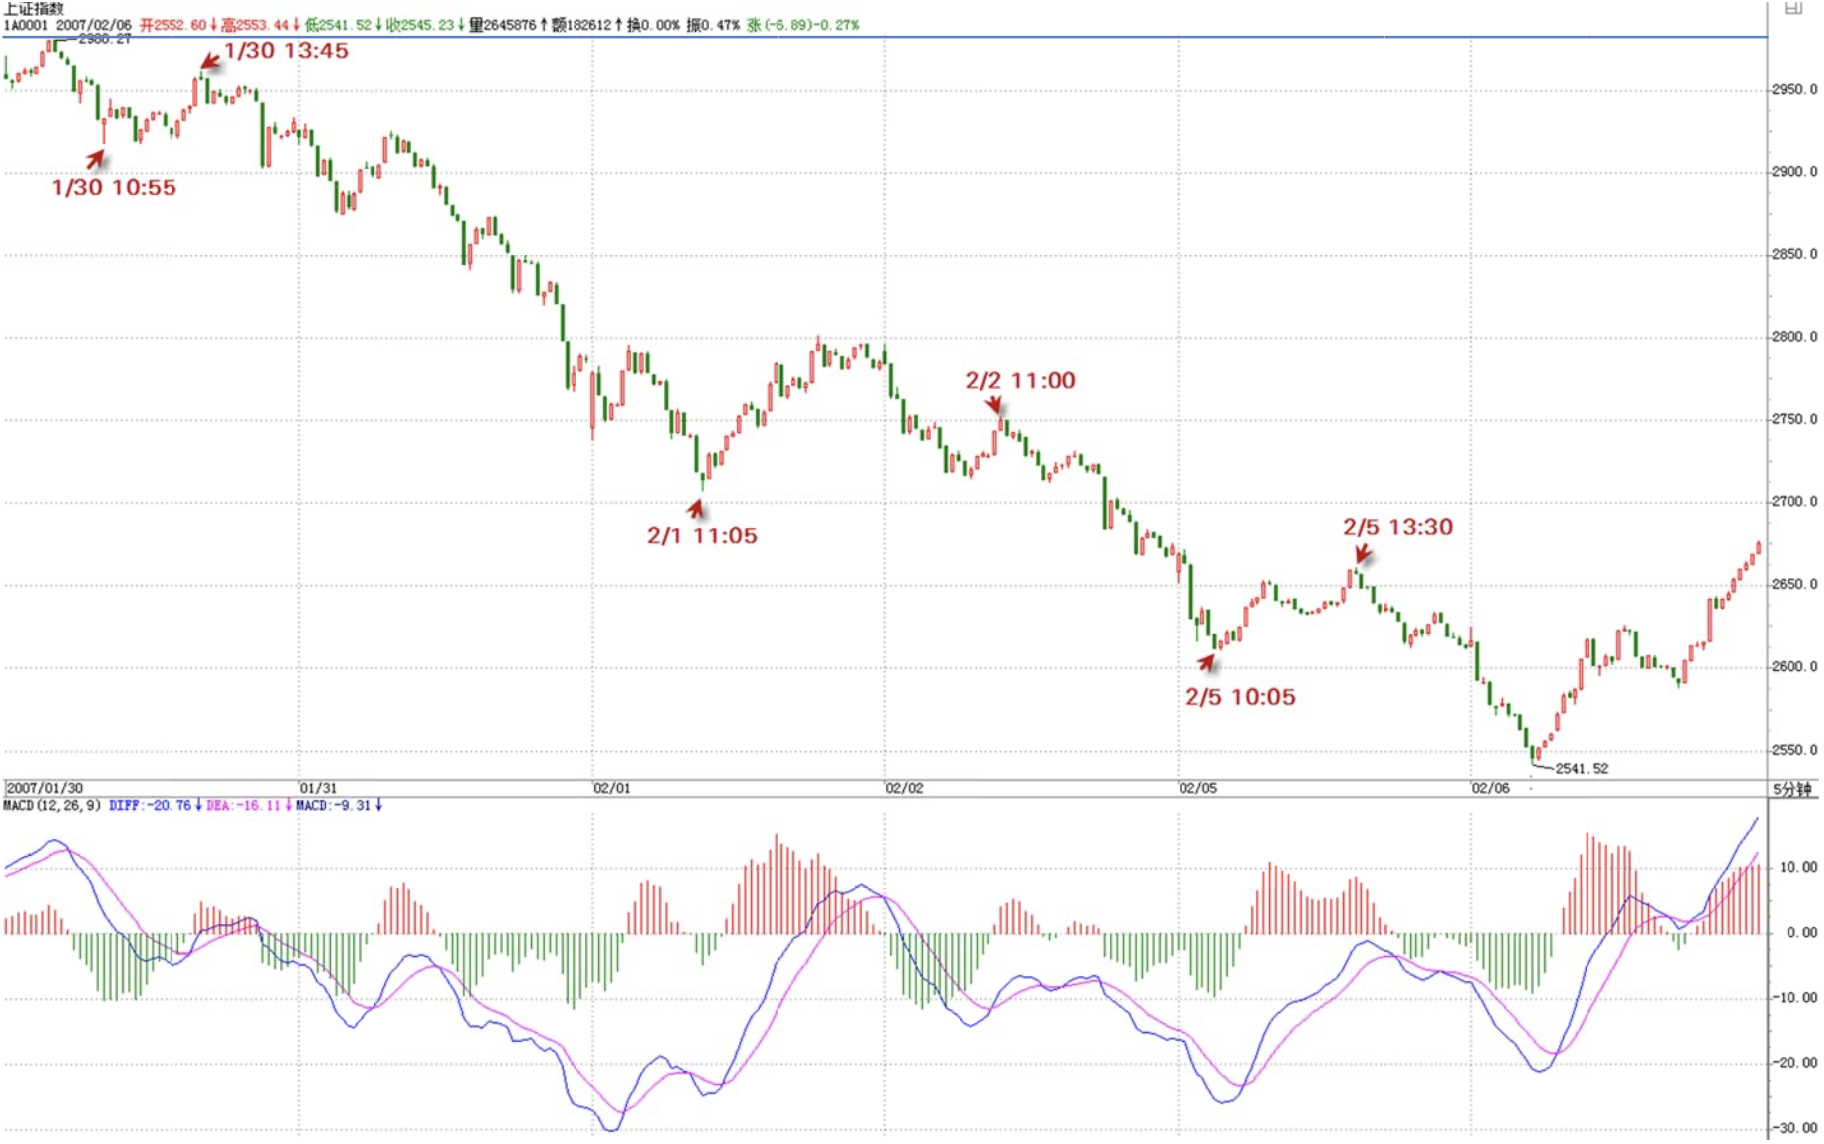
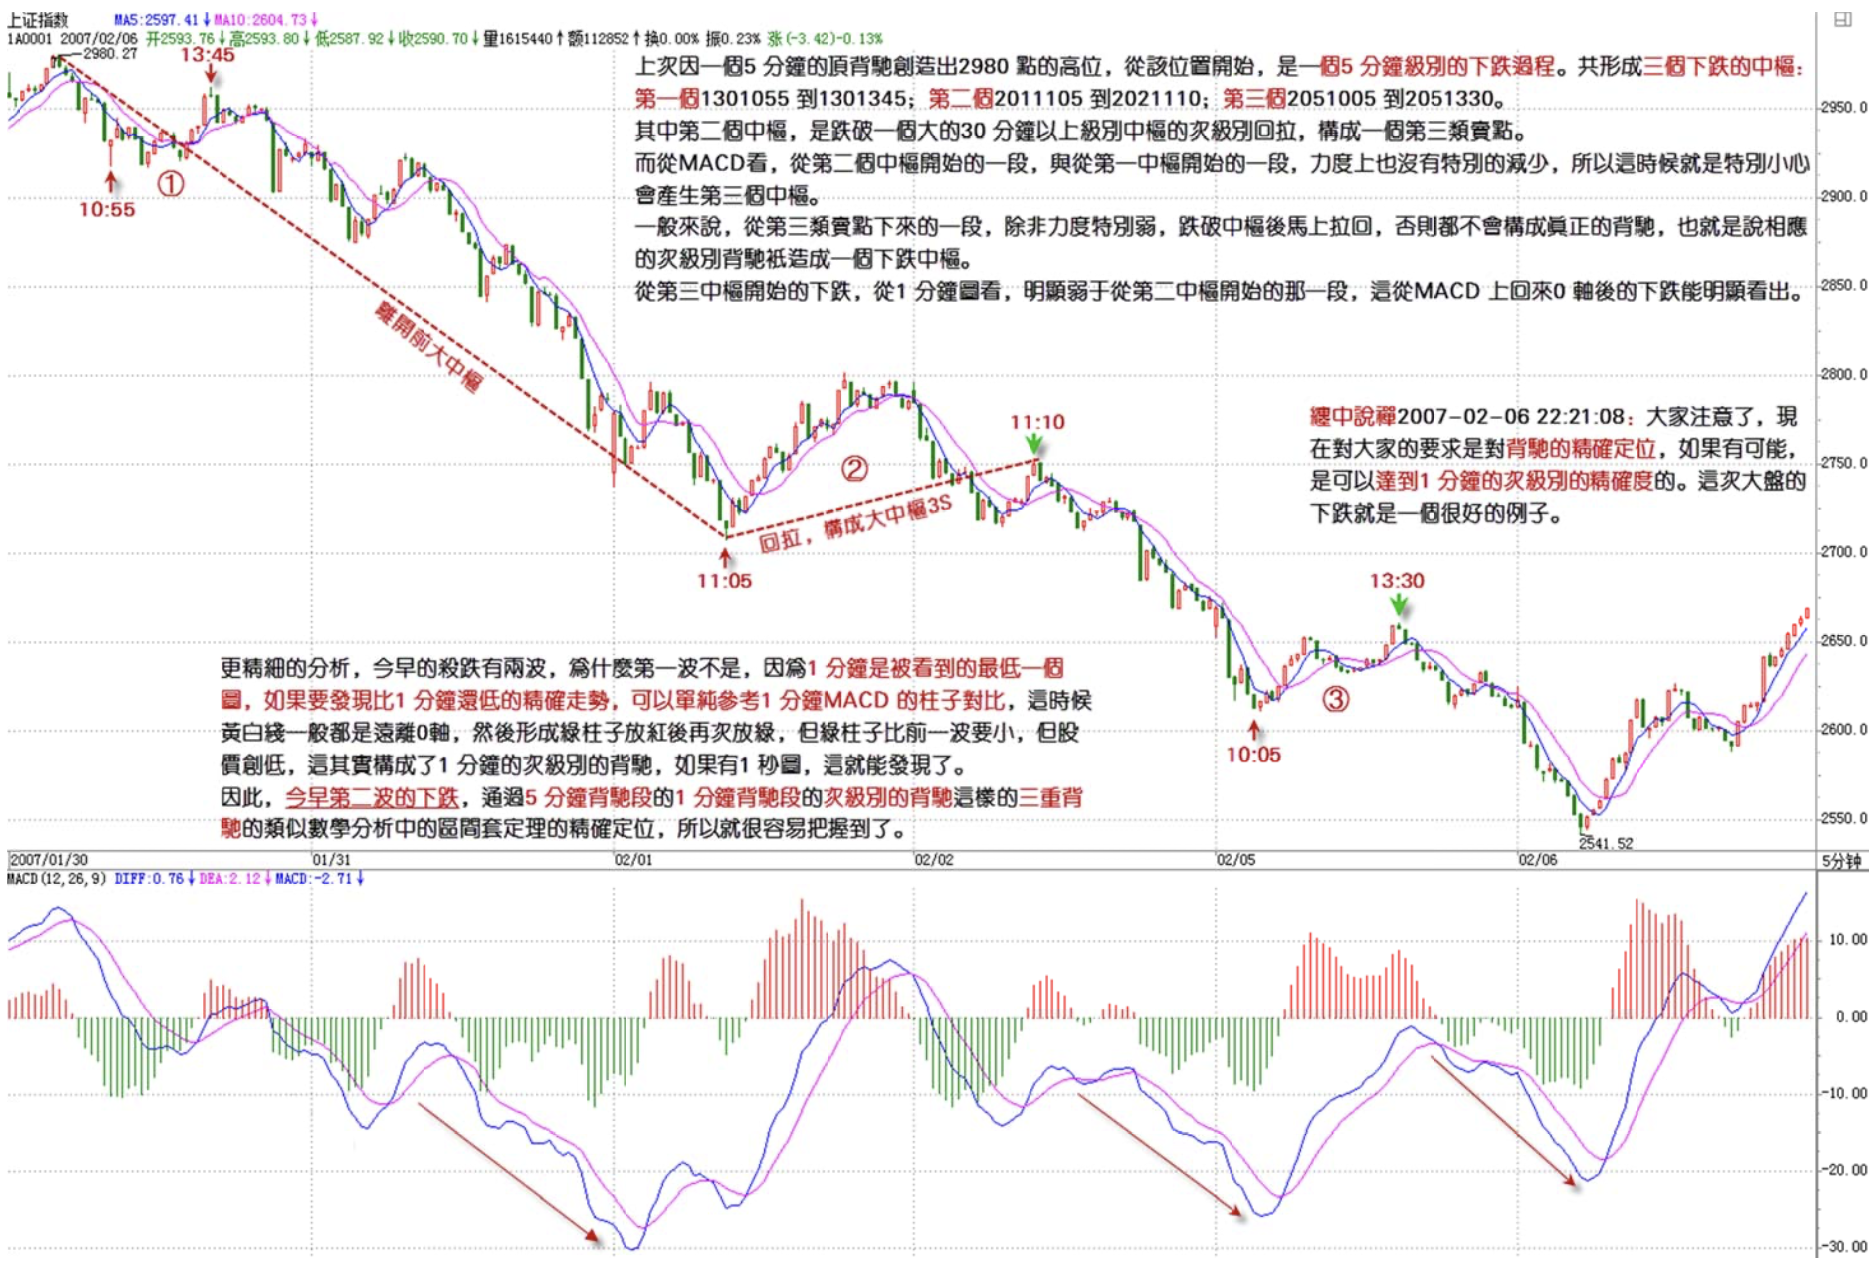
Last time, a 5-minute top divergence created the high of 2980 points. From that position, a 5-minute level decline began, forming three declining hubs: the first from 1301055 to 1301345, the second from 2011105 to 2021110, the third from 2051005 to 2051330.
The second hub was a sub-level pullback breaking below a large 30-minute or higher hub, constituting a third-type sell point. Looking at MACD, the segment from the second hub onward compared to the segment from the first hub didn't show particularly reduced force. So at this point, you needed to be especially alert for a third hub forming. Generally speaking, a segment declining from a third-type sell point, unless the force is particularly weak and prices immediately pull back into the hub after breaking below, won't constitute true divergence — meaning the corresponding sub-level divergence only creates one declining hub.
The decline from the third hub, viewed on the 1-minute chart, was clearly weaker than the segment from the second hub. This is clearly visible on MACD's behavior returning to the zero axis and then declining.
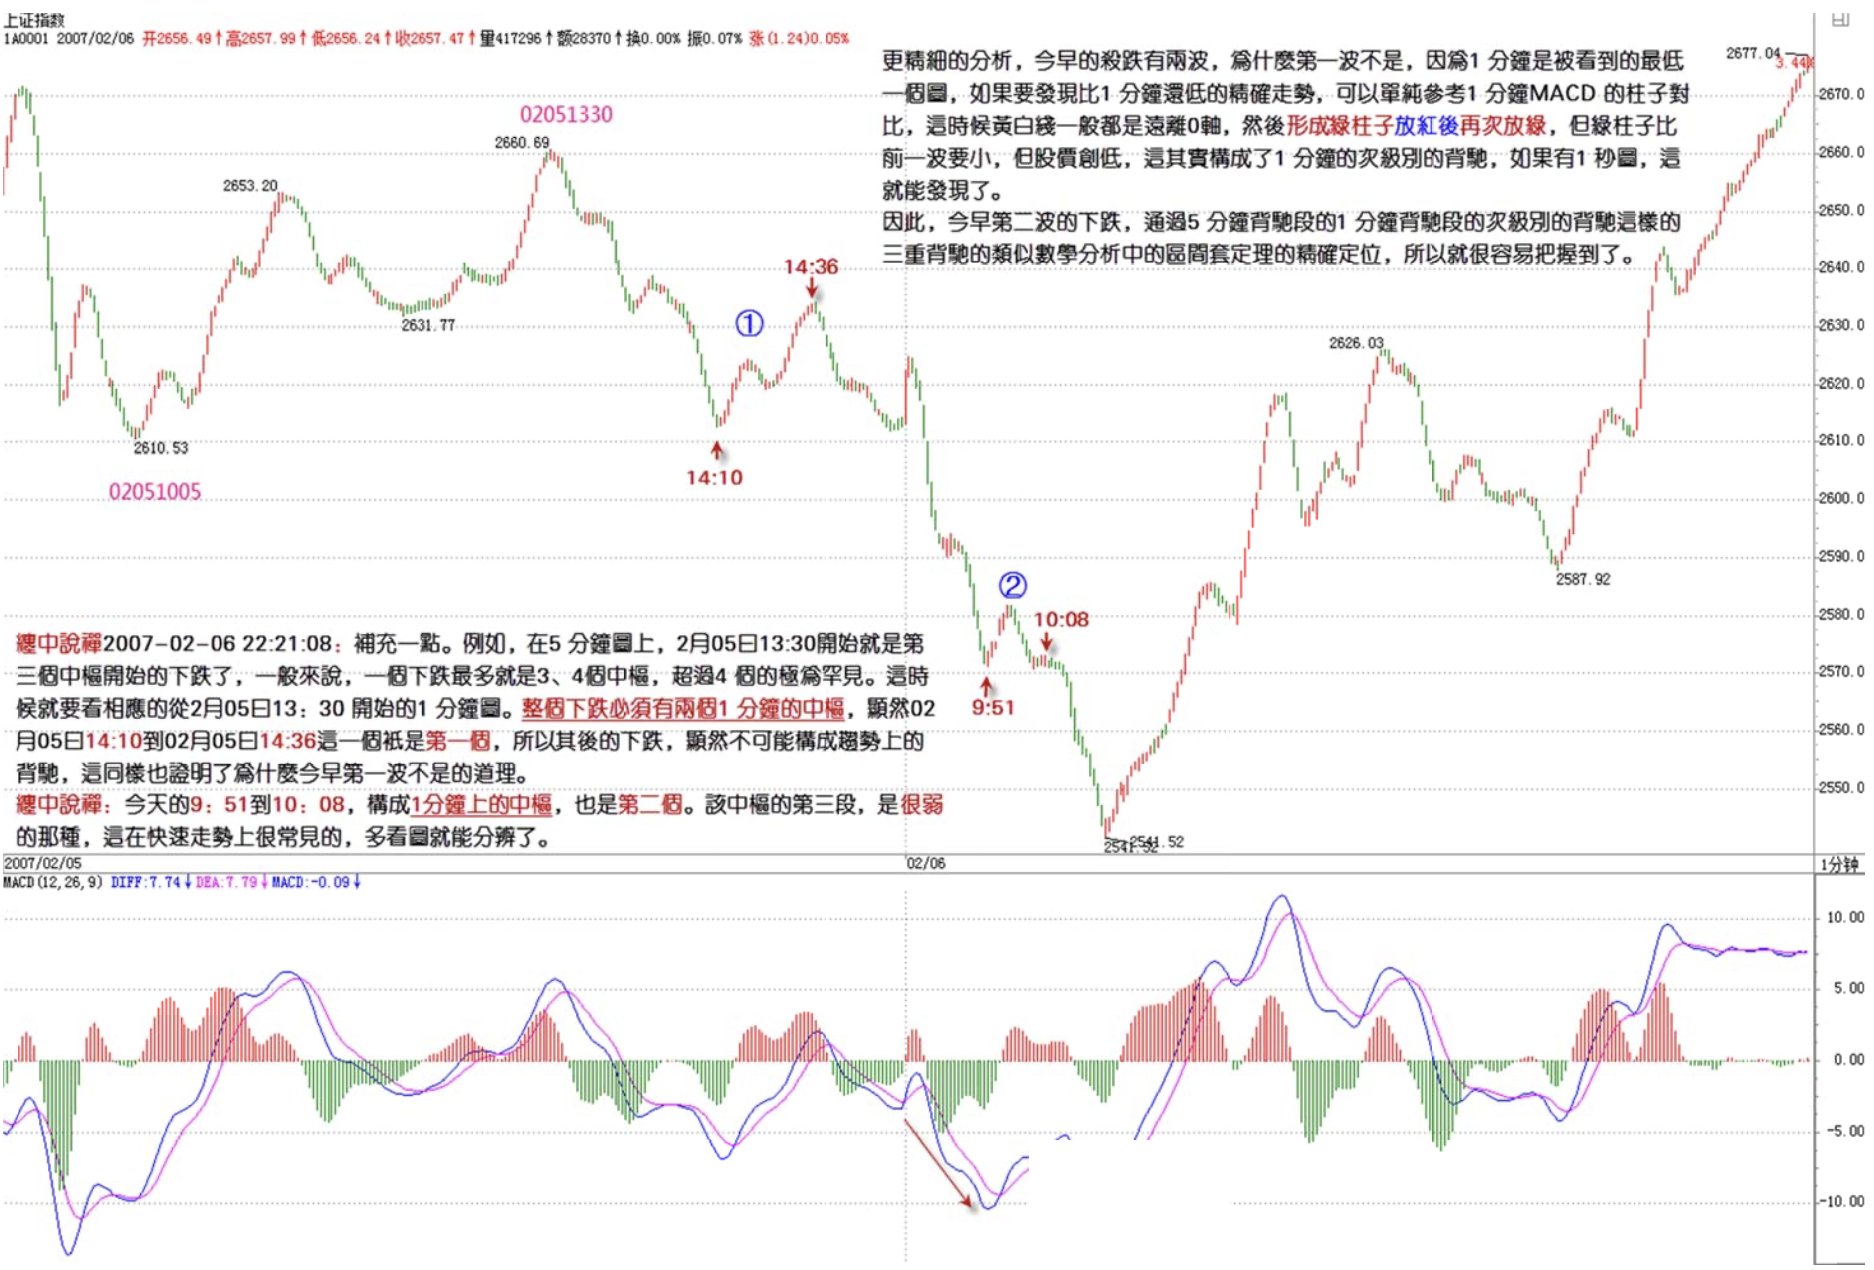
For finer analysis: this morning's crash had two waves. Why wasn't the first wave the bottom? Because the 1-minute chart is the lowest level visible. To discover precise movements at levels below 1-minute, you can simply reference the MACD bar comparison on the 1-minute chart. At this point, the DIF/DEA lines are generally far from the zero axis. Then green bars turn red and then green again, but the green bars are smaller than the previous wave, while prices make new lows — this actually constitutes a sub-level divergence of the 1-minute. If there were a 1-second chart, this would be discoverable.
Therefore, this morning's second wave of decline was precisely located through a triple-nested divergence — the 1-minute divergence segment within the 5-minute divergence segment, and then the sub-level divergence within the 1-minute divergence segment — similar to the Nested Interval Theorem in mathematical analysis. That's why it was so easy to capture.
For those who don't understand the Nested Interval Theorem, please find a mathematical analysis textbook. Or re-study the content of Lesson 27.
缠中说禅 2007/2/6 22:16:46
[Anonymous] 努力学2
2007-02-06 21:56:38
Chán Zhōng Shuō Chán
==
Go look carefully at Capital Stock's 1-minute chart — then you'll understand why. Consecutive limit-ups only constitute upward shifts of 1-minute hubs, while gaps are at levels lower than 1-minute. Not even a 5-minute hub can form in between.
================
Then excluding the gap scenario, is the connecting segment in between necessarily a sub-level movement? Or is my understanding of decomposition wrong?
=
Not necessarily, but it's definitely sub-level or below.
缠中说禅 2007/2/6 22:21:08
Attention everyone!
The current requirement for everyone is precise location of divergence. If possible, this can achieve sub-level precision of 1-minute. This market decline is a great example.
The method is simple. For example, this time it was a 5-minute decline. So after the 5-minute entered its divergence segment, find the divergence segment of the corresponding segment on the 1-minute chart, then find the divergence segment within that 1-minute divergence segment. This gives you precise location.
This method is a bit difficult — try your best to understand it. If you've studied the Nested Interval Theorem before, it should be very simple. Or perhaps find a math textbook first?
缠中说禅 2007/2/6 22:26:51
Supplementary point:
For example, on the 5-minute chart, from 2051330 onward is the decline from the third hub. Generally speaking, a decline has at most 3-4 hubs — more than 4 is extremely rare.
At this point, you need to look at the 1-minute chart from 2051330 onward. The entire decline must have two 1-minute hubs. Obviously, 02051410 to 02051436 is only the first one, so the subsequent decline obviously cannot constitute trend divergence. This also proves why this morning's first wave wasn't the bottom.
缠中说禅 2007/2/6 22:31:56
[Anonymous] 努力学2
2007-02-06 22:26:02
Chán Zhōng Shuō Chán
Not necessarily, but it's definitely sub-level or below.
===============
I'm really sorry I still don't understand. May I trouble the teacher for a detailed explanation: A hub consists of the overlapping part of three completed sub-level trend segments. So on the sub-level chart, between two three-segment movements there must also be completed segments (gaps excluded), otherwise it conflicts with the decomposition theorem. (Chán Zhōng Shuō Chán Trend Decomposition Theorem 1": Any trend of any level can be decomposed into the connection of three same-level trend types: "consolidation," "decline," and "rise.")
Is it that my understanding of decomposition is wrong (non-overlapping but end-to-end connected)? [X1,Xn]=[X1,X2]+[X2,X3]+...+[Xn-1,Xn]
==
Gaps are of infinitely low level and don't constitute a segment within any hub. This doesn't contradict the decomposition theorem at all. Uptrends and downtrends are both completed trend types — they're a bigger concept than hubs and the segments connecting hubs. Don't confuse them. A trend type's level only relates to the hubs it contains. For example, a trend type containing one daily hub must be a daily-level consolidation. One containing two or more daily hubs must be a daily-level trend. This has nothing to do with the level of segments connecting the hubs.
缠中说禅 2007/2/6 22:35:53
[Anonymous] 荷塘月色
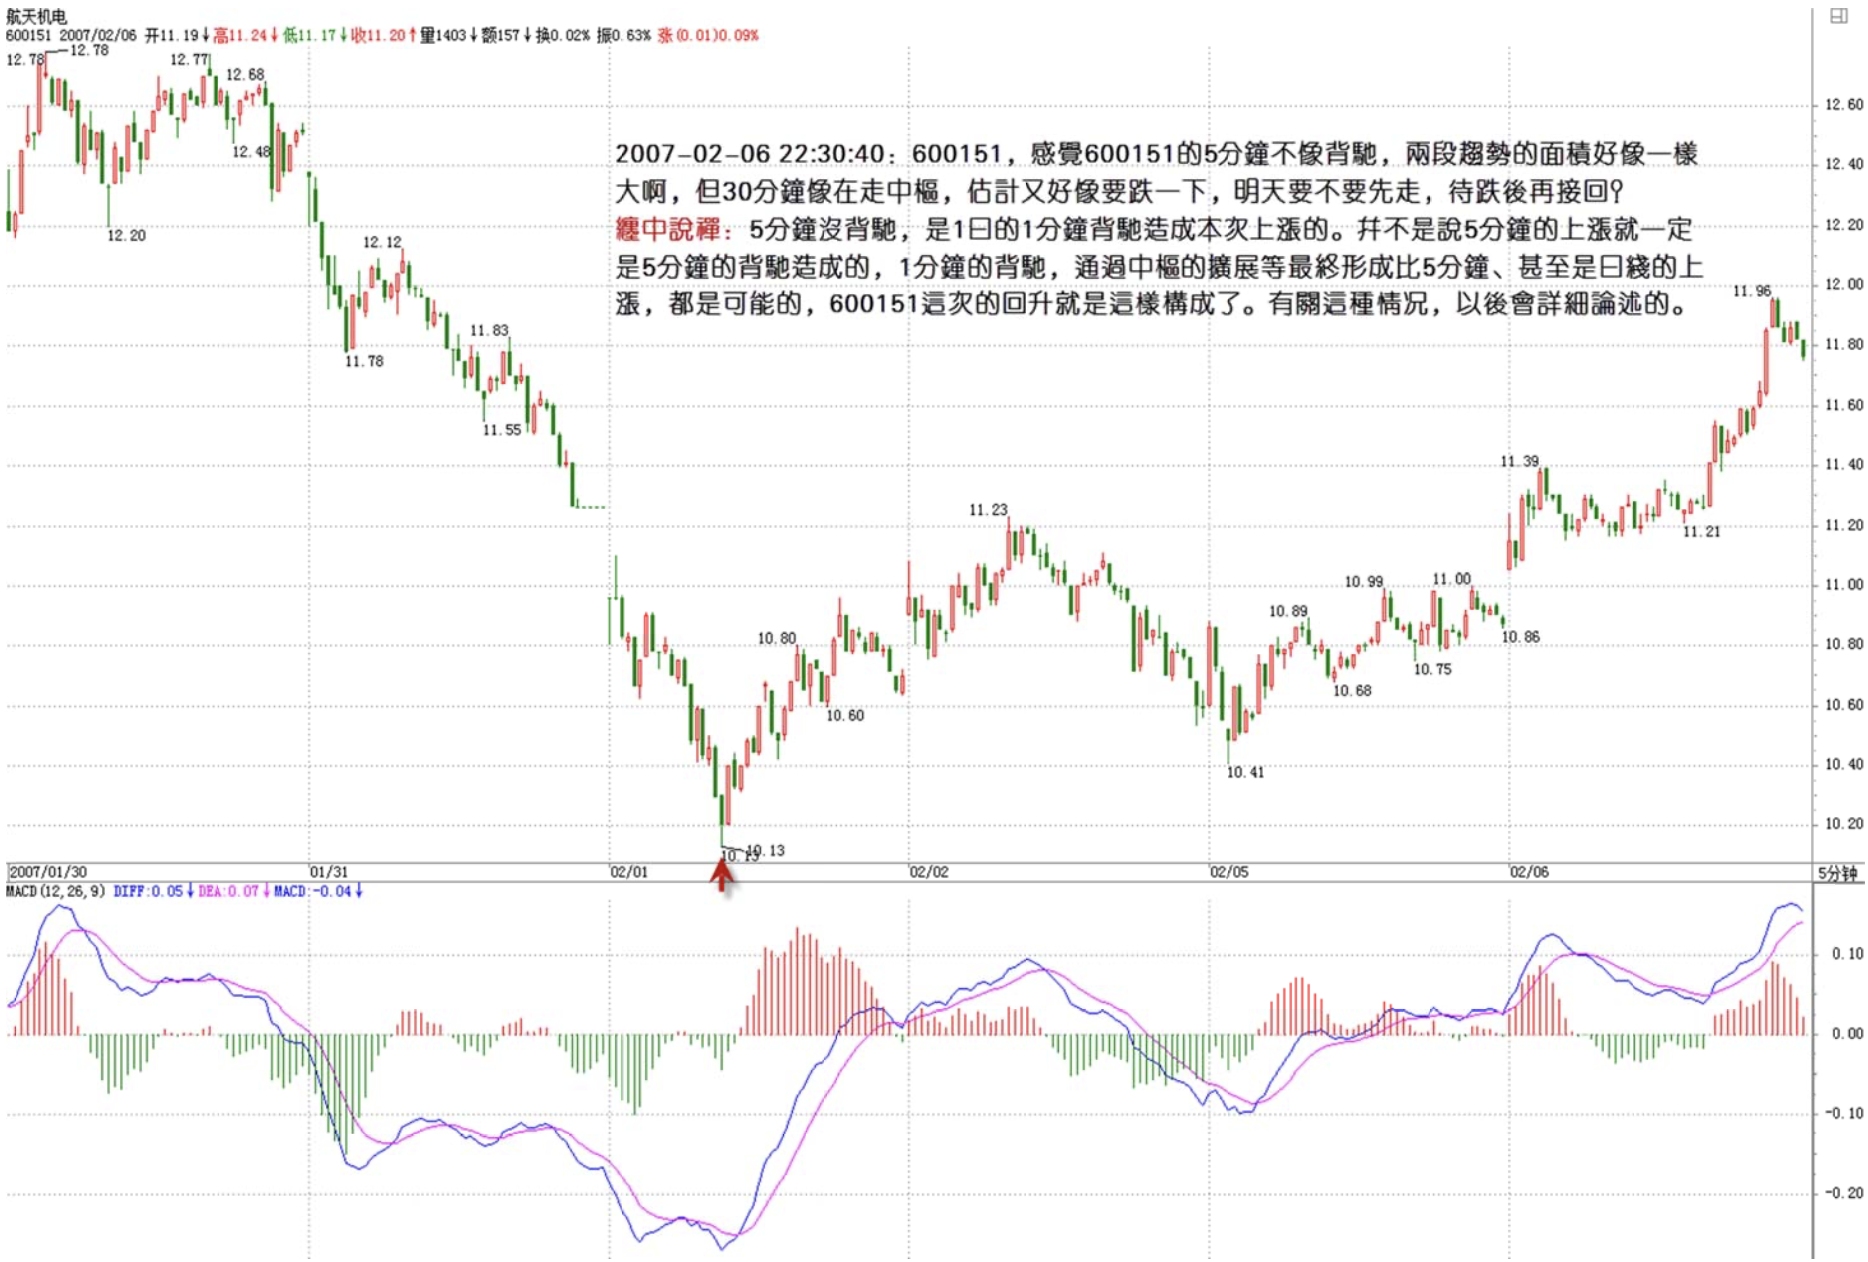
2007-02-06 22:30:40
Chan sister, please look at 600151 — the 5-minute doesn't seem like divergence to me. The areas of the two trend segments seem about the same. But the 30-minute looks like it's forming a hub. I think it might drop a bit more — should I exit tomorrow and buy back after the drop??
==
There's no divergence on the 5-minute. The 1-minute divergence on the 1st is what created this upward move. It's not that a 5-minute up move must have been caused by a 5-minute divergence. A 1-minute divergence, through hub expansion and other mechanisms, can ultimately form movements larger than 5-minute, even daily level. 600151's recovery was constituted this way.
More details on this situation will come in future lessons.
缠中说禅 2007/2/6 22:38:54
[Anonymous] 不在潜水
2007-02-06 22:35:21
Blogger, I have a question.
Premise: A daily hub formed during an upward process
Question: Is it possible that in the No. 3 segment of the 30-minute movement forming the daily hub, no 5-minute divergence forms, but instead a 1-minute divergence creates an upward move, or first forms a consolidation then breaks through upward, thereby ending the No. 3 segment's downward movement? Or must a 5-minute divergence necessarily appear to end this No. 3 segment?
Thank you!!
==
Absolutely possible. A 5-minute divergence creates at least a 5-minute trend type, but it can also create larger levels — this must be achieved through hub expansion. Therefore, a 1-minute divergence can of course form a major top or bottom.
Actually, this has already been discussed. Think about the ICBC and Beichen examples — both are perfect examples of 1-minute top divergence creating major tops. Why? Because subsequent hub expansion occurred progressively.
缠中说禅 2007/2/6 22:43:57
For example, today's 5-minute divergence in the market created a 5-minute three-segment movement — meaning this rebound ends here. Theoretically, this is valid because it already meets the minimum trend type requirement producible by a 5-minute divergence. So what does the continuation of the rebound depend on? It's no longer the power of divergence — it relies on hub extension, expansion, and other mechanisms.
Divergence creates bottoms and first-type buy points. Hub expansion and extension create second and third-type buy points.
These issues are quite complex — there's much more to come in future lessons.
It's late. Signing off. Goodbye.
缠中说禅 2007/2/6 22:46:58
[Anonymous] 中间体
2007-02-06 22:40:44
Chán Zhōng Shuō Chán
2007-02-06 22:26:51
Supplementary point
For example, on the 5-minute chart, from 2051330 onward is the decline from the No. 3 hub. Generally speaking, a decline has at most 3-4 hubs — more than 4 is extremely rare.
At this point, you need to look at the corresponding 1-minute chart from 2051330 onward. The entire decline must have two 1-minute hubs. Obviously, 02051410 to 02051436 is only the No. 1 hub, so the subsequent decline obviously cannot constitute trend divergence. This also proves why this morning's first wave wasn't the bottom.
=====================
But the subsequent decline didn't form a hub either.
==
Today from 951 to 1008, a hub formed on the 1-minute chart — that's the second one. The third segment of this hub was of the very weak type, which is very common in rapid movements. Look at more charts and you'll be able to distinguish them.
It's too late — signing off. Goodbye.
缠中说禅 2007/2/6 15:12:35
Today's movement was absolutely standard and textbook. Anyone with even a slight understanding of this ID's theory could have found this 5-minute divergence bottom without difficulty. The situation is now simple: a 5-minute divergence, with the major resistance at 2720 — this was the previous low. If it can get above, the first segment of the weekly won't evolve into a downtrend, and a weekly hub around 2720 will gradually form. Otherwise, there's the possibility of forming a second hub of the decline below, which would create more pressure. But even so, it would only lead to a larger-level divergence after a 30-minute or 15-minute pullback, and that pullback would be on an even larger scale.
Nothing special to say about individual stocks — the key is trading technique. These past few days, the most extreme among this ID's mentioned stocks were 777 and 999. If your technique allows your 999 profits over these days to not fall too far behind 777's, then your technique has some substance.
After mastering this ID's theory, the distinction between rising and falling will disappear. In your mind, there are only buy points and sell points — no such thing as ups and downs. Reaching this state means you've made initial progress.