3850 Points, a Brutal Low-Volume Battle Between Bulls and Bears
2007/7/11 15:41:38
Since this ID is right in the thick of it, commentary inevitably carries some bias from this side. To be as objective as possible, future commentary will adopt a different phrasing so as not to interfere with retail investors' independent judgment.
As stated yesterday, the real battle is still ahead. Today saw minimal volume, yet it was a brutal low-volume battle between bulls and bears. Most other market participants adopted a wait-and-see attitude, somewhat like an ancient battlefield where the commanders of both armies duel for 300 rounds while tens of thousands of soldiers watch from the sidelines. Once one side takes the other's head, the army behind can charge in for a great victory.
Of course, the stock market is a bit more complex—sometimes the opponent may be a nine-headed hydra, where cutting one head just spawns another, so extreme patience is required. Don't expect to settle things in one blow. Today's minimal volume and extremely narrowed oscillation range merely signal the beginning of a larger-scale offensive and counter-offensive across a wider space.
This is the Battle of Stalingrad for China's capital market—be fully prepared for its brutality.
In the short to medium term, if 3919 points cannot be effectively breached and held, then the bulls' short-to-medium-term strategy has not achieved real victory. In the medium to long term, if the current 1/2 line at 4159 points is not effectively breached and held, the bulls' medium-to-long-term strategy is nothing but fantasy. So for the bulls, victory is still far away and requires redoubled effort. Even with only a 1% chance, one must put in 100% effort.
Nothing much to say about individual stocks, nor is it convenient to say. Some people always complain that this ID speaks in riddles here—that's only natural. This ID must of course operate within the law. Any stocks this ID mentions are merely sleep-talk, because during the day this ID buys them, and what one thinks about during the day appears in dreams at night. Sometimes when trading is hectic, this ID talks in sleep even during the day, so please treat it all as sleep-talk by all means. Be sure to study the charts yourself and operate based on charts—enter at buy points on larger timeframes.
Of course, this ID sometimes likes to show off a bit. For example, this ID bought 000416 around 3 yuan and then talked in sleep about it. Later it rose to 18 yuan—it's only natural for this ID to show off a little. Let me say it again: when this ID talks in sleep, it's always about something just bought. Usually once it's risen, this ID stops the sleep-talk and at most just shows off, like 000999—the sleep-talk was at 6 yuan, everything after that was just showing off. Of course, sleep-talk doesn't always immediately become reality like 000999, 000416, or 000777—sometimes the plot changes a bit in the dream, but dreams always eventually become reality.
Alright, enough idle talk. This ID is in a good mood today. Dinner isn't until later, so I'll answer your questions until 4:30—but only answerable questions. This ID has no hobby of answering spy questions.
Replies
缠中说禅 2007/7/11 15:53:14
Chu Kuangren
2007-07-11 15:49:25
May I ask Master Chan:
Would the 30-minute hub found on a 30-minute chart and the 30-minute hub found on a 1-minute chart have the same starting position?
=
Not necessarily. It's like two microscopes with different magnifications—what you see naturally won't be identical. However, in general cases, there's no substantial difference; it's just a matter of precision.
缠中说禅 2007/7/11 15:59:25
[Anonymous] 在路上
2007-07-11 15:51:23
Sister Chan is in a good mood today, let me hurry up and ask a question:
On any timeframe chart, is it possible to have a top fractal, then a bottom fractal going down, then a few days of consolidation followed by another bottom fractal going further down? Since the chart is viewed in real-time, when the first bottom fractal appears, you don't know what comes next. For example, on the Shanghai Index daily chart, June 20 is a top fractal, and by June 27 it looks like a bottom fractal formed, but then it continued to drop. Same thing after July 2—so did Sister Chan segment it incorrectly? How do we judge in real-time?
Thank you!
=
That means it encompasses several segments, or some segments haven't actually been broken by other segments. Note: a line segment must be broken by another line segment to be confirmed as ended. Of course, one can use methods similar to divergence to pre-confirm a segment's end, but that's not actual confirmation.
缠中说禅 2007/7/11 16:01:45
[Anonymous] 窗外
2007-07-11 15:57:27
Sister Chan, a question about dividing line segments: If a line segment is of a very low level but very long, and on a larger timeframe chart it shows very obvious highs and lows, should we count it as a segment on the larger timeframe? But this contradicts the definition—how should we understand this?
==
No. Follow the definition—whatever it should be, it is. The level of a segment has nothing to do with its amplitude. One can only say that larger levels generally have larger average amplitudes, but for individual cases, this doesn't hold.
缠中说禅 2007/7/11 16:03:41
[Anonymous] 手机用户
2007-07-11 15:59:54
May I ask Teacher Chan: Is the so-called "hub" essentially an oscillation range?
=
"Oscillation range" is a vague and imprecise concept. The biggest difference between this ID's hub and any other hub concept is that this one is a precise concept. Otherwise, even cavemen could draw triangles—why would Euclid need to study anything?
缠中说禅 2007/7/11 16:08:23
[Anonymous] Sina User
2007-07-11 16:06:19
May I ask Sister Chan, besides using MACD to determine divergence, are there any other more rigorous methods?
=
This question has been answered many times. You can use very rigorous mathematical methods to confirm it, but it's too complex and impractical to apply—you'd need to write your own software. MACD is just an auxiliary tool, but used well, it solves 98% of problems and is practical enough.
缠中说禅 2007/7/11 16:10:26
[Anonymous] 海东青
2007-07-11 16:07:40
Sister Chan, you've worked hard. I have a question to ask.
Can it be understood this way: sub-level line segments constitute strokes at this level, and sub-level trend types constitute line segments at this level? The difference is that lower levels have higher precision.
Looking forward to your answer.
=
There's no need to understand it that way. Strokes and segments are defined only for the lowest level. Once you have the lowest level, the recursive definitions of hubs and trend types can rigorously derive all subsequent levels—there's no need to use strokes and segments.
缠中说禅 2007/7/11 16:13:53
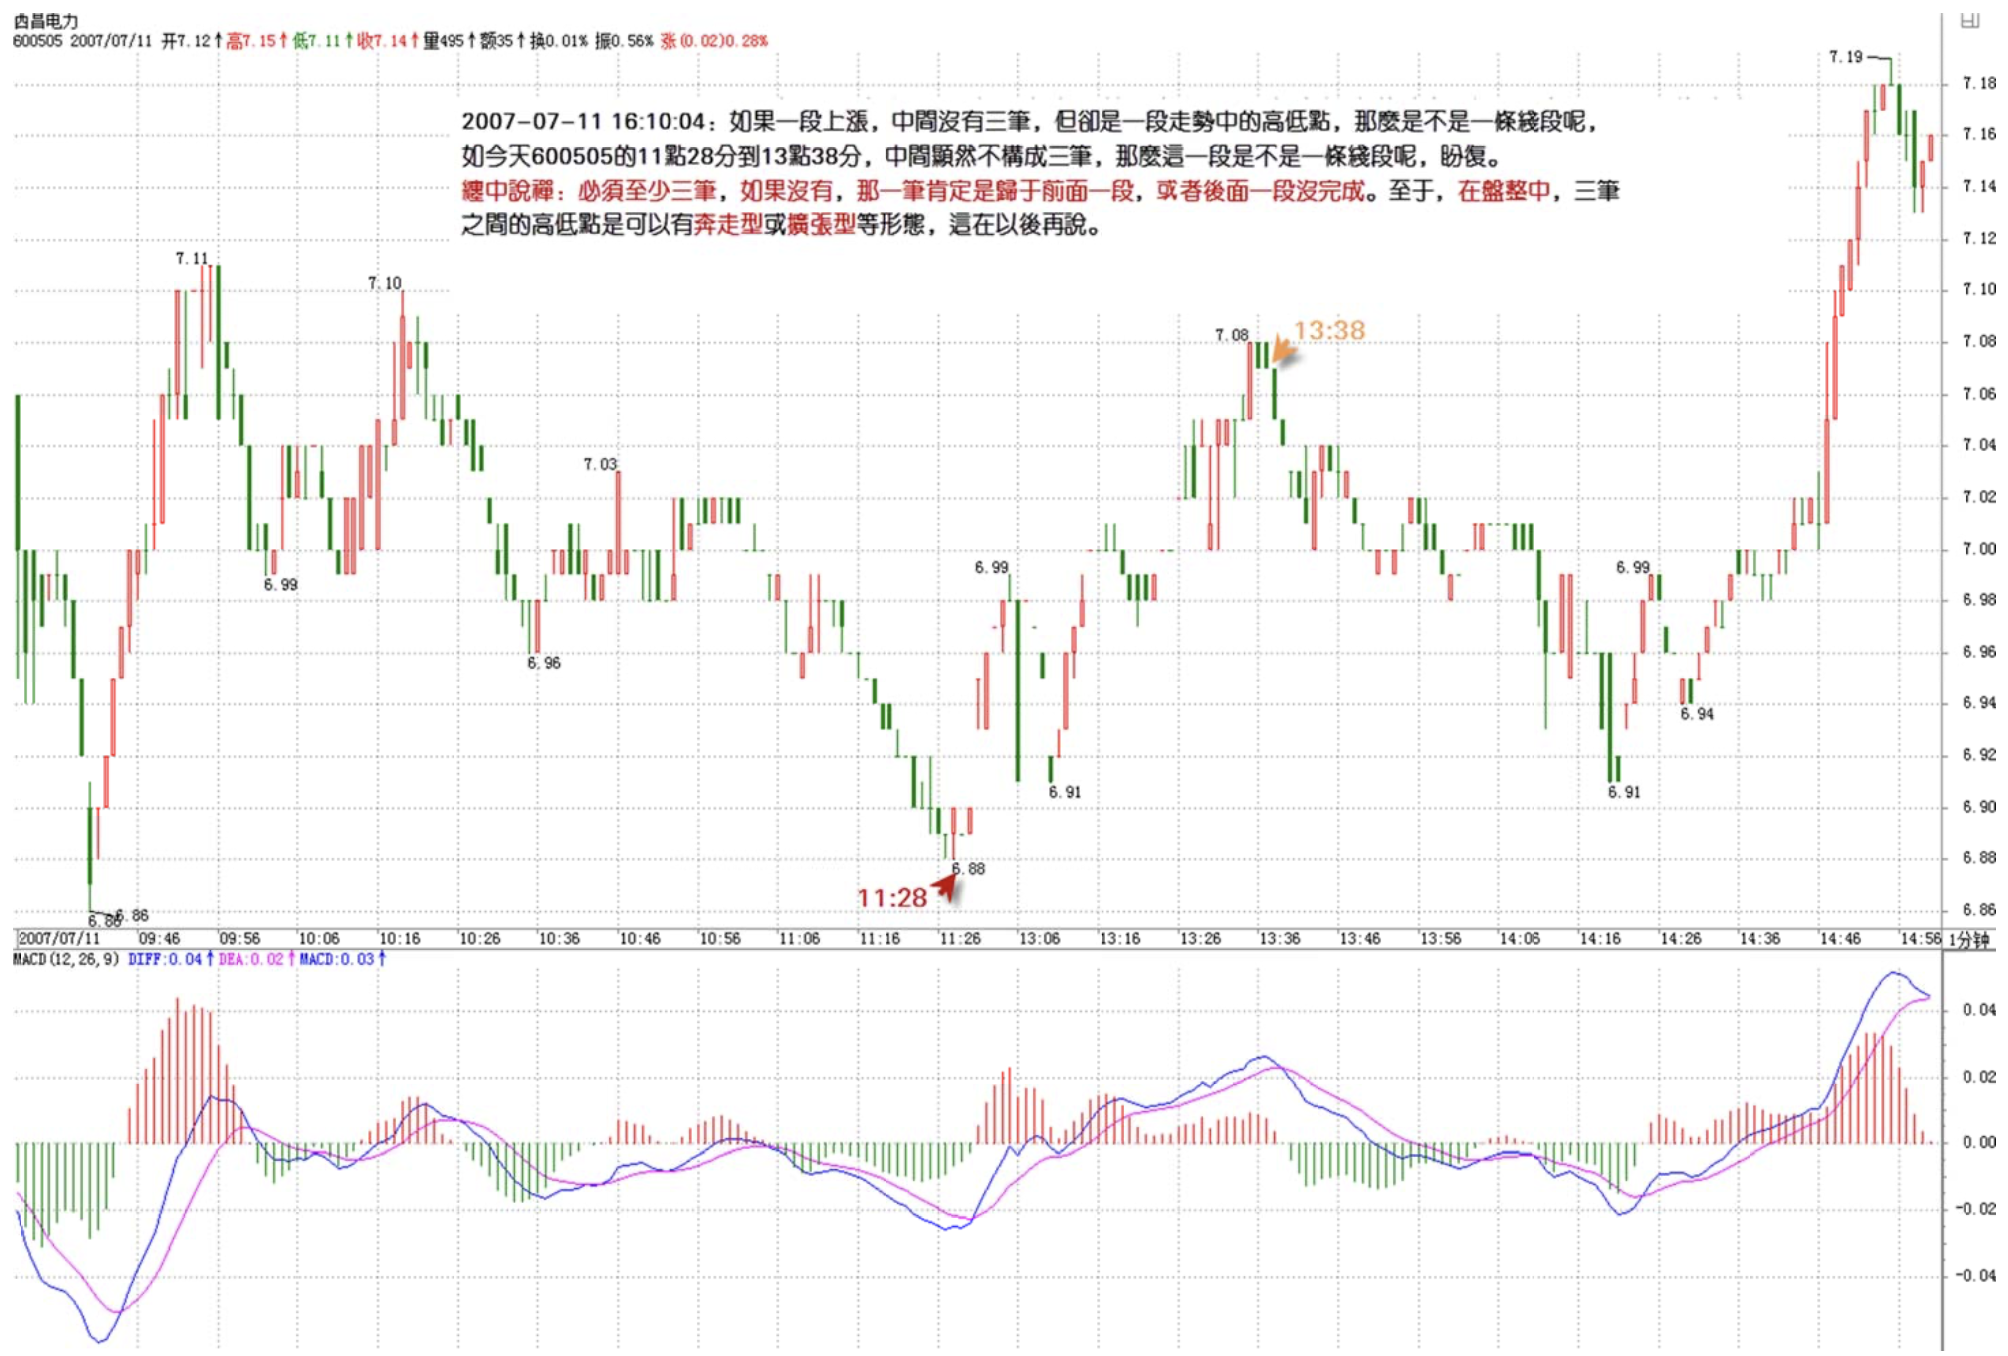
[Anonymous] 求教
2007-07-11 16:10:04
Master, if an up-move doesn't contain three strokes in the middle but shows obvious highs and lows within a trend on a large timeframe, is it still a line segment? For example, on 600505 today from 11:28 to 11:38, the middle clearly doesn't form three strokes—is this section a line segment? Hoping for a reply.
=
There must be at least three strokes. If there aren't, then one stroke definitely belongs to the previous segment, or the following segment hasn't been completed yet. As for fractal patterns where the highs and lows of the three strokes can have running or expanding forms within consolidation—that will be discussed later.
缠中说禅 2007/7/11 16:16:42
[Anonymous] 水房姑娘
2007-07-11 16:11:32
Hi Chan. All kinds of policies seem designed to drain blood from the stock market, so how can the multi-ten-thousand-point great bull market be achieved? Is the management just Ye Gong who loved dragons only in concept?
==
Some things must be done gradually. For the Chinese people, the capital market is something new. Some people react slower and understand slower, which is understandable, and one must have patience for it. Nothing is impossible to change.
缠中说禅 2007/7/11 16:17:56
I Love Ferrari
2007-07-11 16:14:43
Sister Chan hasn't answered my question yet!
=
Sorry, too many questions—I didn't see it. Please post it again.
缠中说禅 2007/7/11 16:22:00
Sorry, too many questions. I can only answer questions related to the theory. Regarding market questions, everything is already stated in the articles. What hasn't been said cannot be said.
缠中说禅 2007/7/11 16:26:35
[Anonymous] Sina User
2007-07-11 16:21:56
Afraid you might not see it, posting again:
Sister, you've worked hard!
I'm studying Chan Theory and have just read up to Lesson 29. Regarding "in the level expansion of the last hub of that trend," it says at the end that this situation is different from the conversion to a third-type buy/sell point in consolidation divergence. In that situation, the level of the rebound is certainly lower than the last hub. But in this situation, the level of the rebound is certainly greater than or equal to the last hub.
-------
I don't understand this. How is the level of the rebound determined? Is it also by looking at what level of hub is contained in the rebound segment?
If so, and if the rebound's level equals or exceeds the last hub's level, wouldn't that mean a new hub has formed below the last hub?
Hope for enlightenment. xiexie
==
It doesn't necessarily form within the range of the last hub. For example, a gap triggered by sudden news can create a new hub far above the last hub. If it's still smaller than the original hub's level, that means the original trend hasn't ended—it's still oscillation within the original hub's hub.
缠中说禅 2007/7/11 16:29:24
The following user comments represent only their personal views and do not represent Sina's views or positions.
[Anonymous] 勇敢的心
2007-07-11 16:21:57
What's the point of Master Chan fighting with the bears? The market PE is already 50x! Are we supposed to push it to 100x? And what happens at 100x? Someone eventually has to foot the bill! If Master Chan can trick foreigners into buying, that counts as success! But if retail investors get trapped at the top, then I can't figure out whether you're the biggest traitor!
=
Is it really 50x PE right now? Moreover, the PE/growth ratio for the vast majority of Chinese stocks is currently less than 1. If we're talking about investment value, Chinese stocks have far greater investment value than those foreign ones. Many of the world's most outstanding companies in the future will emerge from Chinese stocks—so who has the investment value?
缠中说禅 2007/7/11 16:32:08
[Anonymous] Sina User
2007-07-11 16:27:30
Stone Three
2007-07-11 16:24:45
Master, have you left? Posting my question again.
May I ask Master: If two hubs at the 1-minute level undergo level expansion, they form a new 5-minute hub. How is the range of this 5-minute hub determined? Do we need to look at the 5-minute chart?
======
Same question
=
This question was answered long ago—use the combination principle. For example, if you originally have nine segments, combine them into three groups of three. This is all in the lessons—please read carefully.
缠中说禅 2007/7/11 16:33:32
[Anonymous] 弓口虫
2007-07-11 16:26:54
Dear Elder Sister [or Younger Sister]:
After reading Chan Theory, I truly feel it can establish its own school, like the Sword Sect in "The Smiling, Proud Wanderer." Enough preamble—let me ask a small question. For 1-minute trends, each candlestick is the sum of strokes within that minute. Is the 1-minute hub within the minute-level line segments or the Z-shaped minute trend? Actually I feel either way works fine and doesn't hinder judgment—I just want to understand it better.
Many thanks!!!
==
A 1-minute hub is constituted by segments. First clearly divide the segments, then everything after that can be found according to the definitions.
缠中说禅 2007/7/11 16:34:51
I Love Ferrari
2007-07-11 16:26:17
Sister Chan:
I wrote "July 10 Shanghai Index Analysis of Hubs and Divergence Using 30-Minute Charts" on my blog with charts. Please take a look and tell me if it's reasonable!
My blog is: blog-sina-com-cn/ahuge (replace - with dots)
Sister Chan, it's almost 4:30—waiting for your reply!!!
=
Sorry, as stated before, during the battle period this ID cannot comment on segmentation results of actual trends. Once what needs to unfold has unfolded, we can supplement later.
缠中说禅 2007/7/11 16:36:27
[Anonymous] 多来米
2007-07-11 16:29:15
Blogger, you've said that at this level, all sub-level movements are treated as line segments. But sometimes, looking only at the 30-minute chart, what appears to be a line segment with highs and lows might be at the 5-minute level, but could actually be a 1-minute level line segment.
==
Line segments only apply to the lowest level. Treating sub-level movements as line segments is only a metaphor. Strictly speaking, line segments only exist below the lowest level.
缠中说禅 2007/7/11 16:38:05
[Anonymous] 紫衣飘飘
2007-07-11 16:36:24
If in consolidation, that can be viewed as hub oscillation. If it exceeds 9 segments, then according to the combination principle it can be viewed as a hub of a higher level.
[Anonymous] 长江
2007-07-11 16:34:31
Two hubs need line segments to connect them, but what about in consolidation?
==
Without line segments, how can there be hubs? Line segments constitute 1-minute hubs, and that becomes the raw material. Then by definition, larger-level hubs and trend types are built up—the later stages have nothing to do with line segments.
缠中说禅 2007/7/11 16:38:45
[Anonymous] 紫衣飘飘
2007-07-11 16:34:22
Sister, I've posted this N times—can you please answer?
The problem I'm encountering now is that looking at the 1-minute chart of the index feels fairly clear, but when looking at 5-minute and 30-minute charts, I have some doubts about segment division. Also, when looking at individual stock charts, it doesn't feel as clear because individual stocks have more overlapping upper and lower shadows.
Sister Chan, could you answer—how can one divide segments more clearly on 5-minute, 30-minute, and individual stock charts?
==
Please recall the microscope analogy.
缠中说禅 2007/7/11 16:40:52
[Anonymous] 大道
2007-07-11 16:36:30
During the battle, does Chan still watch football? Are you optimistic about the Chinese national team?
=
Sorry, this ID doesn't want to waste time.
缠中说禅 2007/7/11 16:45:32
Sorry, this ID must head out now. Beijing traffic is terrible—must leave early or I'll miss my engagement.
Questions will be answered when there's time later. Goodbye.
缠中说禅 2007/7/11 15:47:57
[Anonymous] 50年以前
2007-07-11 15:43:19
Right now bearish news is flying everywhere. Interest rate hikes, abolishing the interest tax, new stock subscription rules, etc.—could it be too scary?!
=
News follows the trend. When bears are in control, of course bearish news fills the sky. When it's the bulls' turn to be in control, you'll hear whatever bullish news you want.