Teaching You to Trade Stocks 19: The Key to Learning Chan Theory Technical Analysis
2006/12/27 15:18:10
This ID has looked at everyone's questions and discovered that despite saying so much already, it seems very few people can truly understand. Why? Very simple — I estimate that people coming here have never undergone rigorous mathematical training. If you had rigorous mathematical training, what this ID is discussing now would be the simplest things imaginable. The entire derivation process here is no different from geometry — anyone who studied geometry in middle school should be able to understand. So to comprehend this, you'd best activate your mathematical neurons first. Here's a somewhat unpleasant truth: liberal arts types like Confucius-man are fundamentally ill-suited to trading stocks. Forget about ordinary retail investors — even among market makers, and this ID has certainly seen more market makers than anyone else in the country, there's a very obvious pattern: liberal arts graduates who become market makers basically end up dead. This is no joke — it's a direct summary of experience. The biggest characteristic of liberal arts types like Confucius-man is that their brains are missing a nerve — the nerve for mathematical thinking.
Secondly, please set aside all the technical analysis methods you've previously learned, because what this ID is discussing here has a fundamentally different approach from all existing technical analysis methods. Typical technical analysis methods use various indicators, or some fabricated waves, bands, or even Gann Theory, neural networks, and so on — all of which depart from mysterious a priori premises. For example, the nonsense in Elliott Wave Theory about impulse waves having 5 waves and corrective waves having 3 waves — seemingly plausible but actually useless in real trading, especially for individual stocks. As for Gann Theory, cycle theory, neural networks, and the like — they all treat probabilistic things as certainties, sounding impeccable in theory but riddled with errors in practice. Those support levels, resistance levels, channel lines, third waves, and similar toys can only serve as good tools for market makers to create fake signals.
If you truly understand this ID's theory, you'll discover that all phenomena described in other technical analysis systems can be explained within this ID's theory, and the corresponding boundaries for their validity can also be provided. For example, when a newly listed stock drops directly in 5 waves then immediately reverses upward in 5 waves forming a V-shape, Elliott Wave Theory cannot explain this, but using the Chan Theory trend hub theorems, this is a very easy problem to resolve. Those theories all standardize complex trends into certain fixed patterns, as ridiculous as a gigolo claiming that love without a condom isn't love. For market makers, they've long since studied so-called technical analysis theories more thoroughly than anyone — anyone who's ever manipulated a stock knows that technical chart patterns are used to deceive people, and the more classic the pattern, the more deceptive it is. But no market maker can escape the most fundamental things this ID discusses in the analysis, because these things are essentially "invariant" to the market — anything in the market must necessarily conform to them, and market makers are no exception. Just as any great savior cannot escape birth, aging, sickness, and death.
Here it must be emphasized that the technical analysis system is only one of three independent systems in this ID's theory, and the most fundamental thing is the mathematical systemic effectiveness guaranteed by the probability principles upon which these three independent systems are based. But the reason the technical analysis system is important is that for a retail investor with absolutely no insider information, this is the fairest, most easily obtainable information. Technical trends are completely public — for anyone, they are first-hand and most direct. There are no secrets, no advantages of timing to speak of here. The greatness of technical analysis lies in using this most direct, most public data to derive a reliable basis for operations. Through mastery of technical analysis alone combined with reasonable application of capital management, one can completely and effectively beat the market over the long term. For ordinary investors, if you wish to genuinely participate in the market, this is the most reliable foundation.
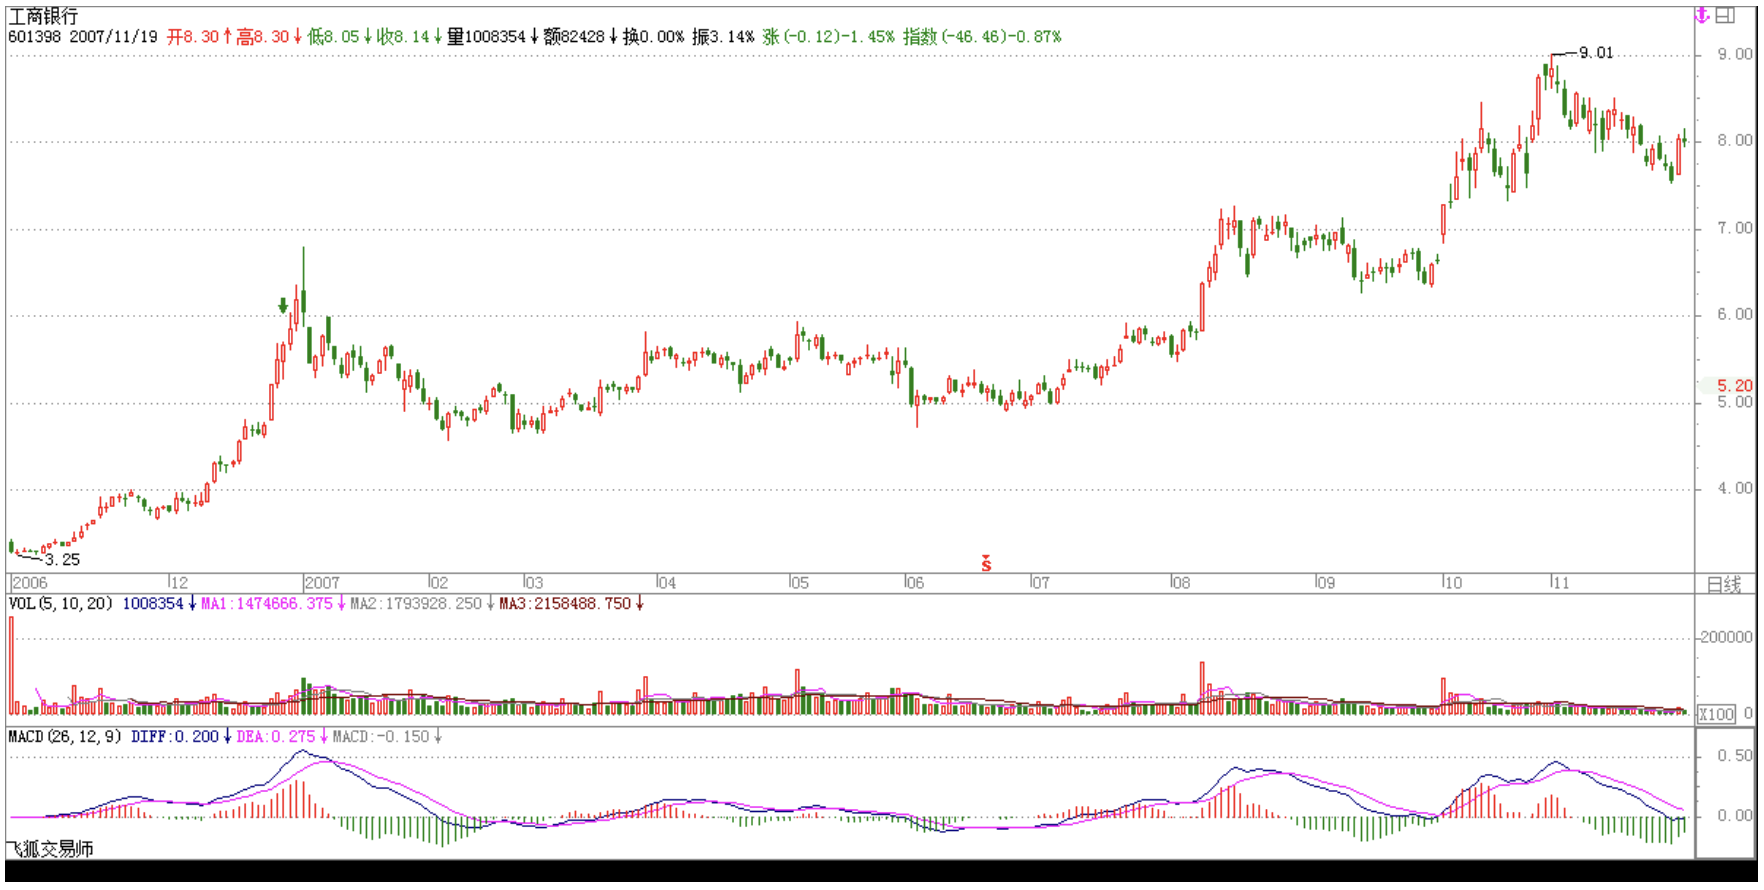
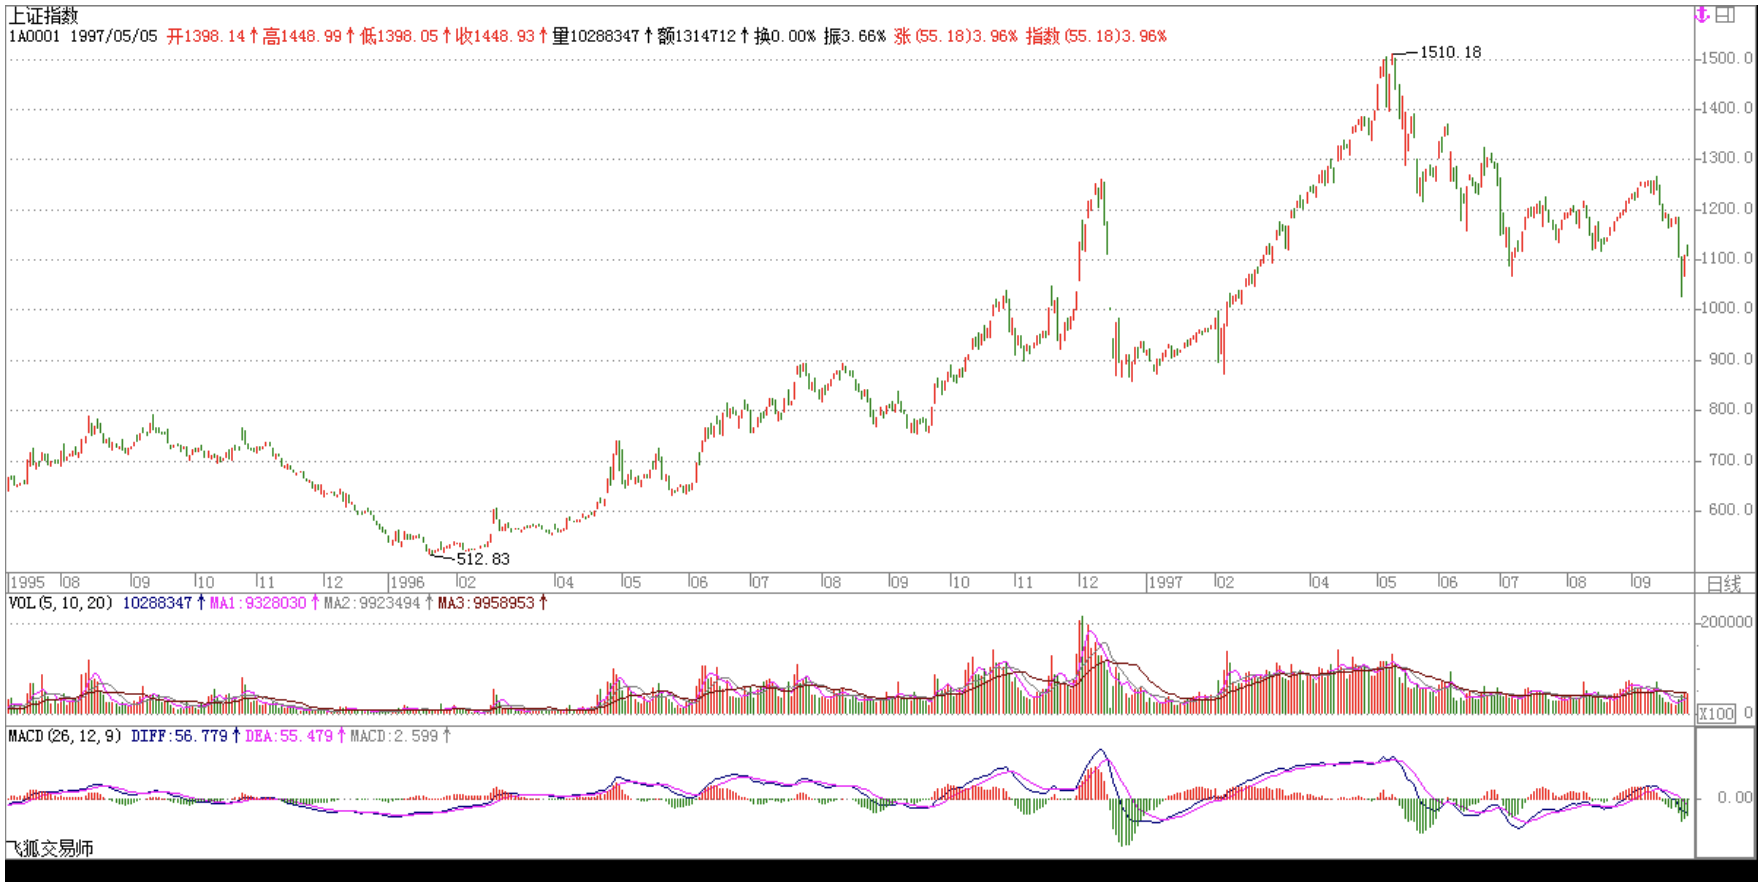
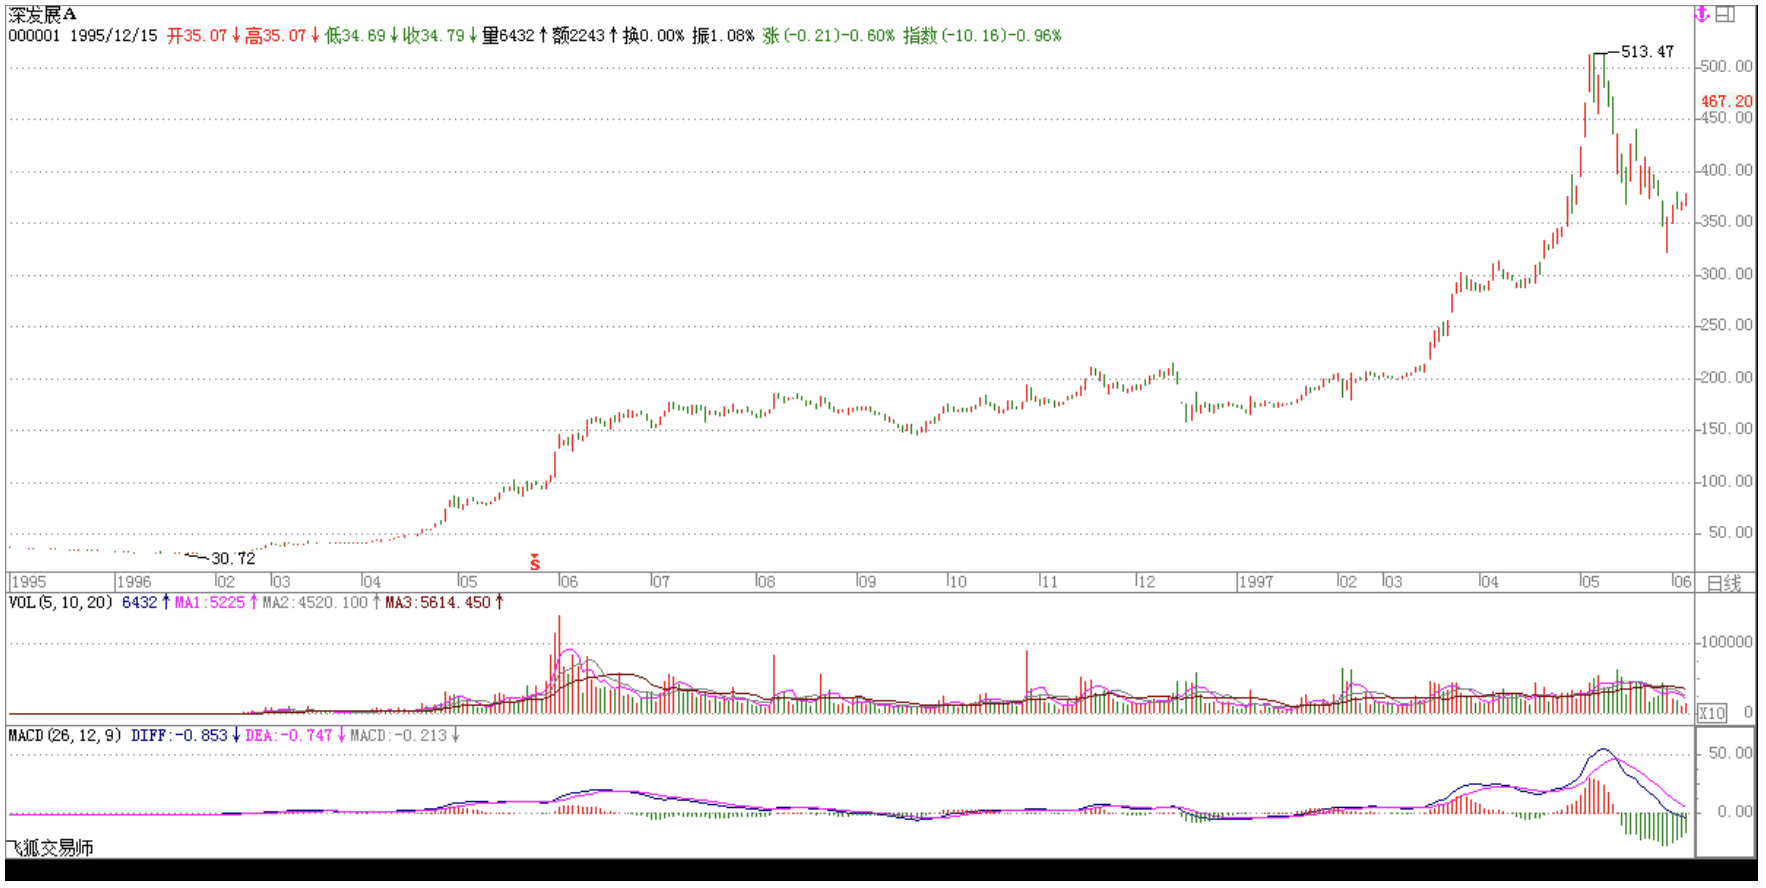
This ID believes that if you only want to make a bit of money, there's no need to learn any technical analysis — in a bull market, just buy funds, especially index-linked funds, and you'll at least keep up with the index's gains. But the market doesn't exist solely for making money — the market is the best place to cultivate oneself. Where are human greed, fear, and stupidity most abundant? In capital markets, they are dramatized every moment. Cultivating oneself in this great dye vat — that is the market's greatest benefit. Conquering the market is essentially conquering your own greed, fear, and stupidity. This ID's theory merely strips the market bare for everyone to see, but stripping someone bare doesn't mean conquering them — for the market, the principle is the same. Without action, it's impossible to conquer the market. For the market, action is everything. The ultimate significance of technical analysis is not to predict what the market will do, but what the market is currently doing — it is a direct intuition of the present moment. All errors in the market come from departing from this present-moment direct intuition, substituting imagination and emotion instead. For example, right now, how many people are still indignant about ICBC's rise, yet cannot accept this most directly intuitive fact of the present? It has been repeatedly emphasized many times: the first wave of a bull market is always about constituent stocks. If ICBC, the largest constituent stock, doesn't rise, who else would? The bull market of 1996 — the largest constituent stock then was Shenzhen Development Bank, and things were far more dramatic then. What does ICBC's current move even amount to?
The market has patterns, but the market's patterns are not self-evident — they require rigorous analysis to uncover. More importantly, the market's patterns are dynamic, manifested under the combined forces of different levels. Attempting to predict and grasp them with simple indicators, bands, waves, fractals, cycles, and the like can only produce errors galore. But as long as you grasp these dynamic patterns well in the direct intuition of the present moment and apply them proficiently, keeping in step with the market's rhythm is not impossible. Finally, here's a homework assignment: In so-called Elliott Wave Theory, there's a conclusion that roughly states that the fourth wave correction generally stays within the range of the fourth sub-wave of the third wave. Use the relevant theorems of Chan Theory trend hubs to analyze the scope and limitations of this conclusion's validity, and correspondingly provide a more reasonable theoretical analysis and practical operating guidelines for similar trends.
Replies
缠中说禅 2006/12/27 15:29:37
Trading stocks in such a great bull market is the simplest thing. There are only 300 constituent stocks. If that seems like too many, just look at the Shanghai 50. The first round is all about repeatedly rotating through these few dozen stocks, churning them over and over. The second round involves growth stocks, but that's a matter for later. The key is to eliminate all bearish mentality — this has been said many times before and won't be repeated again.
缠中说禅 2006/12/27 15:32:13
[Anonymous] iris
2006-12-27 15:28:58
Among the constituent stocks, the ones that haven't moved yet should be hard to find now. I'll have to look one by one. Miss Chan is always so punctual every day — truly admirable.
=======
Who told you to only start looking now? Looking now, the risk is much greater. This was said first thing in the morning — hold constituent stocks, study technical analysis well, and you won't miss either side. The first round of a bull market is the most relaxed — you basically don't need to strain your brain picking stocks. The second and third rounds will be a bit more tiring.
If you don't understand, go look at Shenzhen Development Bank's trends in 1996-97.
缠中说禅 2006/12/27 15:33:50
[Anonymous] cc
2006-12-27 15:31:20
MM, in the first phase, does the market always rally in banking and real estate first after every adjustment?
==
Constituent stocks — what would you classify China Unicom as? But banking stocks definitely have a place, because they carry the largest weight.
缠中说禅 2006/12/27 15:40:50
[Anonymous] 欲哭无泪
2006-12-27 15:31:05
Blogger: Please take a look at Furi Corporation. That's my entire fortune — hard-earned blood and sweat money!
Now I'm trapped, I could practically kill myself! What should I do?!
Could you make an exception just this once and tell me what to do?! Thank you.
=======
For newly listed stocks, this has been said before — if the first-day high doesn't break through on volume, don't even look at it, unless a first-type buy point appears below. The advantage of this approach is that you don't waste time. Now that this stock has ended up like this, just wait — after all, it's not far from the box top.
Let me say it again: a true expert follows the simplest direction of the market. What has been said before? You must always stay close to the main forces and not mess around with scattered stragglers — those people can barely protect themselves, so what's the point of playing with them? In the first phase of a bull market, big money is busy working constituent stocks. Those managing these small-cap things are small fry. Just wait — ultimately everything will rise.
缠中说禅 2006/12/27 15:44:03
[Anonymous] 去
2006-12-27 15:30:18
Blogger, even if you had a few more brain folds, you still can't escape birth, aging, sickness, and death — that's my conclusion about you. The same goes for your career!
===
The one who goes through birth, aging, sickness, and death is you, but has it ever truly been you? Stop suffocating yourself.
缠中说禅 2006/12/27 15:44:27
Nothing more to do, signing off for now. See you later.
缠中说禅 2006/12/27 20:55:17
wy1499
2006-12-27 16:20:50
Blogger, 1. "Chán Zhōng Shuō Chán Trend Hub Theorem 1": Within a trend, what connects two same-level "Chán Zhōng Shuō Chán trend hubs" must necessarily be a trend type of sub-level or lower.
I now think: after a consolidation hub ends, could it be directly followed by the first trend hub of a trend? A strong market maker might use this pattern for a final shakeout — I just don't know how to logically prove it.
====
This issue will be discussed later. The key is that the two hubs before and after cannot overlap, otherwise they merely form a larger-level consolidation.
- Also, in Chán Zhōng Shuō Chán Trend Hub Theorem 3, the combination of two sub-level trend types has only three kinds: trend + consolidation, trend + counter-trend, consolidation + counter-trend. I find this third combination hard to understand. A trend hub itself is a consolidation pattern — if it's immediately followed by consolidation, how do you distinguish whether that consolidation belongs to the preceding trend hub? Furthermore, assuming the proposition is correct, why can only a counter-trend follow consolidation, and not a trend? Ending the previous trend hub, then continuing the trend after consolidation — isn't that perfectly normal? Awaiting enlightenment!
===
The trend in "trend + consolidation" and the consolidation's price hub are of different levels — the latter is higher. You cannot discuss hubs in isolation; you must combine them with levels.
Pay attention to the premise of this discussion — we're talking about the departure from and return to the hub. If leaving the hub with a sub-level consolidation type, the return obviously cannot also be a consolidation type, otherwise it would form a larger-level consolidation type, which contradicts the premise that the original hub is being maintained.
For movement around the hub, the trend departing the hub is the positive trend, and the returning one is the counter-trend.
缠中说禅 2006/12/27 21:00:15
[Anonymous] 空读
2006-12-27 20:43:28
The first-type buy points and first-type sell points that Chán discusses are both formed by divergence.
When a trend ends and reverses, must divergence necessarily appear?
Rising momentum weakens, forming divergence; after a decline, a bounce forms divergence.
If you wait for divergence but it never comes, and after a decline you wait for a bounce, you could end up with massive losses and get trapped.
The formation of divergence should mean that this wave's rise/decline magnitude and speed are weaker than the previous wave's.
Can we determine from this that the next stage's trend will end?
Divergence followed by more divergence is not uncommon either — isn't there some success rate that generalizes most market situations?
===
Why wait for a decline before bouncing? Selling should always be done during rises. Once a divergent rise appears, you should sell — of course, this depends on the level you're operating at. If you're a long-term holder, you naturally don't need to worry about divergence on a 1-minute chart.
Selling during declines is always a flawed behavior.
Divergence can only occur once — how could it happen again and again? What you think are repeated instances are fundamentally not what this ID calls divergence. Note: divergence is produced by comparing two same-level trends. First get clear on what divergence actually is.
缠中说禅 2006/12/27 21:02:30
[Anonymous] iris
2006-12-27 18:08:13
我发现我越看越不太明白了,请问禅姐,是不是一个走势中枢中并不是所有k线都要在这个股价范围内。像580991的11.8到11.28日走势中枢中(0.677,0.803),11月15号的k线就没在这个范围,11月17到11月27日的最低价都比0.677高。请缠姐指教。
实在不好意思啊,遇到我这样的新手加笨学生。
==
Of course not all K-lines are within it — otherwise how would we discuss the theorems about departing from and returning to the hub? If all were within it, where would there be any departure or return?
缠中说禅 2006/12/27 21:05:20
[Anonymous] 空读
2006-12-27 20:21:58
Consolidation at this level forms a hub one level higher.
"Chán Zhōng Shuō Chán Trend Decomposition Theorem 1": Any movement at any level can be decomposed into connections of three same-level trend types: "consolidation," "decline," and "rise."
"Chán Zhōng Shuō Chán Technical Analysis Fundamental Principle 2": Any completed trend type at any level must contain one or more Chán Zhōng Shuō Chán trend hubs.
"Chán Zhōng Shuō Chán Trend Decomposition Theorem 2": Any trend type at any level consists of at least three or more sub-level trend types.
Here's an extreme case: some stocks hit limit-up with a flat bar every day, the daily chart looks like a stairway to heaven. If one day it goes from limit-up to limit-down, the daily chart becomes a stairway to hell. ST and PT stocks often have this kind of movement. This kind of rise/decline can't be decomposed into three sub-level trend segments, and there would be no trend hub, right?
===
Of course there is. How is the lowest-level hub defined? Don't remember? A straight-line bar constitutes the lowest-level price hub. First get clear on the definition of a hub.
缠中说禅 2006/12/27 21:12:37
[Anonymous] 空读
2006-12-27 21:04:39
How are levels defined? What's the difference between two levels? Monthly vs. weekly is a 4x difference, weekly vs. daily is 5x,
daily vs. 60-minute is 4x, daily vs. 30-minute is 8x.
What should the next level below daily be based on? And what about the level after that?
===
Generally, using 5-minute, 30-minute, daily, weekly, and monthly is sufficient.
A stock's movement: if it's not going up, it's going down, or else it's consolidating.
What's the boundary between rising, consolidating, and falling? How much must the rise exceed the consolidation range to count as rising, and how much must the fall exceed it to count as falling? On a 1-second tick chart it's easy to determine:
same price is sideways consolidation, up one cent is rising, down one cent is falling. But looking at 1-minute and above, rising vs. consolidation trends are hard to determine before they play out. Breaking out of the consolidation range then returning —
triangle consolidations are always hard to distinguish.
I still can't determine what the current state is — trend or consolidation.
===
You haven't even figured out what "rising" and "falling" mean. First review the relevant definitions from earlier.
缠中说禅 2006/12/27 21:16:25
[Anonymous] 狐
2006-12-27 20:25:37
Miss Chan, may I ask a question? You said America's power was built through action, not through morality.
My friend A and friend B and I are good friends. A broke up with his girlfriend, and B immediately got together with A's ex-girlfriend. Is B moral? Do we need to analyze B's actions from another angle to find him in the right?
===
First, don't treat anyone as your private property. People have never even truly possessed themselves — what else could they possibly possess? Remove this premise and all problems become false problems.
缠中说禅 2006/12/27 21:19:29
[Anonymous] 花蝴蝶
2006-12-27 21:13:33
I have a question for Miss Chan:
Chán Zhōng Shuō Chán Trend Hub: the portion of a certain level's trend type that is overlapped by at least three consecutive sub-level trend types.
- Is it three consecutive trend types within the sub-level, or three consecutive trend types of the sub-level?
- Could you explain "overlap" more vividly?
I'm rather slow-witted and find it very difficult to understand. I hope Miss Chan can patiently instruct me.
Thank you so much!!!
===
Look at the formula in Lesson 18 — the most precise mathematical formula, and it'll be immediately clear. What does "连续次级别" even mean? Is there such an expression in Chinese?
三个/连续/次级别走势类型 (three / consecutive / sub-level trend types)
缠中说禅 2006/12/27 21:23:01
Too late now, signing off. See you later.
缠中说禅 2006/12/27 15:25:27
There's nothing to say about the broader market. As for stock selection — even less needs to be said. It's constituent stocks — those that haven't moved yet will all move. This has been said countless times, and won't be repeated again.