Teaching You to Trade Stocks 24: MACD as an Auxiliary Tool for Divergence Judgment
2007/1/18 15:02:43
This chapter was entirely unplanned — the issue has actually been discussed before, and this is somewhat reheating leftovers. But I've discovered that the vast majority of people here still can't figure it out, so it's worth explaining again with some examples. To fully resolve the divergence problem, further analysis of hubs is required — that's for future chapters. But everyone seems eager to use it now, and regarding hubs, few seem to truly understand. Going deeper when the shallow part is already a mess won't work. Therefore, let me explain in detail the method of using MACD as an auxiliary tool for divergence judgment — a method that's not absolutely precise but is more convenient and easier to understand. For those who haven't yet grasped the basic analysis of hubs, this will be helpful. In other words, if you truly can't figure out the hub problem for now, using this method alone is sufficient to handle most situations.
First, divergence also has the issue of levels. A 1-minute level divergence, in the vast majority of cases, won't create a weekly-level major top — unless the daily chart simultaneously shows divergence. But once divergence appears, there must be a reversal — there's absolutely no room for negotiation on this. Someone might ask: how much exactly does it reverse? Very simple — until a new sub-level buy/sell point reappears. Since all buy/sell points can ultimately be traced back to some level's first-type buy/sell point, and divergence is closely related to this type of buy/sell point, it can be stated that any reversal necessarily contains divergence at some level. Later, using rigorous methods, the following theorem can be proven:
Chan Theory Divergence-Buy/Sell Point Theorem: Any divergence necessarily creates a buy/sell point at some level; any level's buy/sell point necessarily originates from divergence in some level's trend.
The proof of this theorem won't be given here for now. In other words, as long as you see divergence at some level, it necessarily means a reversal is coming. But reversal doesn't mean forever — for example, divergence upward on the daily chart creates a sell point. After the pullback, divergence downward on the 5-minute or 30-minute chart creates a buy point. From that buy point, the price can resume rising, even making new highs — this is a perfectly normal situation.
To use MACD for judging divergence, there must first be two segments of same-direction trends. Between same-direction trends, there's necessarily a consolidation or counter-trend connecting them. Call these three segments A, B, and C respectively. Obviously, B's hub level is larger than the hub levels within both A and C — otherwise A, B, and C would merge into one large trend or one large hub. Before segment A, there must be a hub of the same level as B or larger, and it cannot be a trend in the opposite direction from A — otherwise these three segments would be contained within a larger hub.
Summarizing the above, the prerequisite for using MACD to judge divergence is that segments A, B, and C are within a larger trend, where there's already a hub before A, and B is another hub of this larger trend. This hub generally pulls the MACD yellow and white lines (that is, DIFF and DEA) back to near the 0 axis. When the trend type of segment C completes, if the corresponding MACD histogram area (look at red bars for upward, green bars for downward) is smaller than segment A's corresponding area, this constitutes standard divergence.
I suspect some people lack even the most basic knowledge of MACD, so let me say a few words. First, you need to open a chart with the MACD indicator (please don't ask this ID how to get an MACD chart — this ID will completely collapse). On the MACD, there are yellow and white lines, and also red and green bars. The straight line at the boundary between red and green bars is the 0 axis. The colors mentioned above are the usual system defaults. If your system uses different colors, then this ID can only say the two curves that weave back and forth are the yellow and white lines, and the bars that sometimes point up and sometimes down are the red and green bars. This ID can only describe to this level. If you still don't understand, go to any securities office with a sign that says "Which is the yellow and white lines, which are the red and green bars" — you'll probably get an answer.
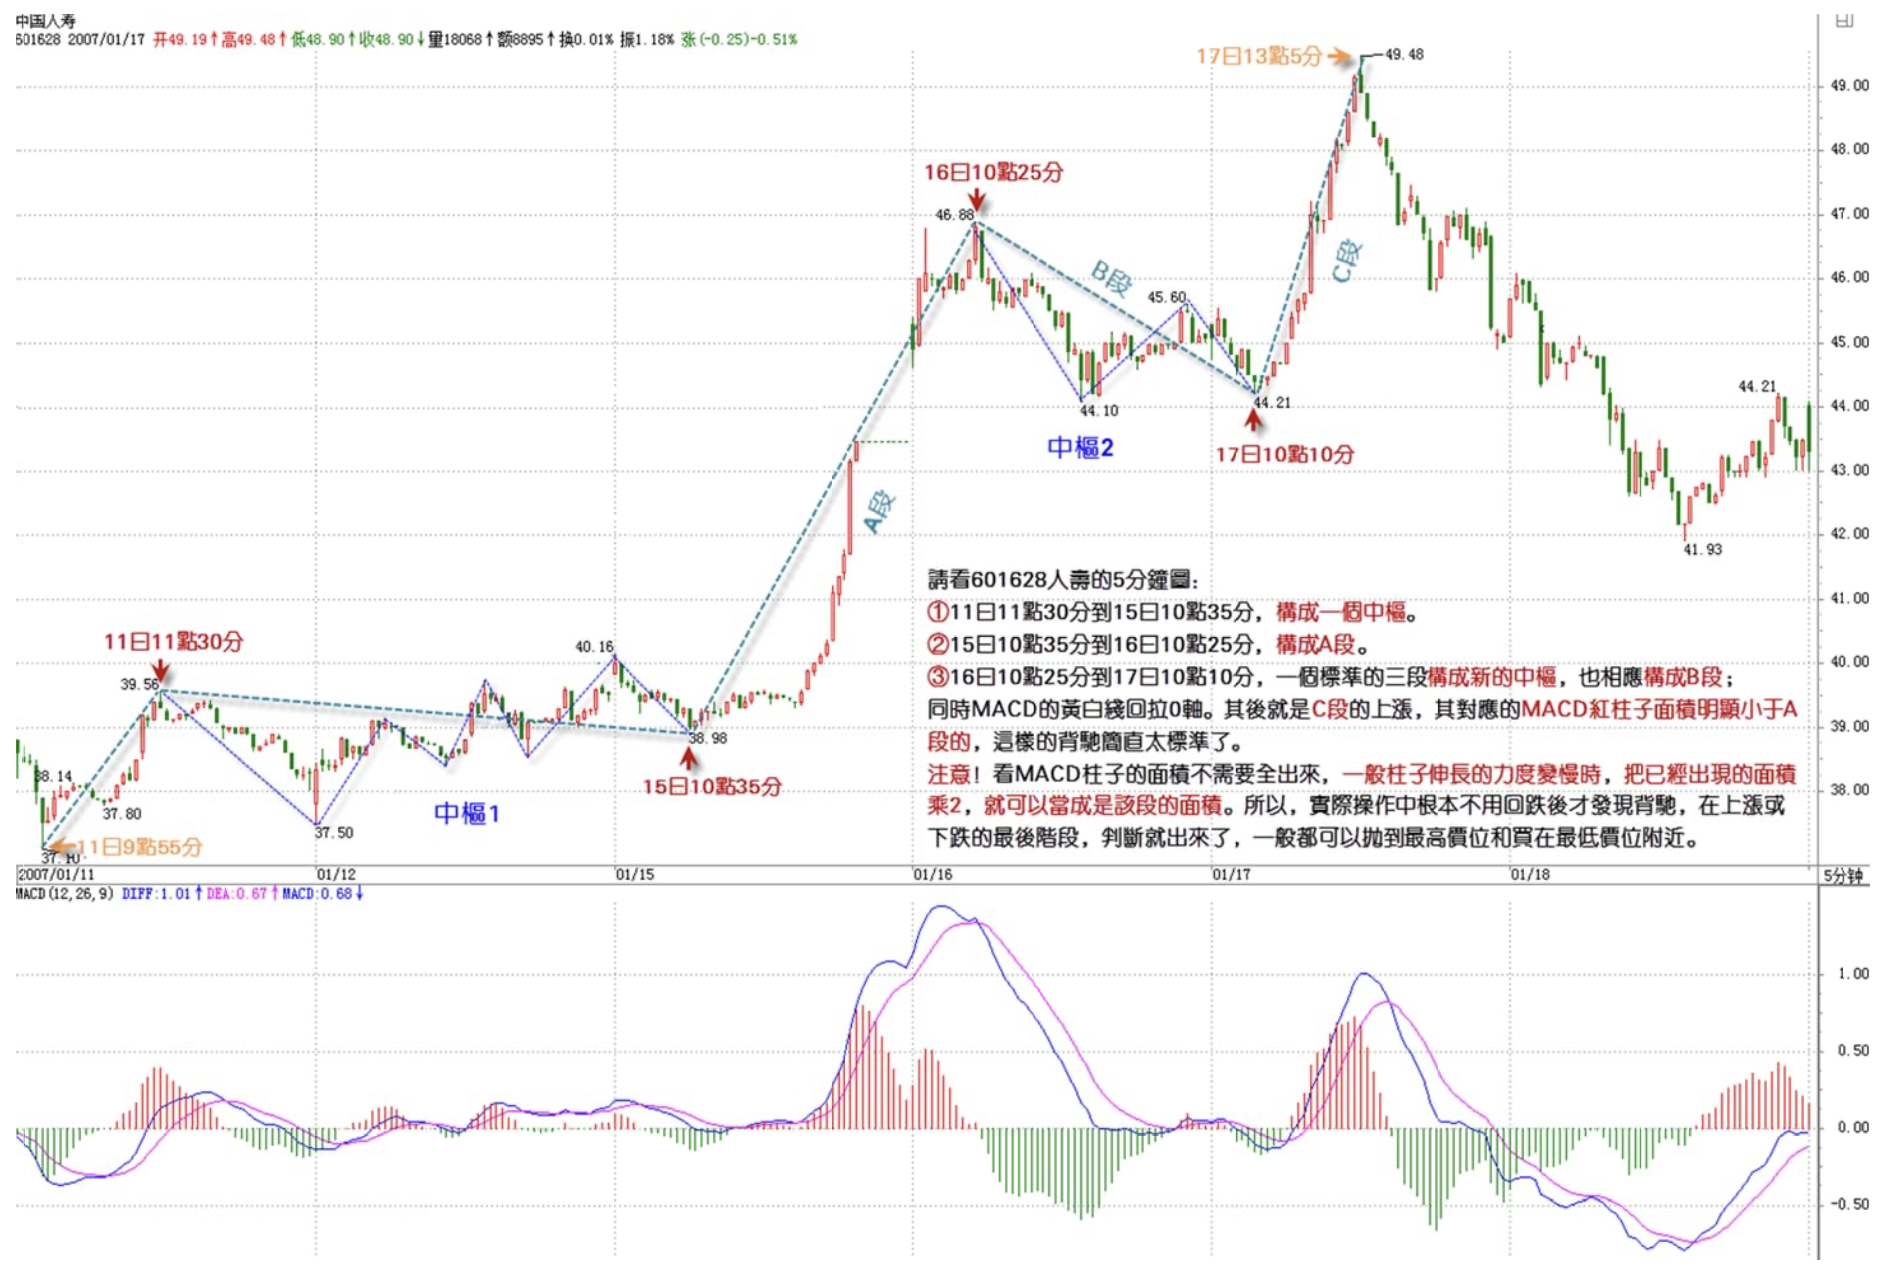
This sounds a bit abstract, so let's use an example. Please look at China Life Insurance (601628) on the 5-minute chart: from 11:30 on the 11th to 10:35 on the 15th forms a hub. 10:35 on the 15th to 10:25 on the 16th constitutes segment A. 10:25 on the 16th to 10:10 on the 17th — a standard three-segment formation creates a new hub, also forming segment B, and simultaneously MACD's yellow and white lines pull back to the 0 axis. What follows is segment C's rise, whose corresponding MACD red bar area is obviously smaller than segment A's — this divergence is about as textbook as it gets. Note: when looking at MACD bar area, you don't need to wait for all of it to appear. Generally, when the bar extension momentum slows, multiply the already-appeared area by 2, and that can serve as the segment's area. So in actual trading, you absolutely don't need to wait for the pullback to discover divergence. In the final stages of a rise or fall, the judgment is already available — generally you can sell near the highest price and buy near the lowest price.
China Life Insurance (601628)
The above is the most standard method of judging divergence. So, is divergence useful in consolidation? First, for clarity: unless specifically stated otherwise, "divergence" always refers to the most standard divergence formed within trends. But in consolidation, using a similar divergence judgment method can also produce very good results. This application of similar divergence methods in consolidation is called consolidation divergence judgment.
Taking the case of upward movement in consolidation as an example (the downward case is the reverse): if segment C doesn't break the hub, once the MACD bar area of segment C is smaller than segment A's, a pullback must follow. More complex is if segment C breaks above the hub, but the MACD bar area is still smaller than segment A's. The principle here is to exit first. What follows has two scenarios: if the pullback doesn't fall back in, buy back at the sub-level first-type buy point — this actually constitutes that level's third-type buy point; otherwise, the consolidation continues.
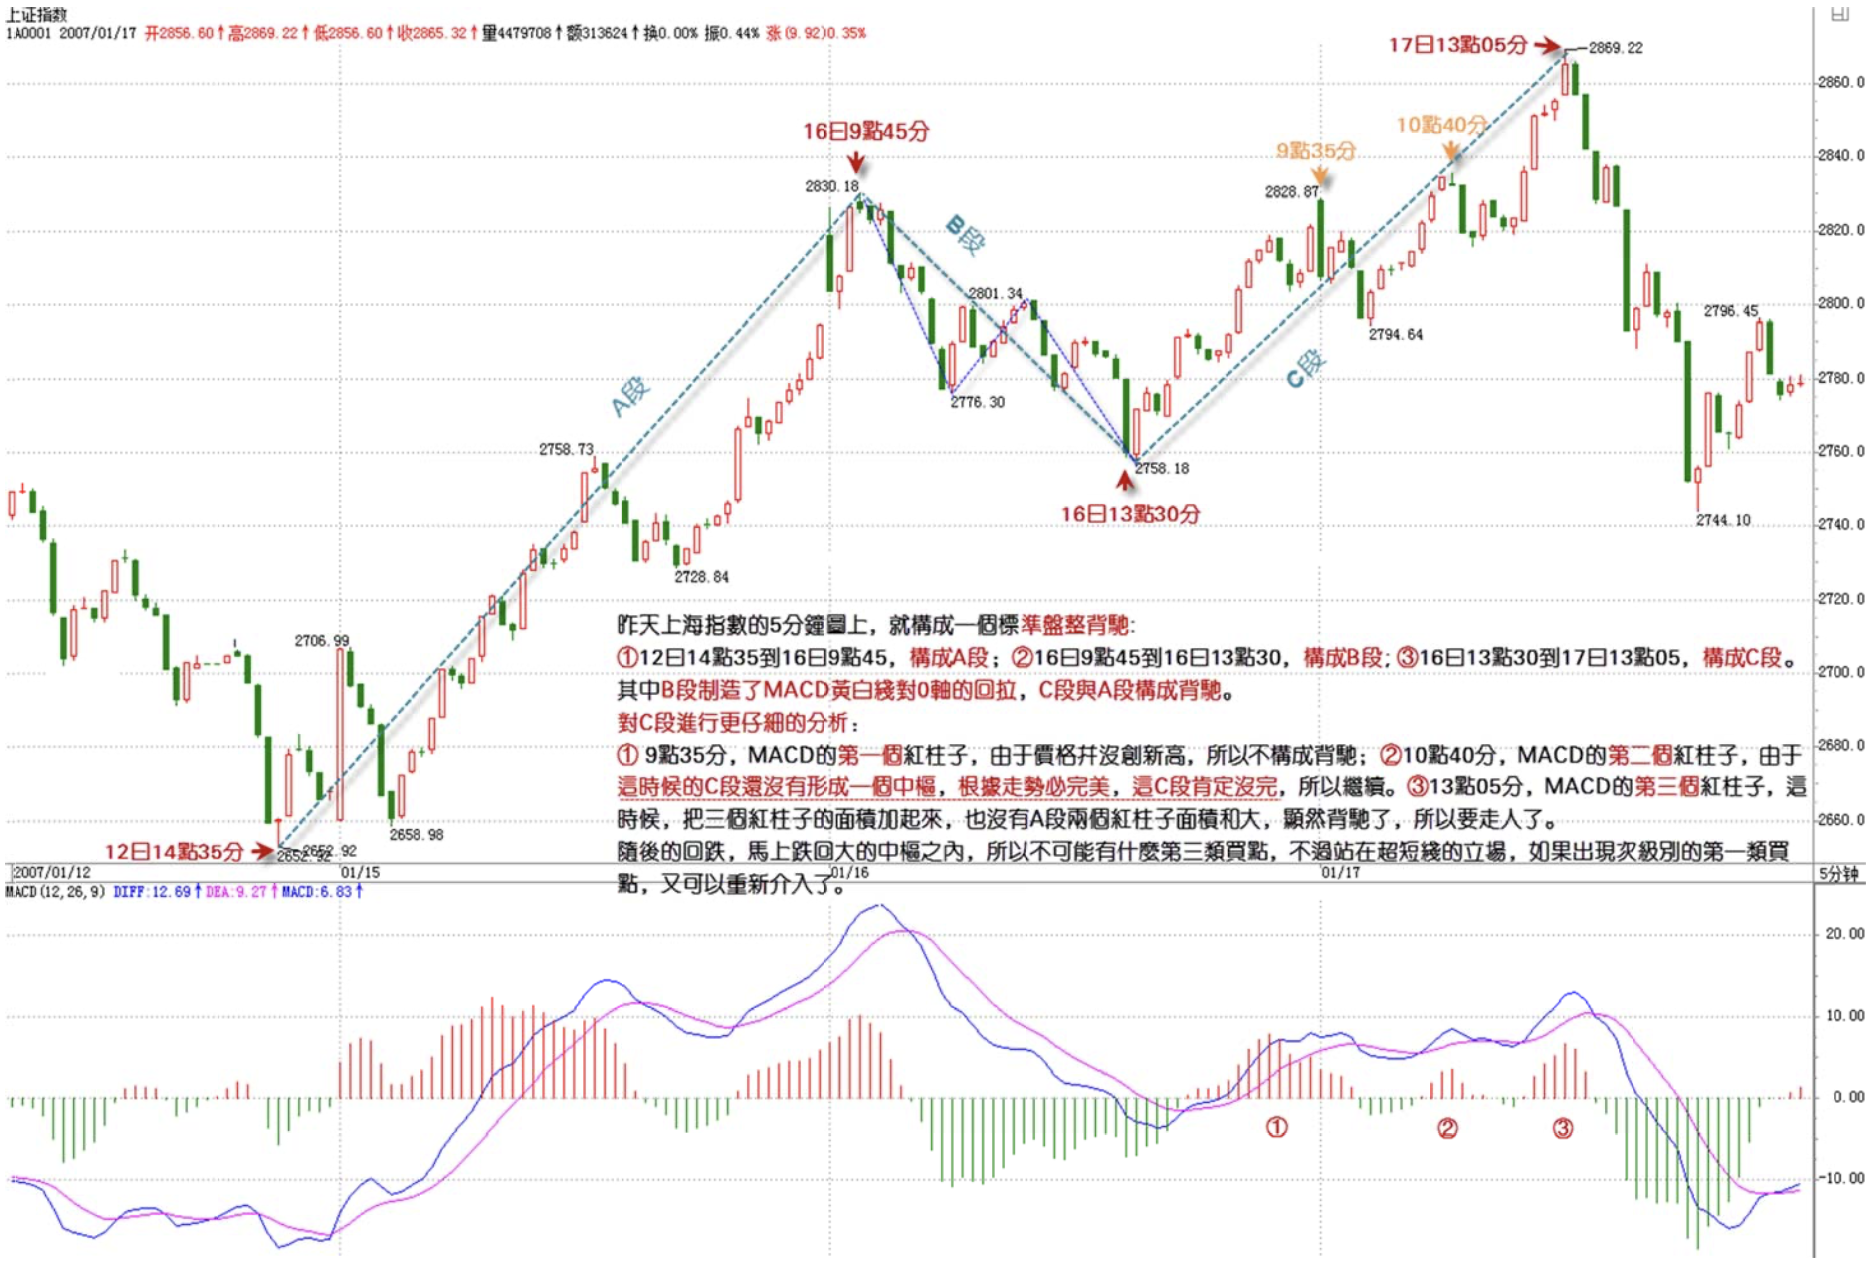
Yesterday's Shanghai 5-minute chart constituted a standard consolidation divergence. From 14:35 on the 12th to 9:45 on the 16th forms segment A, from 9:45 on the 16th to 13:30 on the 16th forms segment B, from 13:30 on the 16th to 13:05 on the 17th forms segment C. B creates the MACD yellow/white line pullback to the 0 axis, and C diverges against A. For a more detailed analysis of segment C: the first red bar at 9:35, since it didn't create a new high, doesn't constitute divergence, so don't act. The second red bar at 10:40 — since at this point segment C hasn't yet formed a hub, by the principle that trends must complete themselves, segment C is definitely not done, so continue. At 13:05, the third red bar — at this point, adding all three red bar areas together is still less than the sum of segment A's two red bar areas. Obviously, it's divergent, so time to exit. The subsequent pullback immediately fell back into the larger hub, so there's no possibility of any third-type buy point. However, from an ultra-short-term standpoint, if a sub-level first-type buy point appears, you could enter again.
Shanghai Composite Index (1A0001)
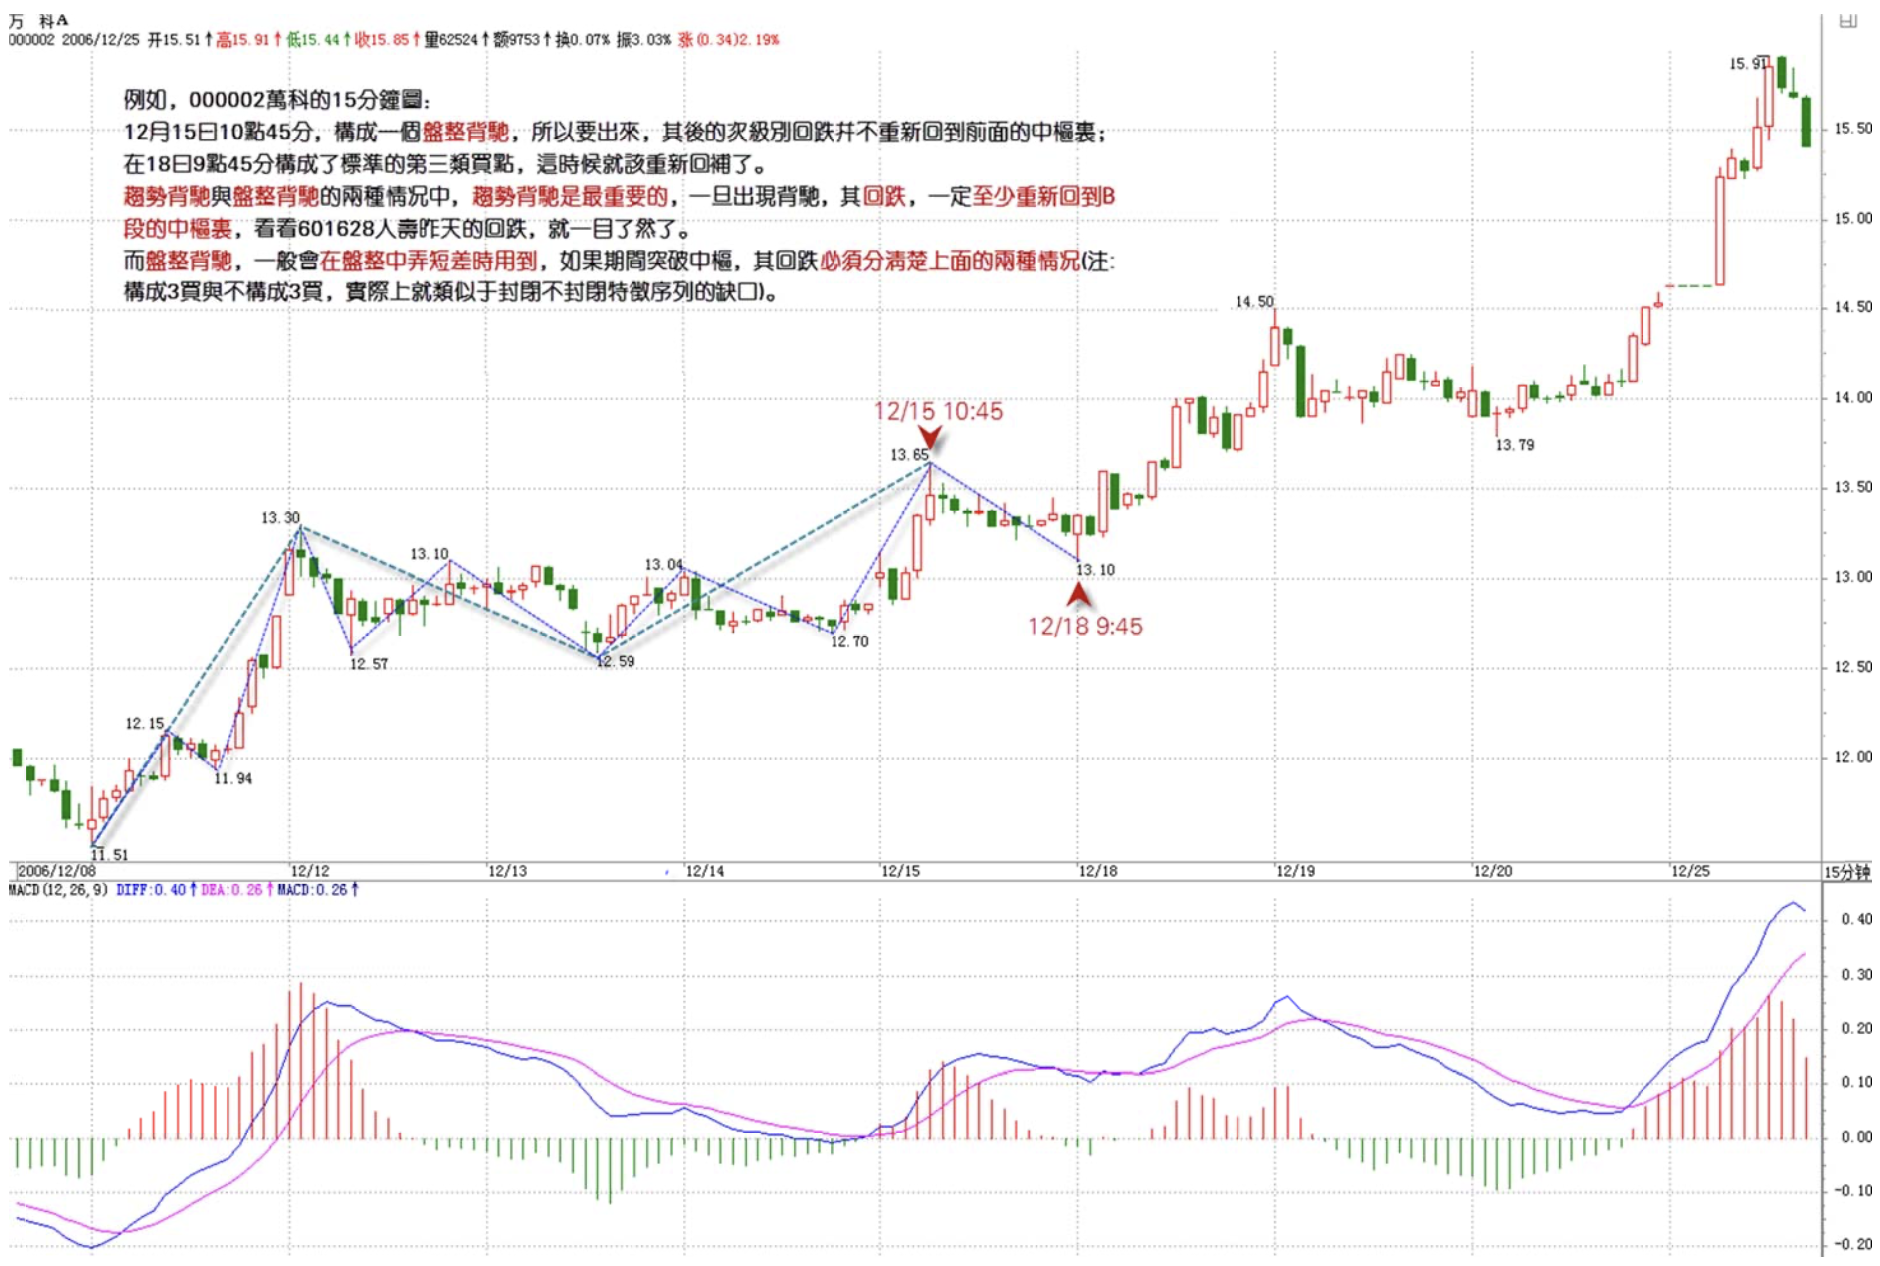
Is there an example of consolidation divergence followed by a pullback forming a third-type buy point? Actually there are far too many such examples — one type of third-type buy point is formed precisely this way. For example, Vanke (000002) on the 15-minute chart: at 10:45 on December 15, a consolidation divergence formed, so you should exit. The subsequent sub-level pullback didn't return to the previous hub, forming a standard third-type buy point at 9:45 on the 18th — that's when you should buy back.
Vanke A (000002)
In both divergence and consolidation divergence scenarios, divergence is the most important. Once divergence appears, the pullback must at minimum return to segment B's hub. Look at 601628 Life Insurance's pullback yesterday — it's immediately clear. For consolidation divergence, it's generally used for playing short differences within consolidation. If it breaks through the hub midway, the subsequent pullback must distinguish between the two scenarios described above.
It must be noted that whether divergence or consolidation divergence, as long as the above corresponding standards are met, technically they are absolute — there's no probability involved. The issue is not the accuracy of the technique, but the accuracy of the operator's judgment. That is, one must first get clear on what divergence is, what consolidation divergence is, and what the standards between them are. If even these can't be sorted out, it's impossible to proficiently apply this technique.
It must be stated that due to MACD's inherent limitations, to precisely judge divergence and consolidation divergence, one must ultimately start from the hub itself. However, using MACD as an auxiliary is simpler for most people to understand and grasp, and this is already good enough. Using only MACD as an auxiliary, even if you're not very clear on hubs, as long as you can distinguish segments A, B, and C, the accuracy should be above 90%. Combined with hubs, it's 100% absolute, because this can be proven through pure mathematical deductive logic. The specific proof will be discussed later.
Replies
缠中说禅 2007/1/18 15:14:46
[Anonymous] Leisurely
2007-01-18 15:08:56
Haha, No. 1!
Is Zhonghe or Sinopec showing divergence again like this?
The former on 5-minute, the latter on 30-minute
==
Study first — what's the use of just knowing the answer? It's best to analyze it yourself. Going forward, this ID generally won't answer questions that are just asking without any personal analysis. You analyze, and this ID tells you whether your analysis is right or wrong — that's how you improve.
缠中说禅 2007/1/18 15:18:07
[Anonymous] 新年好
2007-01-18 15:12:26
So early today. Hello Chan sister!
==
Have to step out in a moment — someone's coming to discuss acquiring a nickel mine with this ID. This ID isn't very interested, but can listen. Won't be back until tonight.
缠中说禅 2007/1/18 15:24:54
[Anonymous] 新年好
2007-01-18 15:19:23
Chan sister, on 600900 Yangtze Power's 5-minute chart, according to my analysis, divergence appeared at 11:00 on January 18th, and the subsequent trend should have reversed, but it doesn't seem to have. Where did my analysis go wrong?
==
First thoroughly research the lesson above, then check whether it actually fits the criteria for divergence.
缠中说禅 2007/1/18 15:28:34
[Anonymous] 惊为天人
2007-01-18 15:18:31
Hello Chan, could you use the "no trend, no divergence" theory to explain yesterday's divergence on the market index and China Life Insurance? Please be as practical as possible. If you gloss over it with concise, abstract language, I believe many students like me who lack intuition will still be confused. Which moving averages are used — 5MA and 10MA? What are the MACD parameters? The time points for trend segmentation, the timing of divergence — only with this level of clarity can us beginners truly appreciate it! Thanks!
===
First read this post clearly, and study the three examples thoroughly. This has nothing to do with any moving averages — it's about MACD. As for the most basic MACD knowledge, there's no need to explain it here. If you don't know, just grab anyone at a securities office and ask.
缠中说禅 2007/1/18 15:31:05
Everyone —
Study the charts carefully. Research the details thoroughly — one evening should be more than enough. Then look at more charts and apply your understanding to analyze — see if you can get it right. That's how you improve.
This ID needs to go check out a nickel mine now. Will be back tonight. Goodbye.
缠中说禅 2007/1/18 20:53:23
[Anonymous] 恒旧常新
2007-01-18 20:40:14
May I ask the blogger: is the area calculated as time length multiplied by the maximum value among the red/green bars?
===
No need to make things that complicated. Two clusters of bars forming an area — the relative sizes are visible to the naked eye. Do you really need to calculate? If you truly want to calculate, review a formula from calculus and you'll know.
缠中说禅 2007/1/18 20:57:17
[Anonymous] KK
2007-01-18 20:42:07
Regarding the Shanghai index one,
========
At 10:40, the No. 2 red bar cluster — at this point segment C hadn't yet formed a hub. Per "all trends must complete," segment C definitely wasn't finished, so continue. At 13:05, the No. 3 red bar cluster — at this point, adding up the area of all three red bar clusters, it still wasn't as large as segment A's two red bar clusters combined. Clearly divergence had occurred, so it was time to exit
========
Why hadn't a hub formed by the No. 2 red bar cluster? Looking at the sub-level chart, there were already three overlapping trend segments
===
You first need to get clear on the direction of the three segments that form a hub — not just any three segments qualify. This is the most fundamental thing and can't still be unclear at this point.
If it's an upward trend, the hub inside must be down-up-down. Downward is the reverse.
缠中说禅 2007/1/18 21:05:25
[Anonymous] nn
2007-01-18 20:15:39
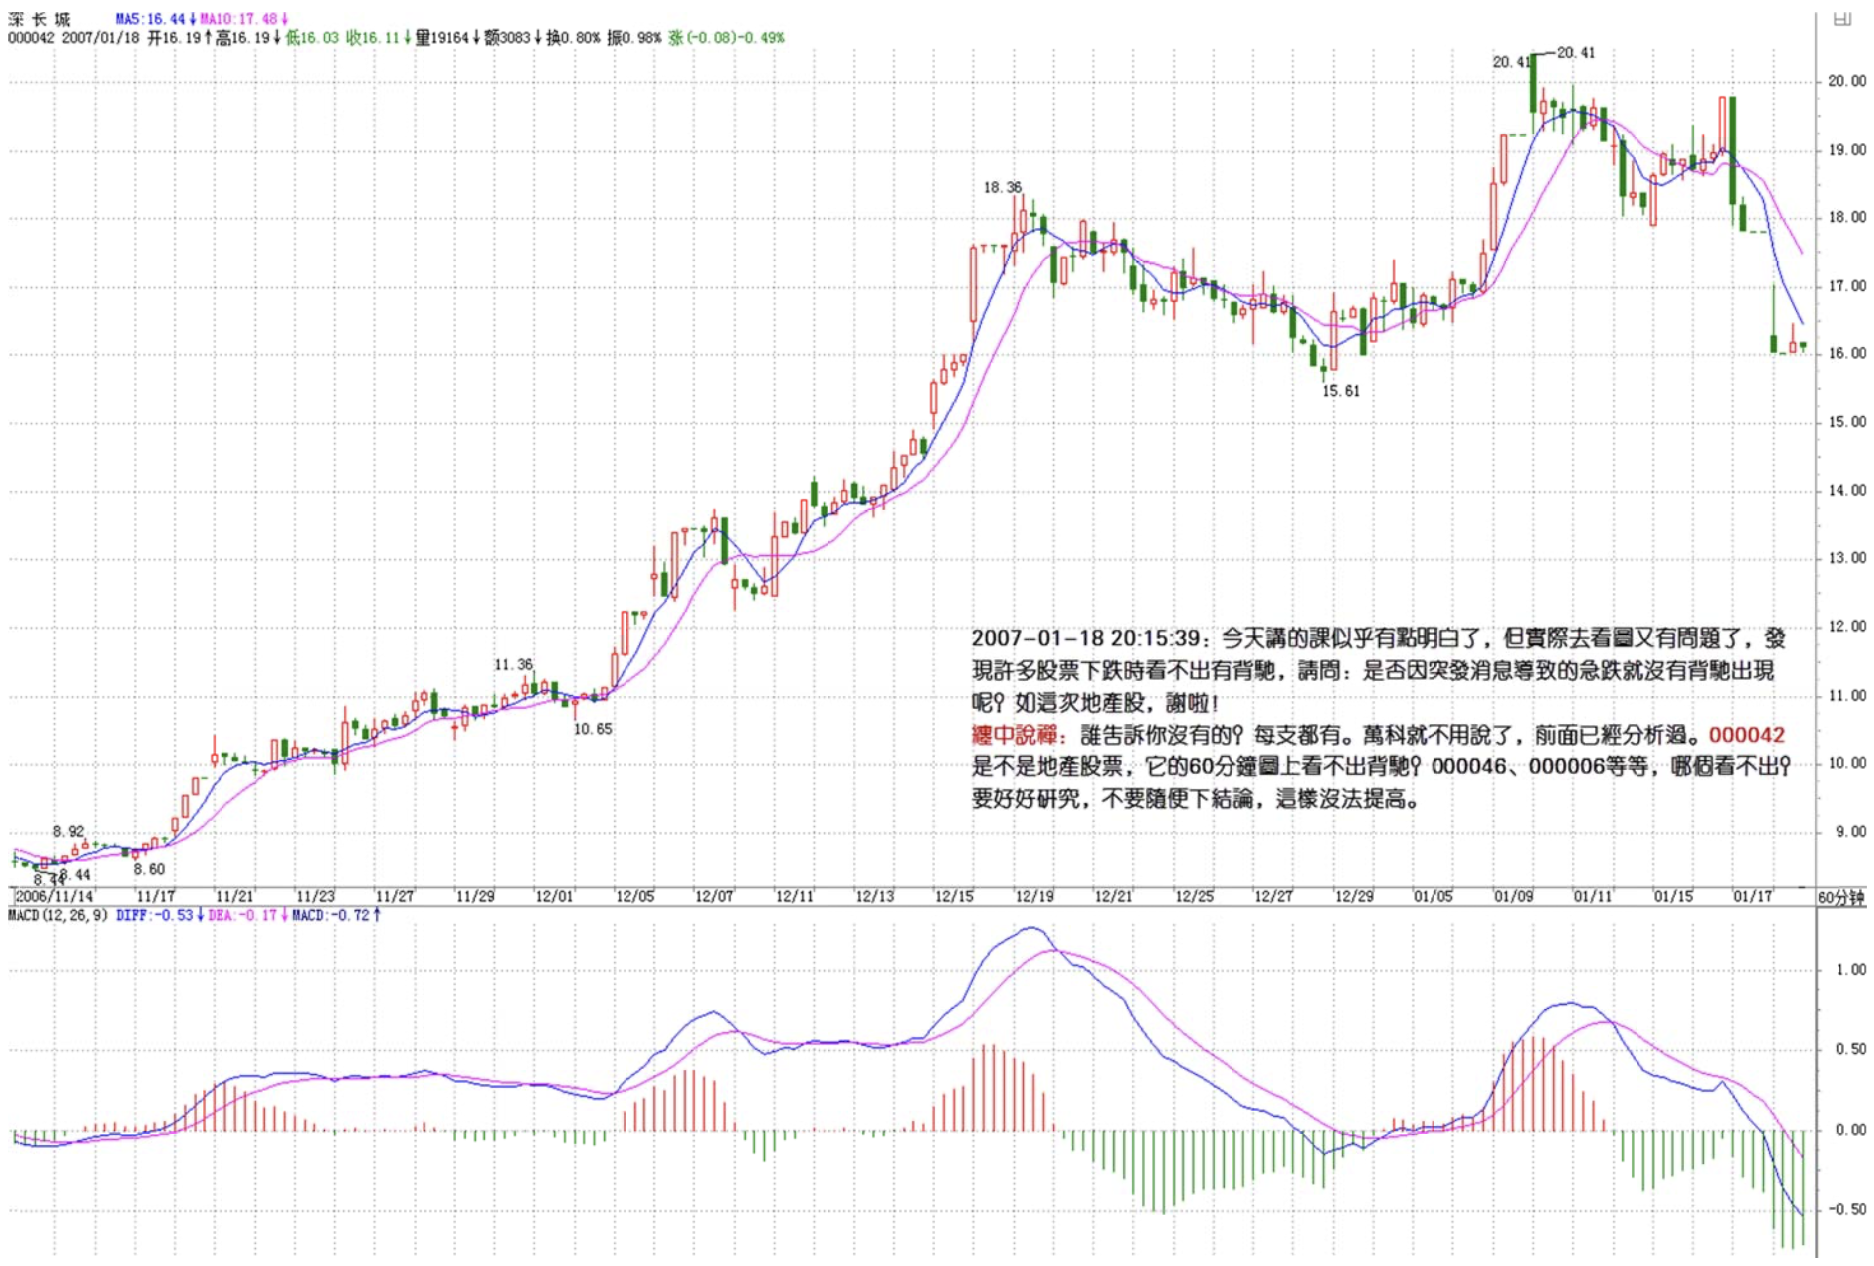
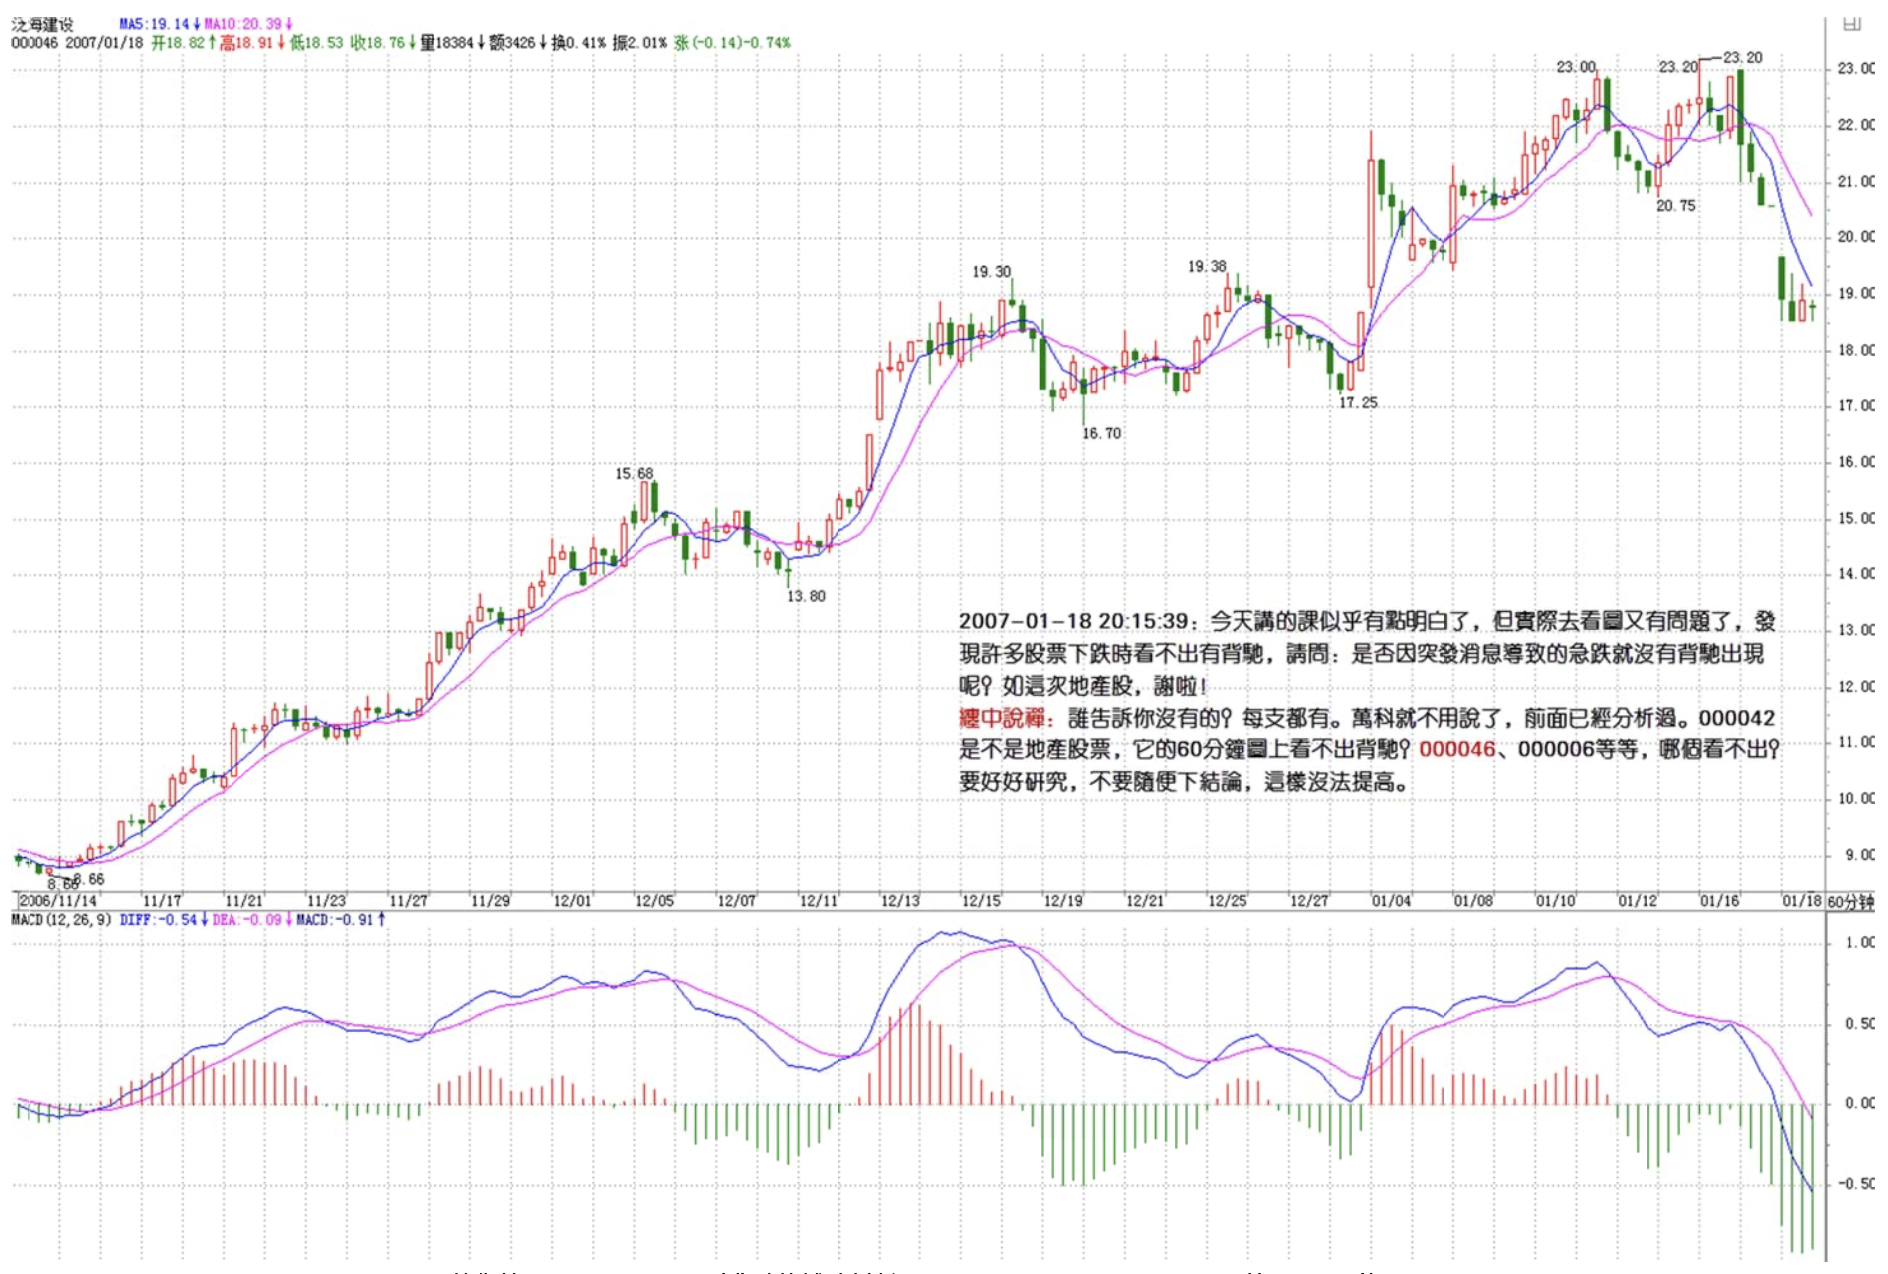
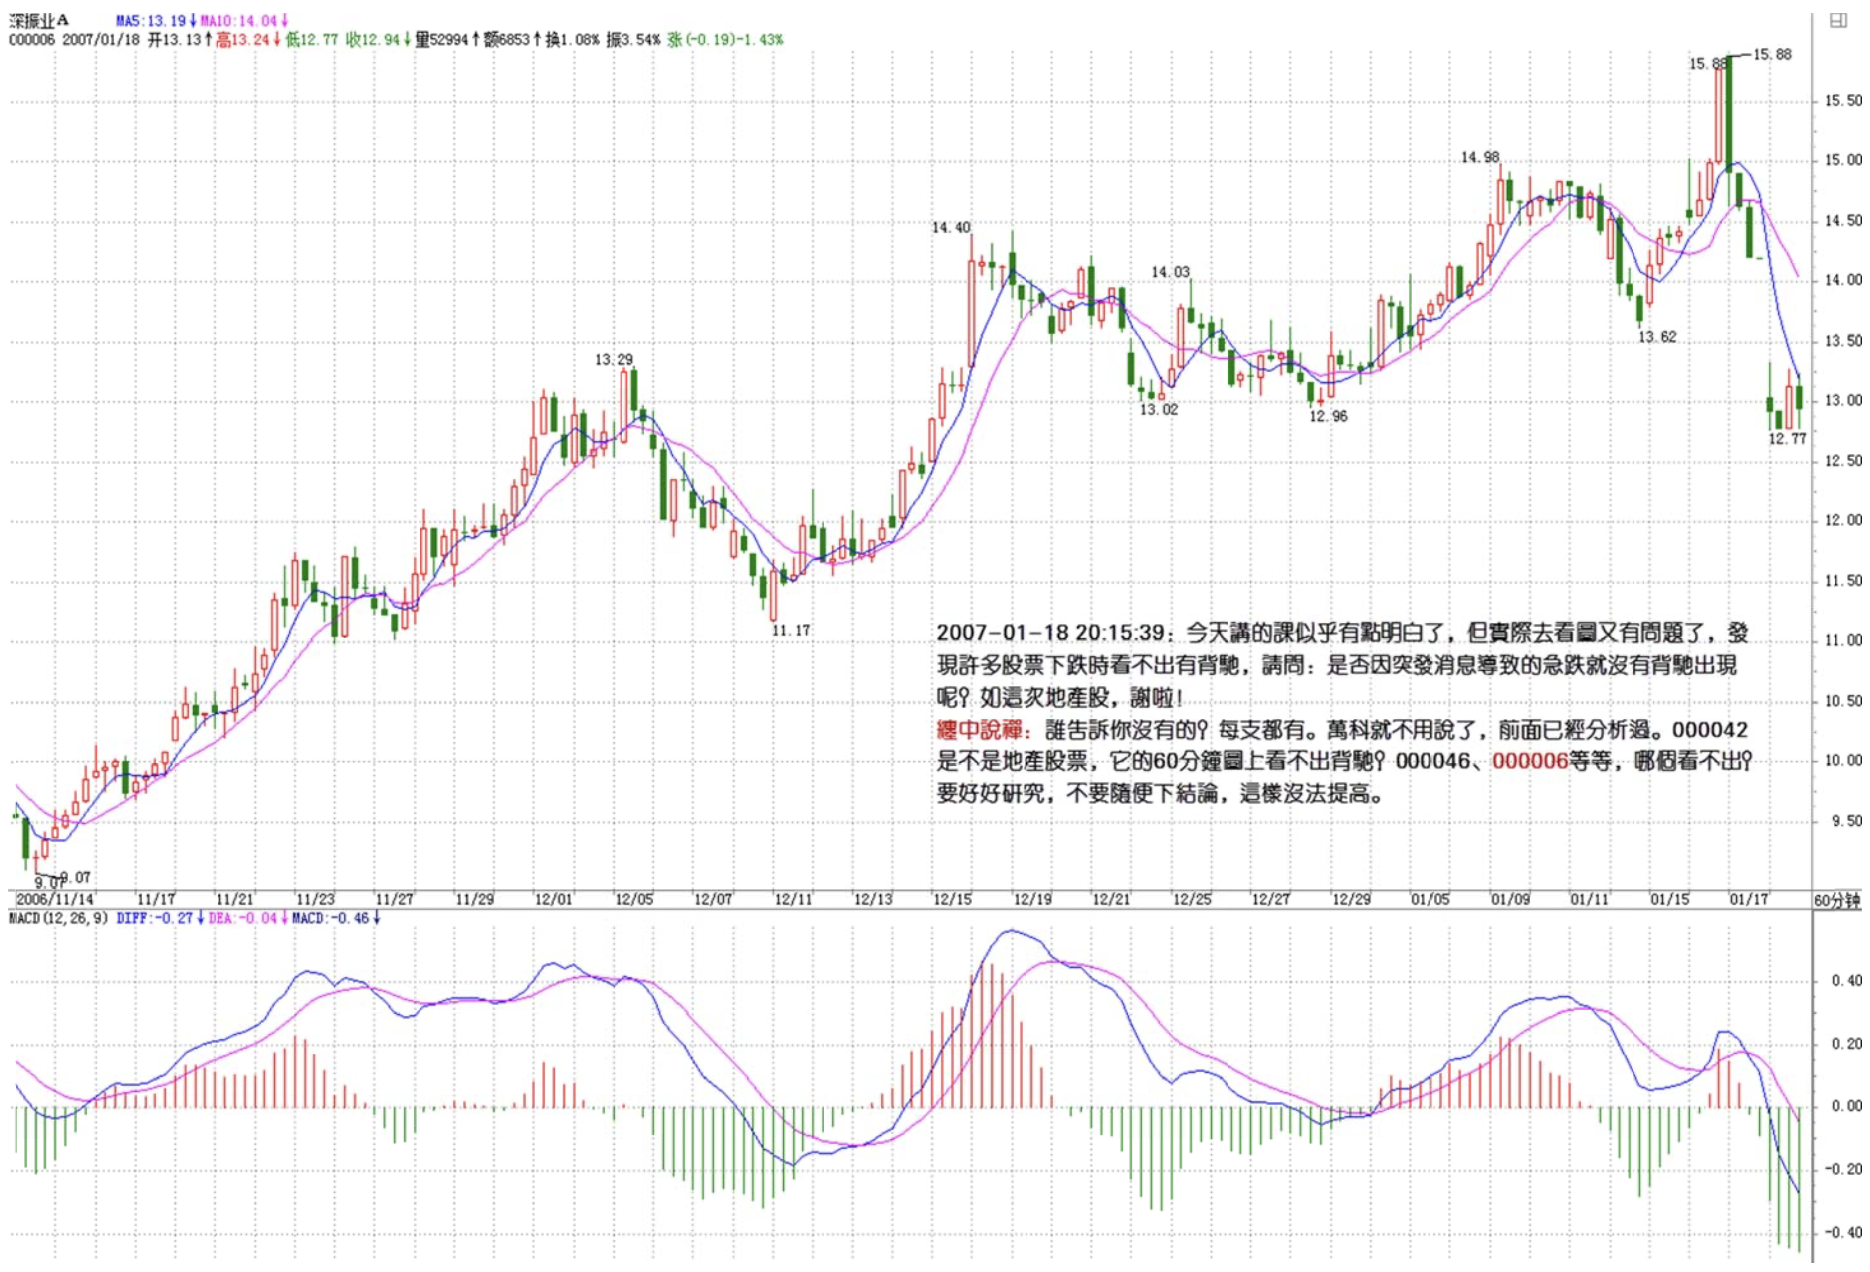
The blogger is such a good person! Today's lesson seems a bit clearer, but when I actually look at charts there are still problems. I find that many stocks don't show divergence during declines. May I ask the blogger: is it true that sudden news-driven sharp drops don't produce divergence? Like with real estate stocks this time — thanks!
===
Who told you there isn't any? Every single one has it. No need to mention Vanke — it's been analyzed before. Isn't 000042 a real estate stock? You can't see divergence on its 60-minute chart? 000046, 000006, etc. — which one can't you see it on?
You need to study carefully. Don't draw conclusions casually — that won't help you improve.
Shencheng (000042)
Fanhai Holdings (000046)
Shenzhenye A (000006)
缠中说禅 2007/1/18 21:15:02
[Anonymous] 笨笨猪
2007-01-18 21:03:47
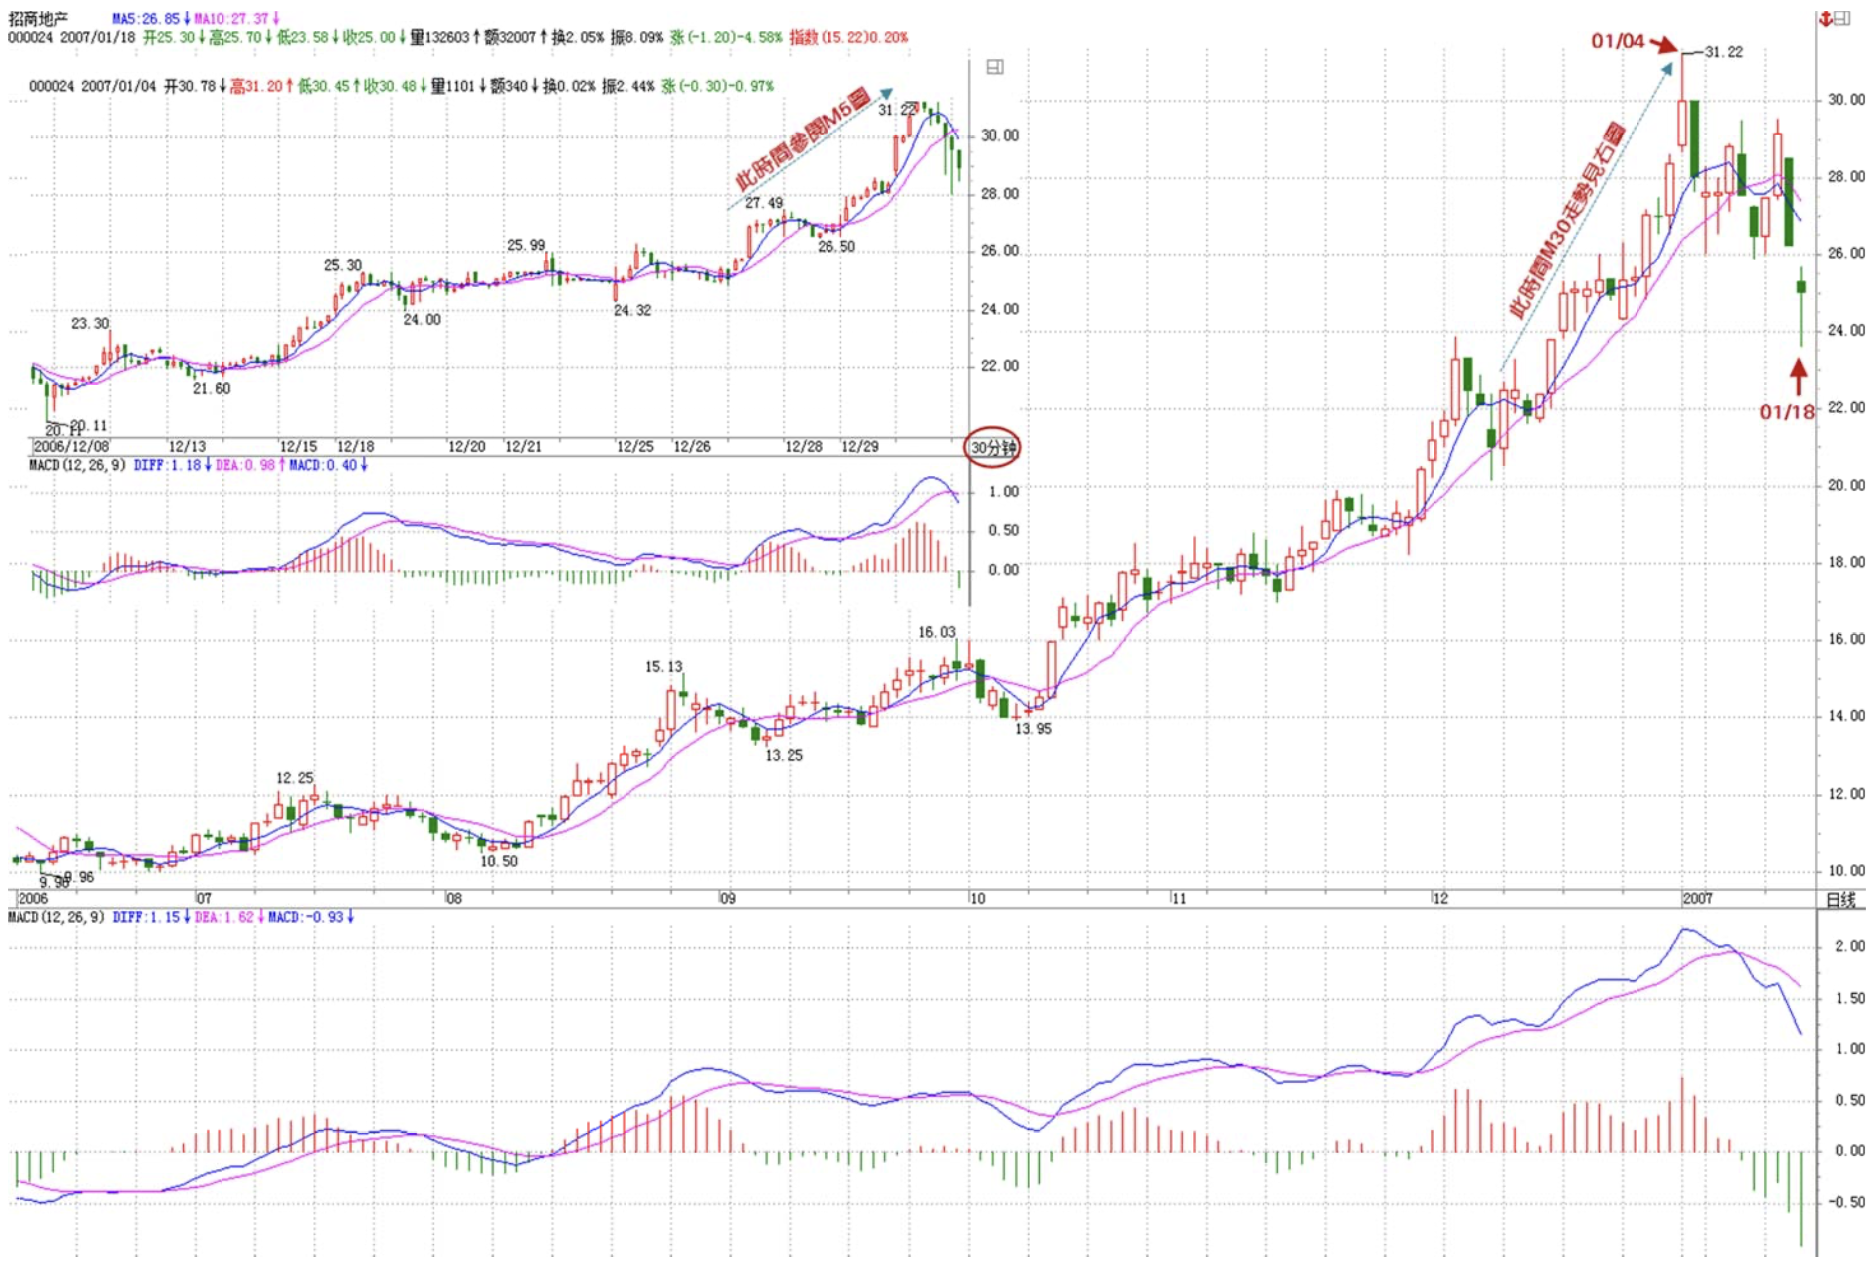
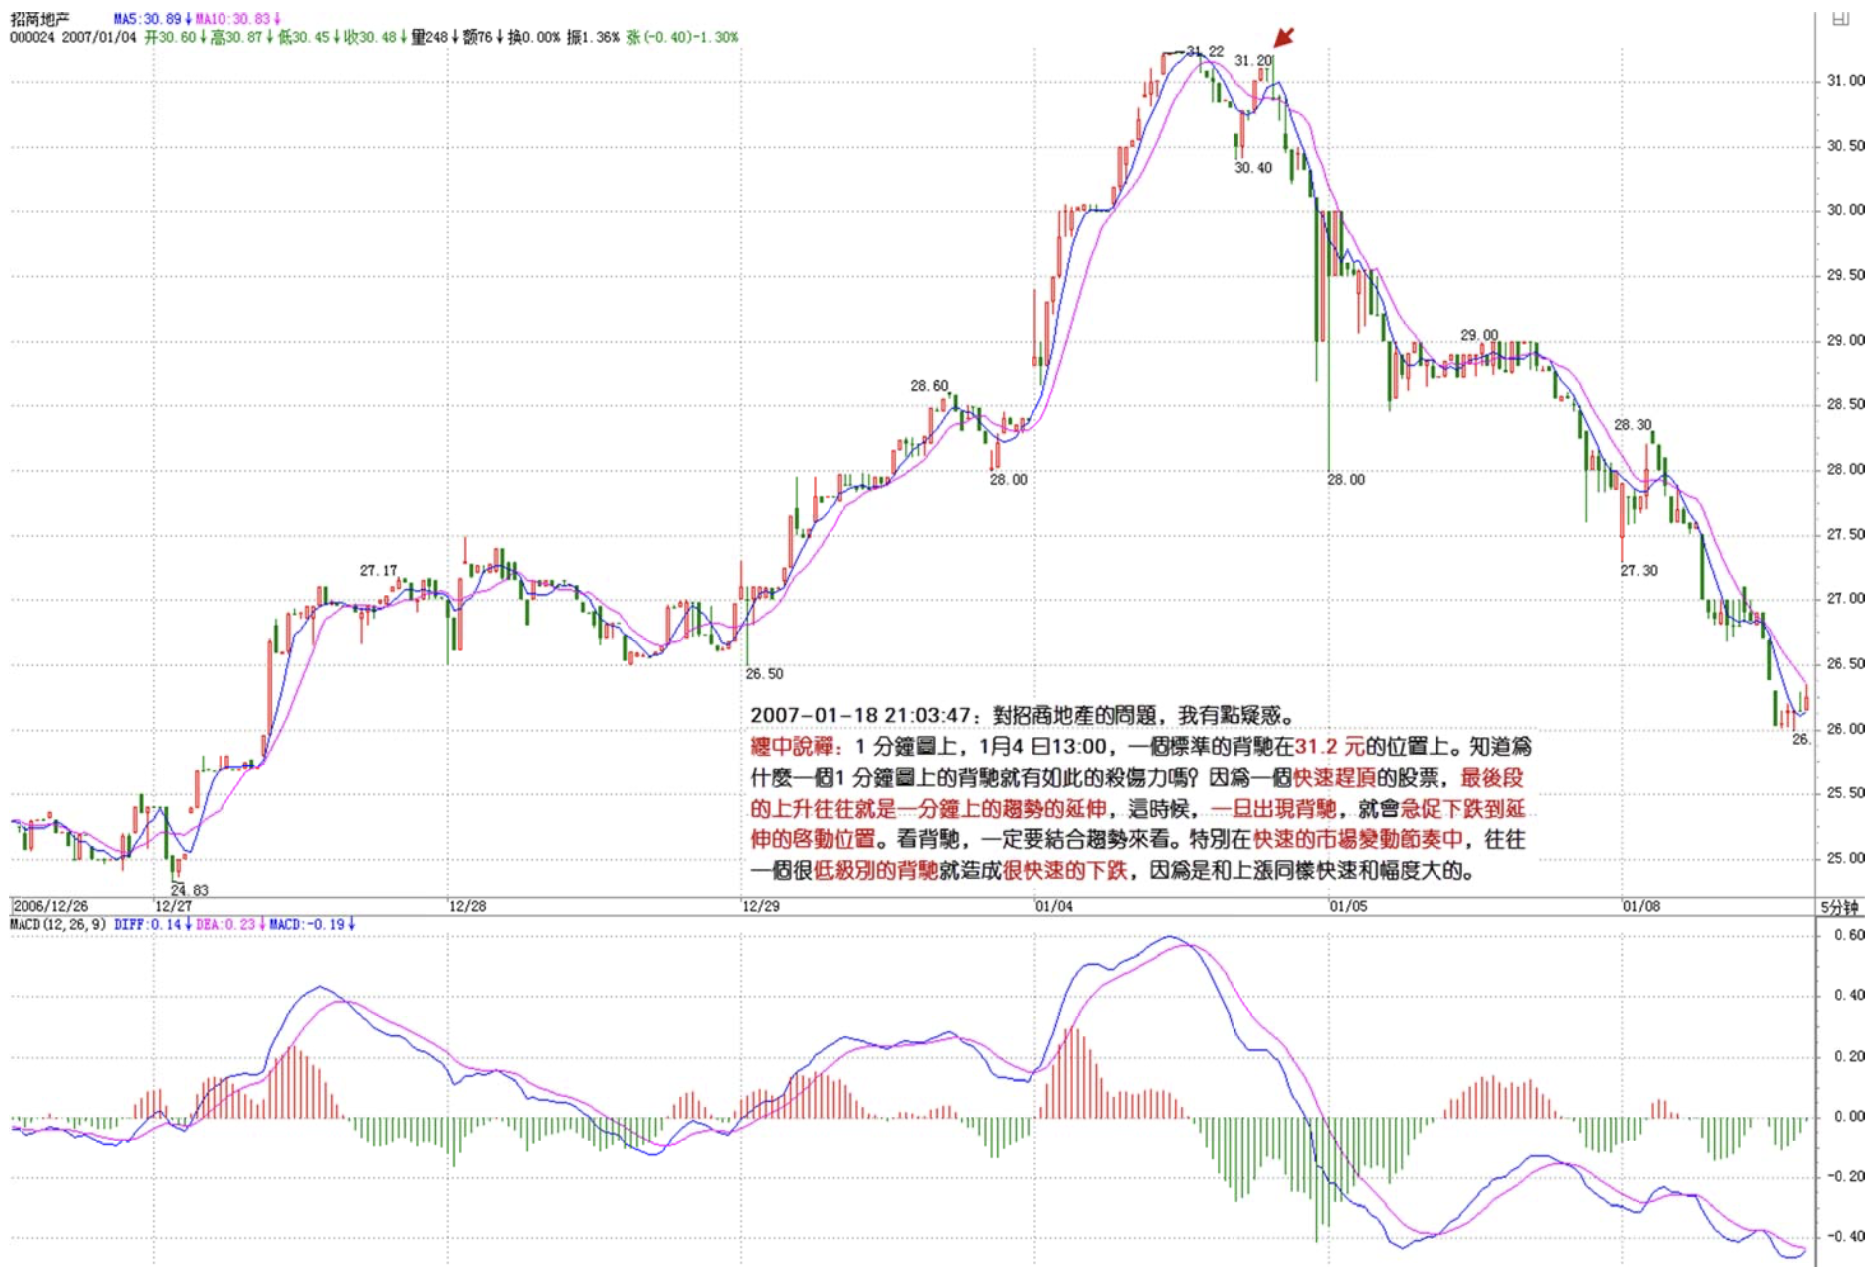
Regarding the earlier question about China Merchants Property, I also have some doubts. Please let the blogger weigh in
===
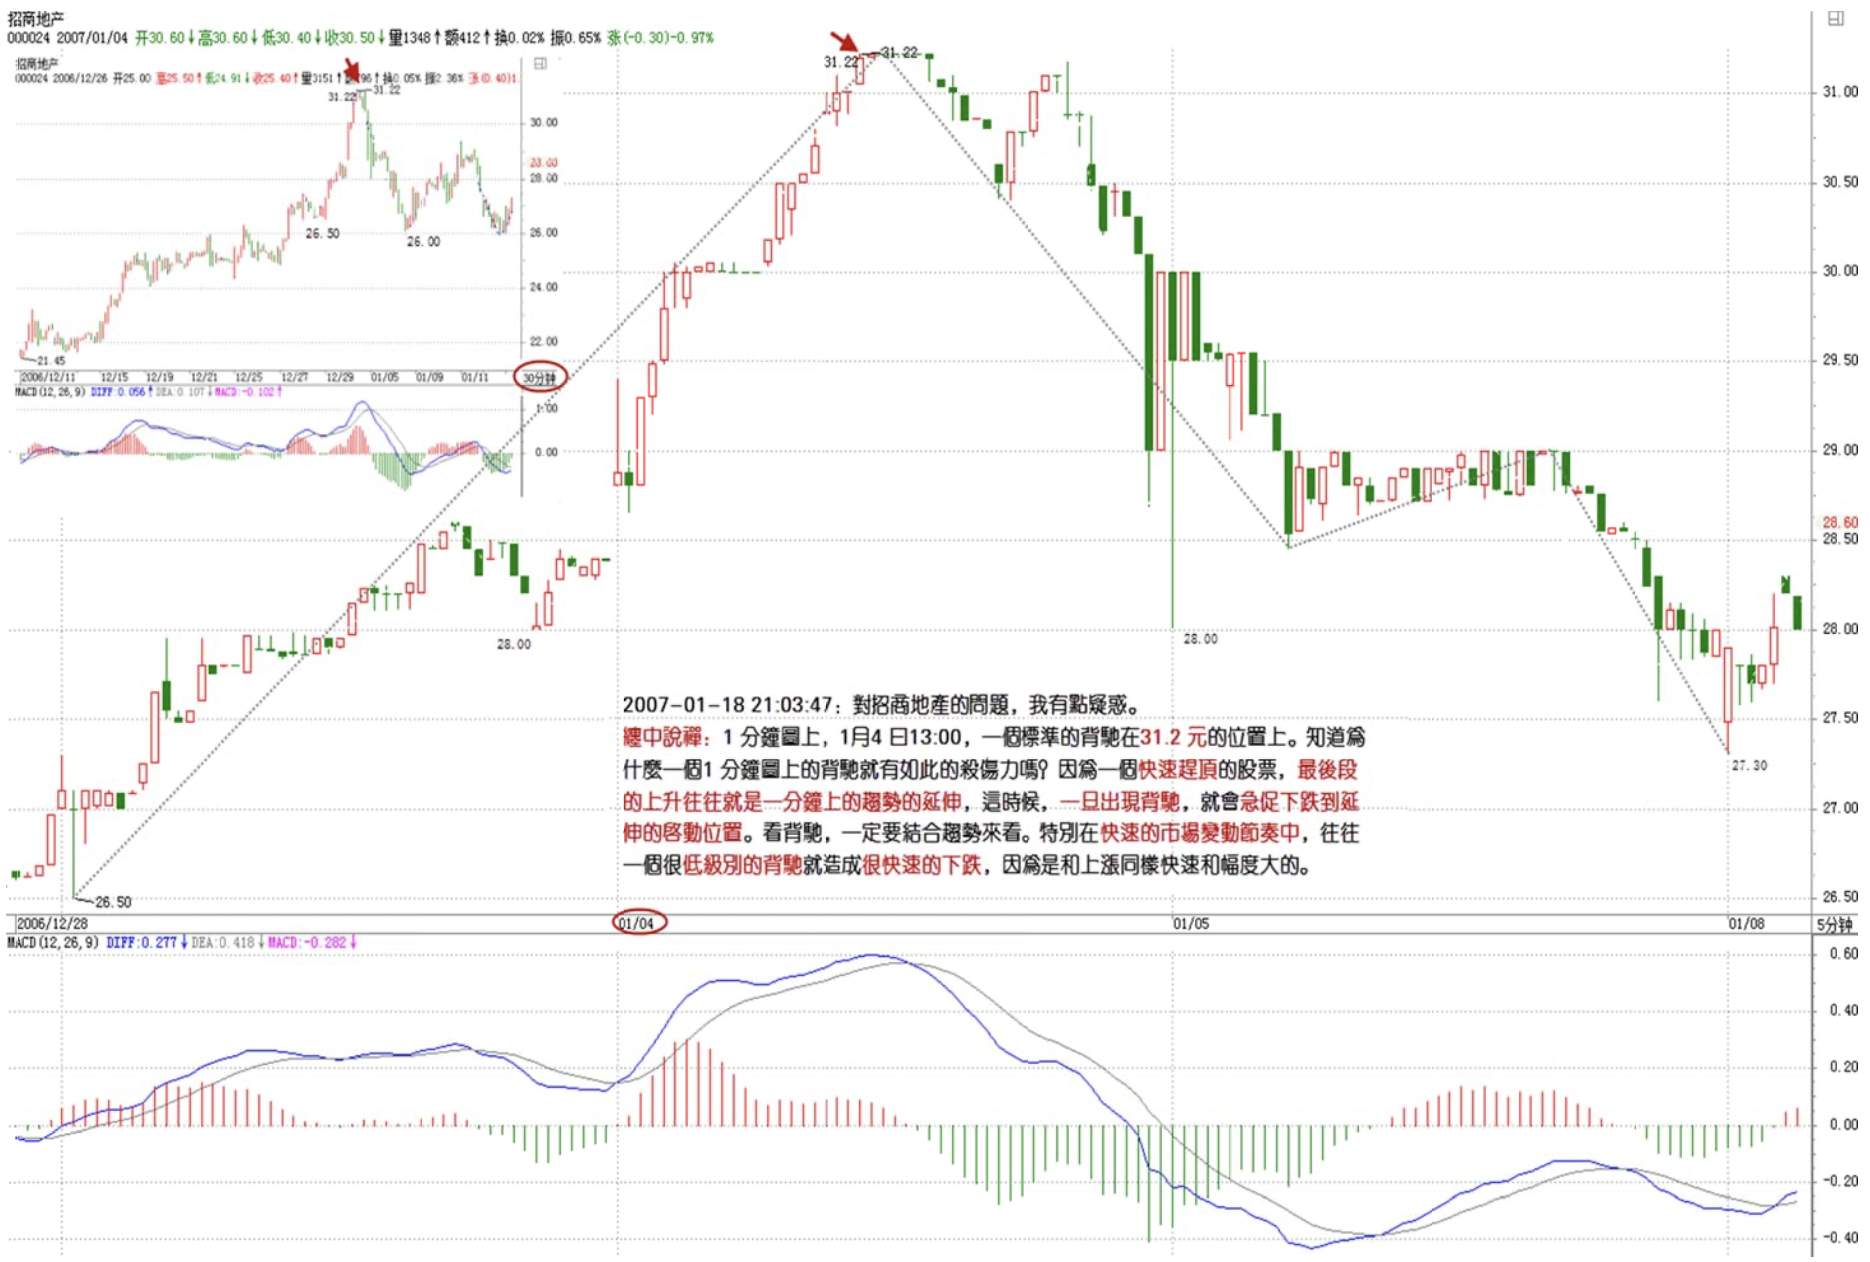
On the 1-minute chart, at 13:00 on the 4th, a standard divergence at the 31.2 yuan position. Know why a 1-minute chart divergence can have such destructive power? Because for a stock quickly rushing to the top, the final leg of the rise is often an extension of a trend on the 1-minute level. At that point, once divergence appears, a sharp decline to the starting position of the extension will follow. When looking for divergence, you must always combine it with the trend. Especially in rapid market rhythm changes, even a very low-level divergence can cause a very rapid decline, because it's symmetrical to the equally fast and large-magnitude rise.
China Merchants Property (000024)
缠中说禅 2007/1/18 21:16:32
[Anonymous] abc
2007-01-18 21:13:22
At 10:40, the No. 2 red bar cluster — at this point segment C hadn't yet formed a hub. Per "all trends must complete," segment C definitely wasn't finished, so continue.
==========
From 16th 13:30 to 17th 10:40, the up, down, up three segments have been completed. Why does the poster say segment C hasn't been completed?
===
How is it that to this day so many people still can't figure out that the three directional segments forming a hub — how they go? Segment C is an upward process. The small hub within it — how could it possibly be in the up, down, up direction?
缠中说禅 2007/1/18 21:30:38
[Anonymous] 无知
2007-01-18 21:10:29
Chan sister, I have two questions!
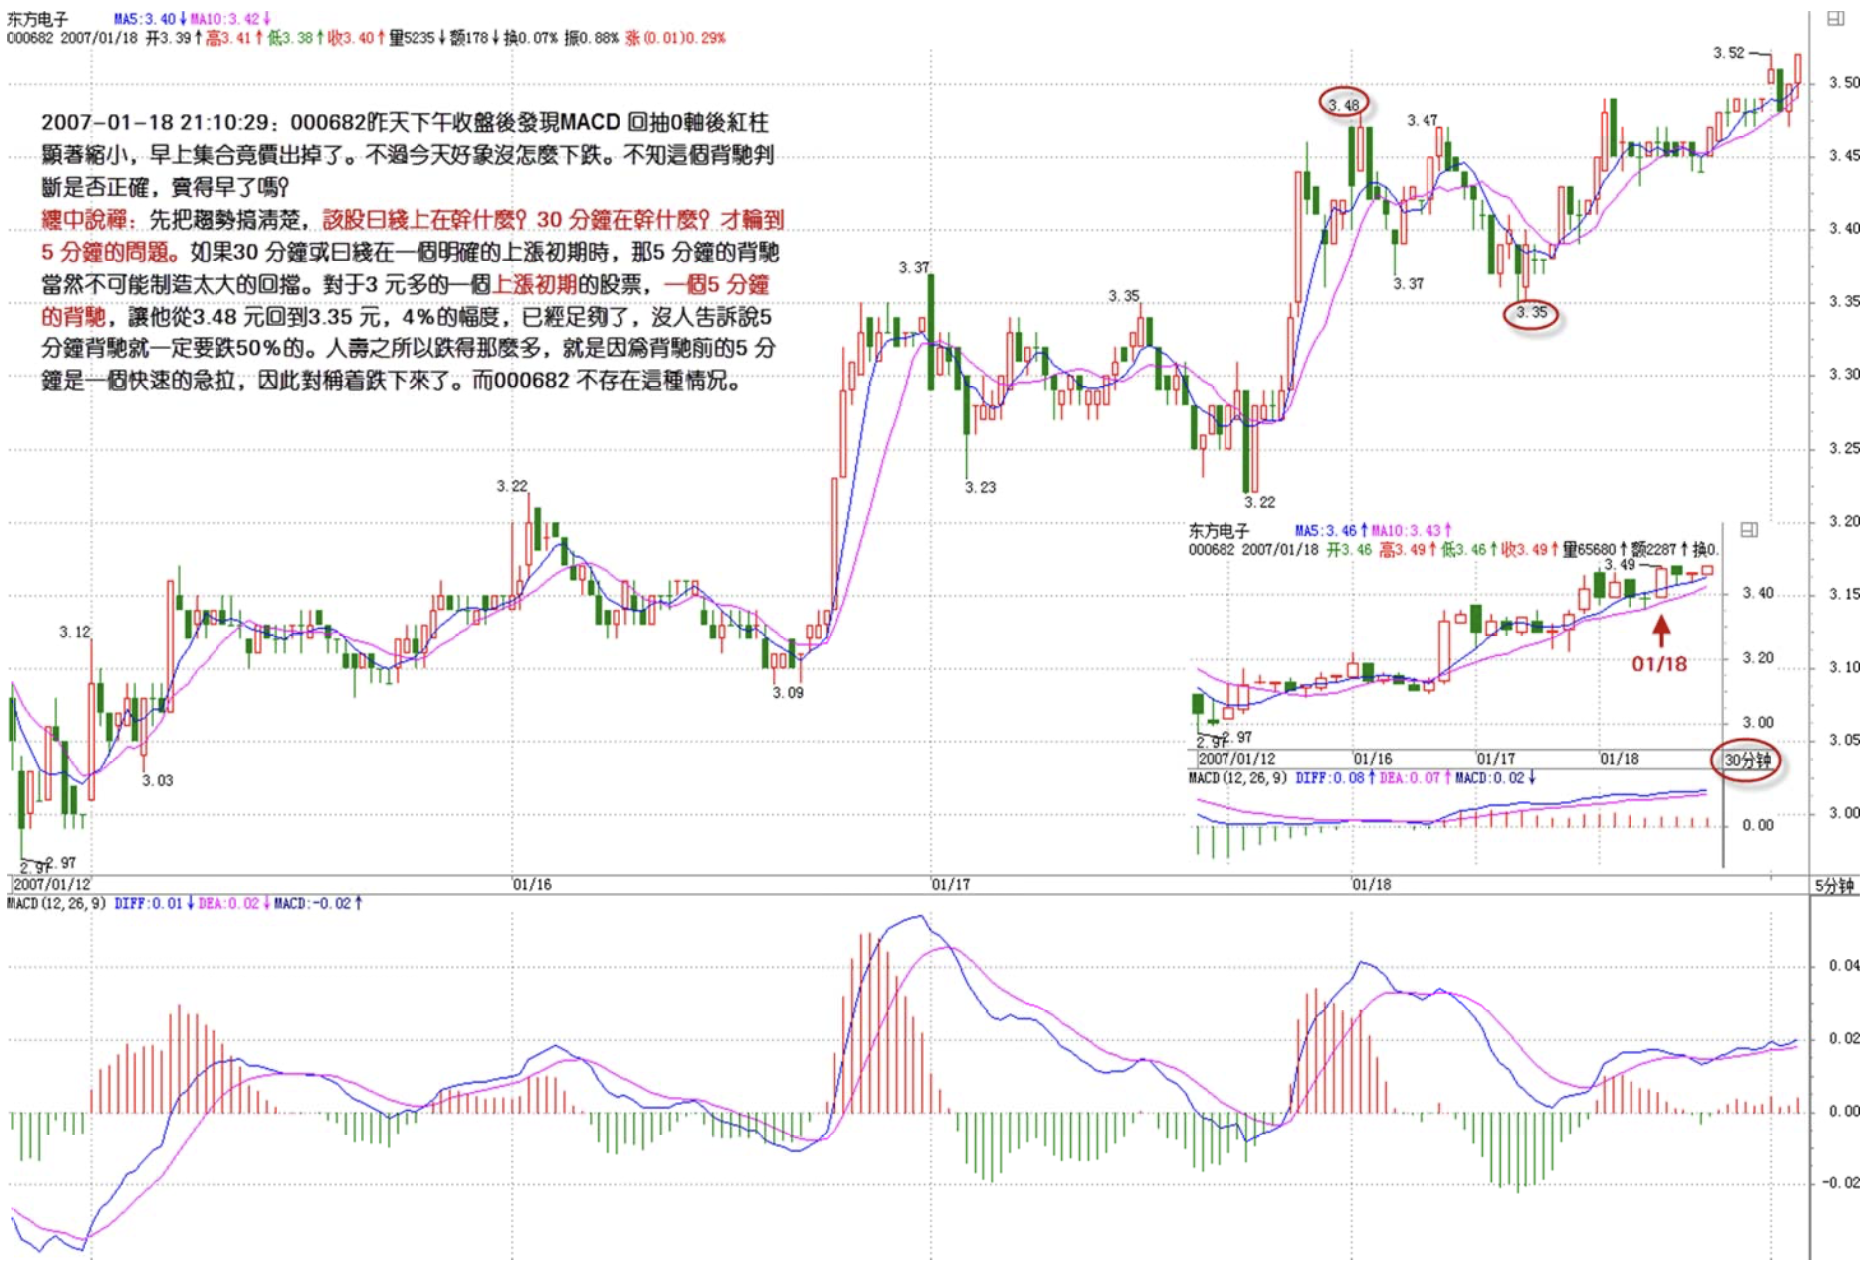
- For 000682, yesterday afternoon before the close I noticed the MACD red bars shrank significantly after pulling back to the zero axis. I sold at this morning's opening auction. But it doesn't seem to have dropped much today. Was this divergence judgment correct — did I sell too early?
===
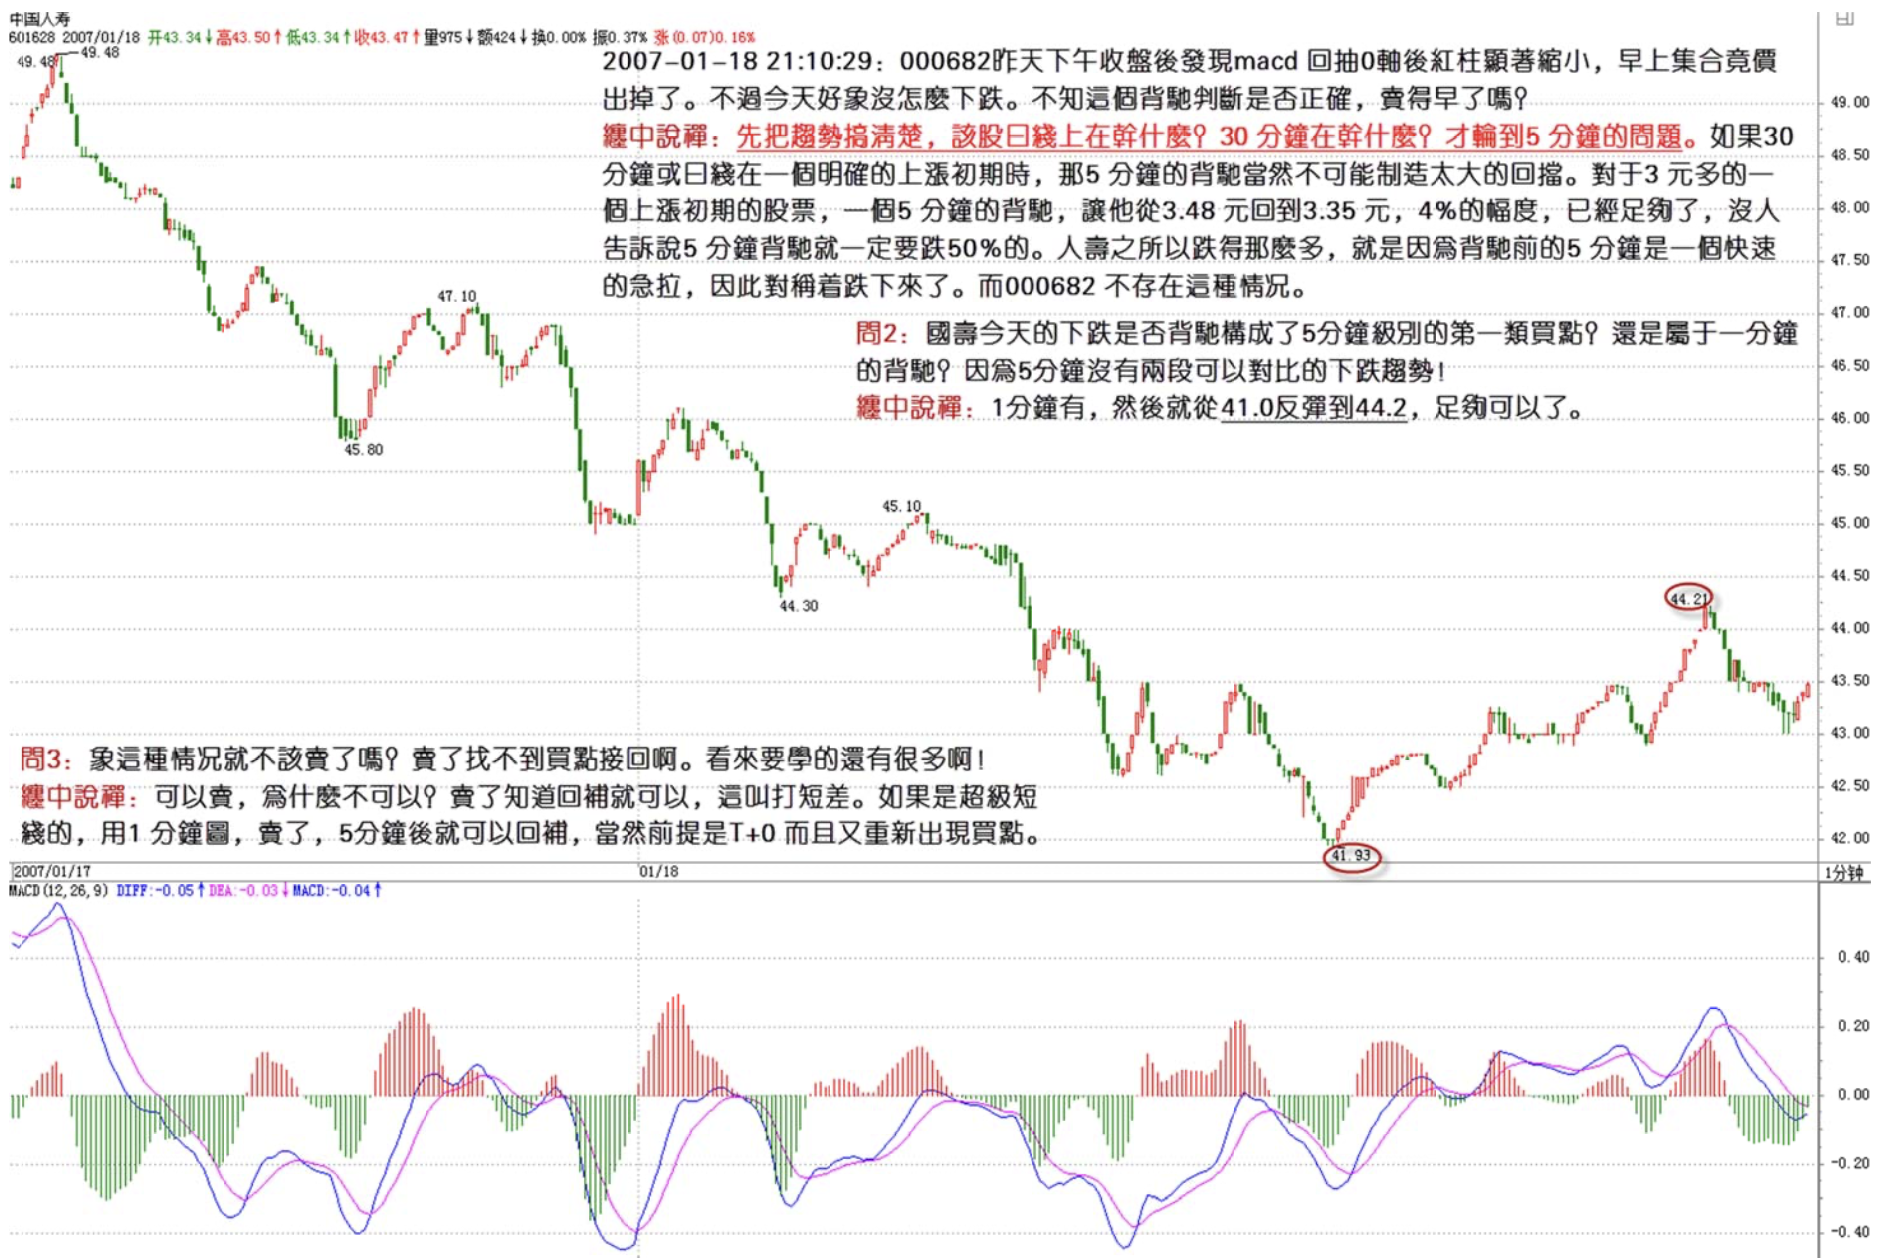
First get the trend clear. What is this stock doing on the daily chart? On the 30-minute chart? Only then do you get to the 5-minute question. If the 30-minute or daily chart is clearly in the early stages of a rise, then a 5-minute divergence naturally can't cause too large a pullback. For a stock at 3+ yuan in the early stages of a rise, a 5-minute divergence pulling it from 3.48 to 3.35 yuan — a 4% move — is already sufficient. Nobody said a 5-minute divergence must cause a 50% drop. The reason Life Insurance dropped so much is that the 5-minute chart before the divergence had a rapid, sharp rally — so it symmetrically dropped back down. 000682 doesn't have this situation.
Dongfang Electronics (000682)
- Does today's decline in China Life Insurance constitute divergence forming a 5-minute level No. 1 buy point? Or is it 1-minute divergence? Because the 5-minute chart doesn't have two comparable declining trend segments!
==
There is one on the 1-minute chart, and then the bounce went from 41.0 to 44.2 — more than sufficient.
China Life Insurance (601628)
缠中说禅 2007/1/18 21:36:20
[Anonymous] 赚到了
2007-01-18 21:30:56
Chan MM, let me ask an extreme question. Say when divergence appears, a foolish market maker deliberately forces a rally, so the subsequent trend doesn't reverse. How would you explain this kind of chart pattern using your theory?
===
Doesn't the market maker's operation also constitute part of the trend itself? Don't treat market makers like gods. If they can push it up, naturally divergence wouldn't appear. If they're distributing while pushing, the trend will naturally leave a trail — that's divergence.
Note: the trend is the comprehensive result of all forces. There's no need to consider any single force in isolation.
缠中说禅 2007/1/18 21:42:39
[Anonymous] KK
2007-01-18 21:34:31
===========
You first need to get clear on how the three directional segments forming a hub begin — not just any three segments qualify. This is the most fundamental thing and can't still be unclear at this point.
If it's an upward trend, the hub inside must be down-up-down. Downward is the reverse.
============
I went back and re-read the definition of Chán Zhōng Shuō Chán trend hub:
Within a certain level's trend type, the part overlapped by at least three consecutive sub-level trend types is called a Chán Zhōng Shuō Chán trend hub.
I'm still confused — does this down-up-down contain two hubs? This is an upward trend that must contain at least two hubs. Is it the horizontal range of "down-up," and then the subsequent "up-down" horizontal range that forms the two hubs?
===
Study the above passage well. A trend has two hubs, so at minimum there are 6 segments. Then add the first segment of the initial pullback, the final sprint segment, and the segment connecting the two hubs — at minimum there are 9 segments that are unambiguous.
You need to look at more charts — otherwise how will you develop a feel? On Life Insurance's 5-minute chart, from 9:55 on the 11th to 13:05 on the 17th, is the most standard complete uptrend without any extension. Count for yourself how many segments there are.
缠中说禅 2007/1/18 21:45:15
[Anonymous] 无言
2007-01-18 21:41:51
Chan sister, you misread — I was talking about 600832 showing No. 3 buy points on the daily and weekly charts. Also, after reading your new article today, entering 600028 at noon was a 5-minute level No. 1 buy point. Per the principle that all trends must complete, there should be another pullback tomorrow morning, right?
==
Misread what? Whose question was this ID answering? Was 000682 your question?
缠中说禅 2007/1/18 21:47:41
[Anonymous] 无知
2007-01-18 21:45:00
Chán Zhōng Shuō Chán
2007-01-18 21:30:38
[Anonymous] 无知
2007-01-18 21:10:29
Chan sister, I have two questions!
- For 000682, yesterday afternoon before the close I noticed the MACD red bars shrank significantly after pulling back to the zero axis. I sold at this morning's opening auction. But it doesn't seem to have dropped much today. Was this divergence judgment correct — did I sell too early?
===
First get the trend clear. What is this stock doing on the daily chart? On the 30-minute chart? Only then do you get to the 5-minute question. If the 30-minute or daily chart is clearly in the early stages of a rise, then a 5-minute divergence naturally can't cause too large a pullback. For a stock at 3+ yuan in the early stages of a rise, a 5-minute divergence pulling it from 3.48 to 3.35 yuan — a 4% move — is already sufficient. Nobody said a 5-minute divergence must cause a 50% drop. The reason Life Insurance dropped so much is that the 5-minute chart before the divergence had a rapid, sharp rally — so it symmetrically dropped back down. 000682 doesn't have this situation.
====
So in this kind of situation, shouldn't I have sold? After selling, I can't find a buy point to get back in. Seems like there's still a lot to learn!
===
You can sell — why couldn't you? Once you sell, knowing when to buy back is enough. That's called playing short differences. If you're an ultra-short-term trader, use the 1-minute chart. After selling, you could buy back 5 minutes later — of course the prerequisites are T+0 and a new buy point appearing.
缠中说禅 2007/1/18 22:11:08
2007-01-18 21:45:15
[Anonymous] 无言
2007-01-18 21:41:51
Chan sister, you misread — I was talking about 600832 showing No. 3 buy points on the daily and weekly charts. Also, after reading your new article today, entering 600028 at noon was a 5-minute level No. 1 buy point. Per the principle that all trends must complete, there should be another pullback tomorrow morning, right?
==
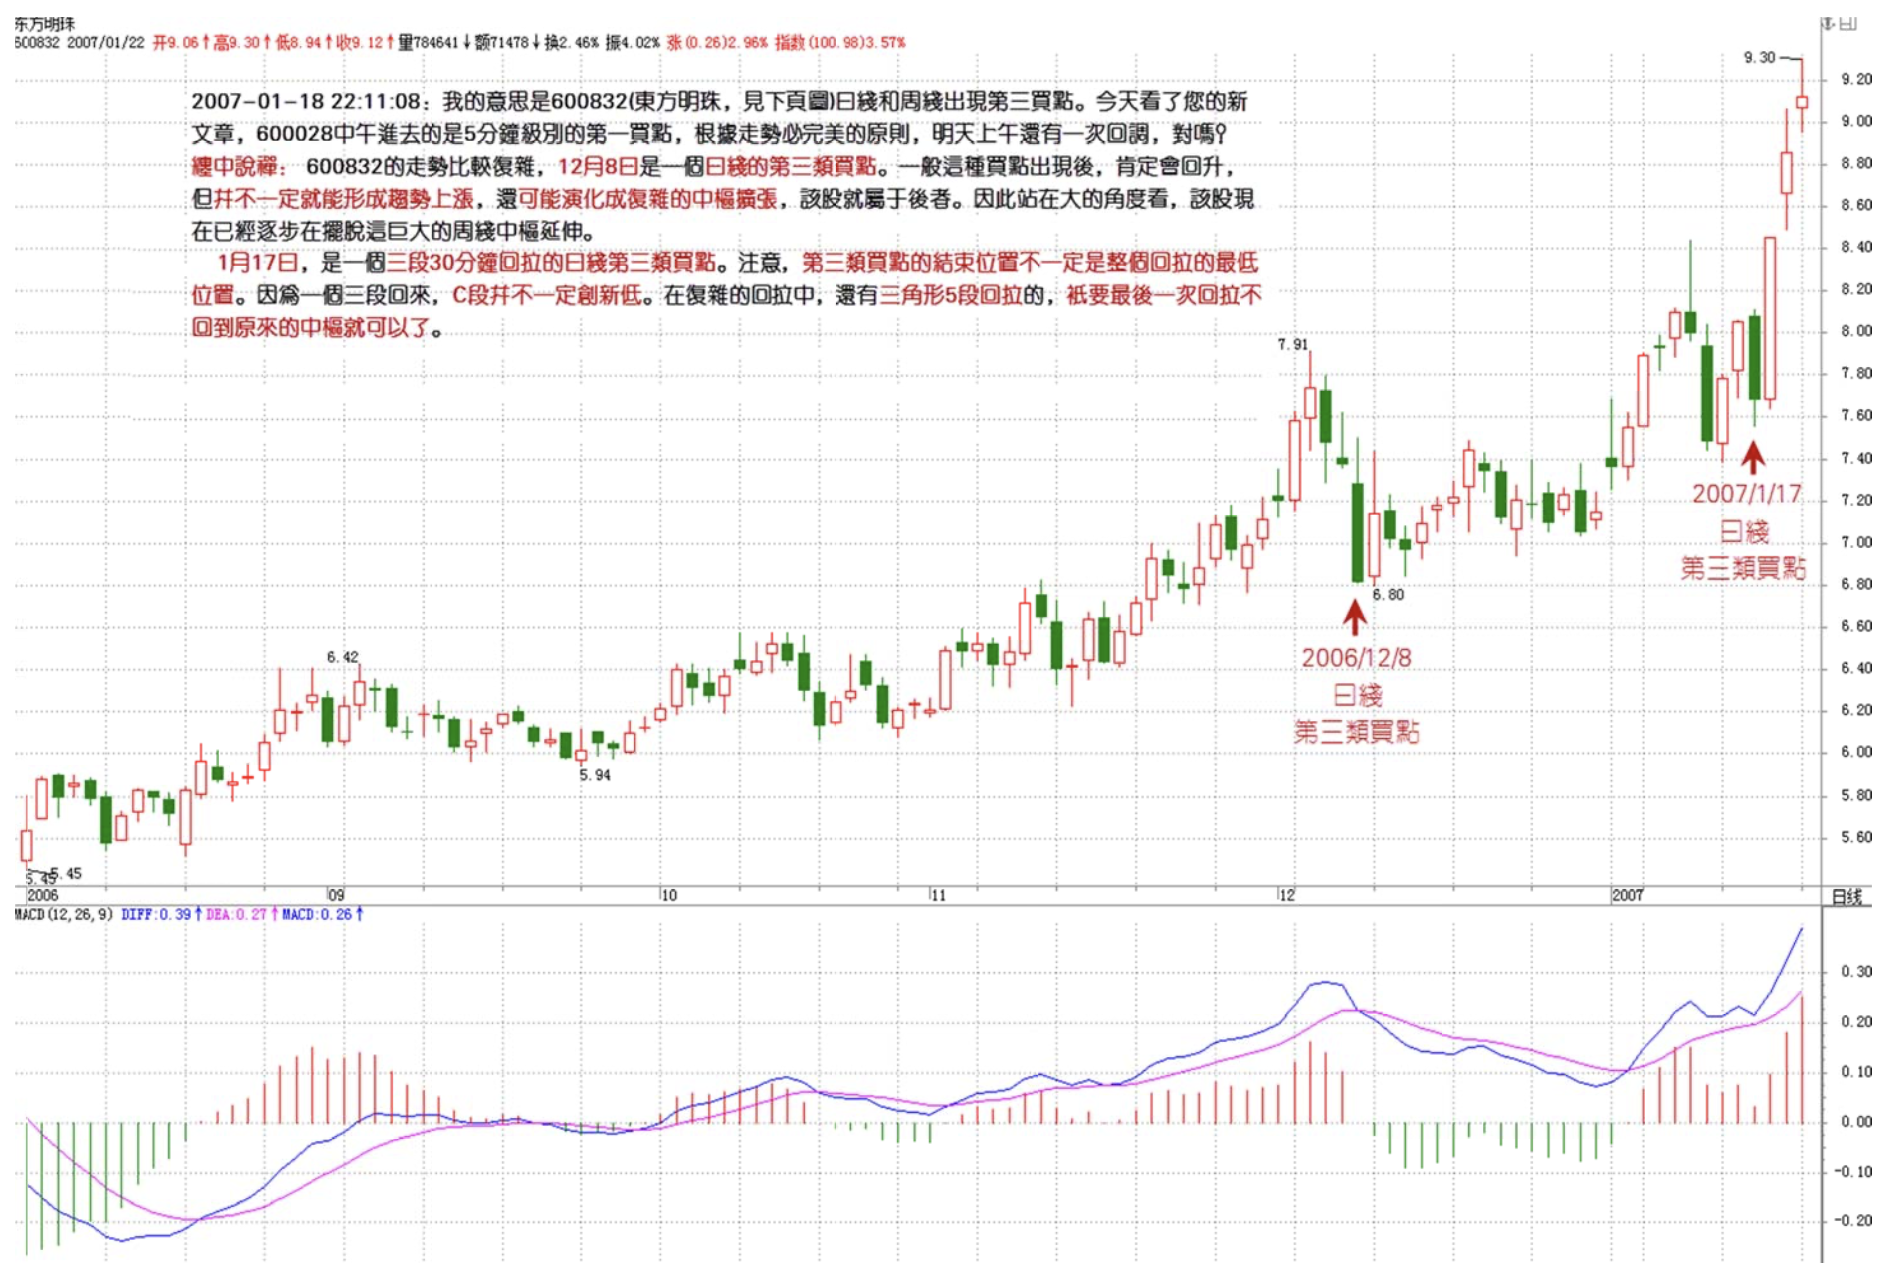
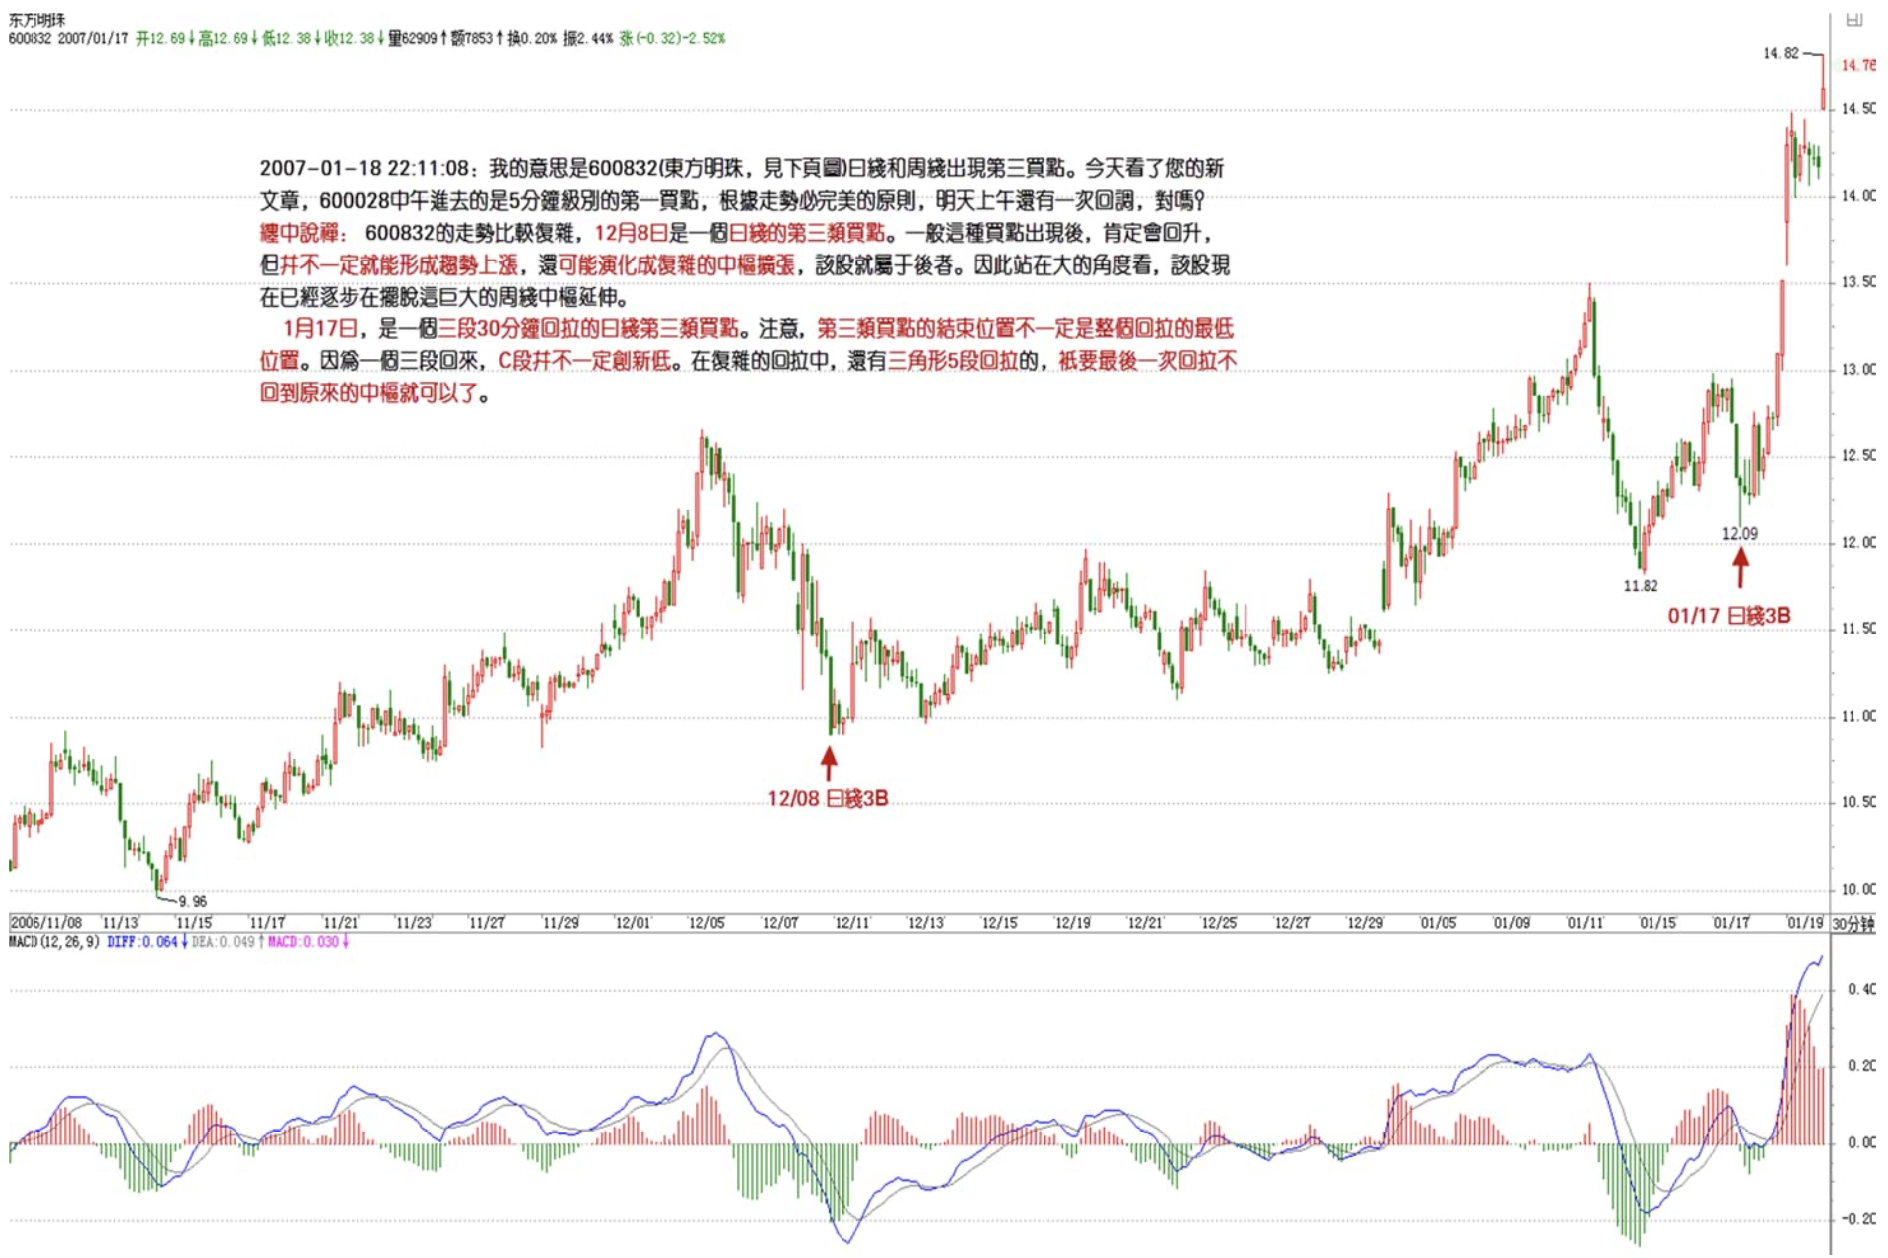
600832's trend is relatively complex. December 8 is a daily third-type buy point. Generally after this kind of buy point appears, there will certainly be a rally. But it doesn't necessarily form a trend rise — it could also evolve into complex hub expansion. This stock falls into the latter category. So from a larger perspective, this stock is gradually breaking free of this massive weekly hub extension.
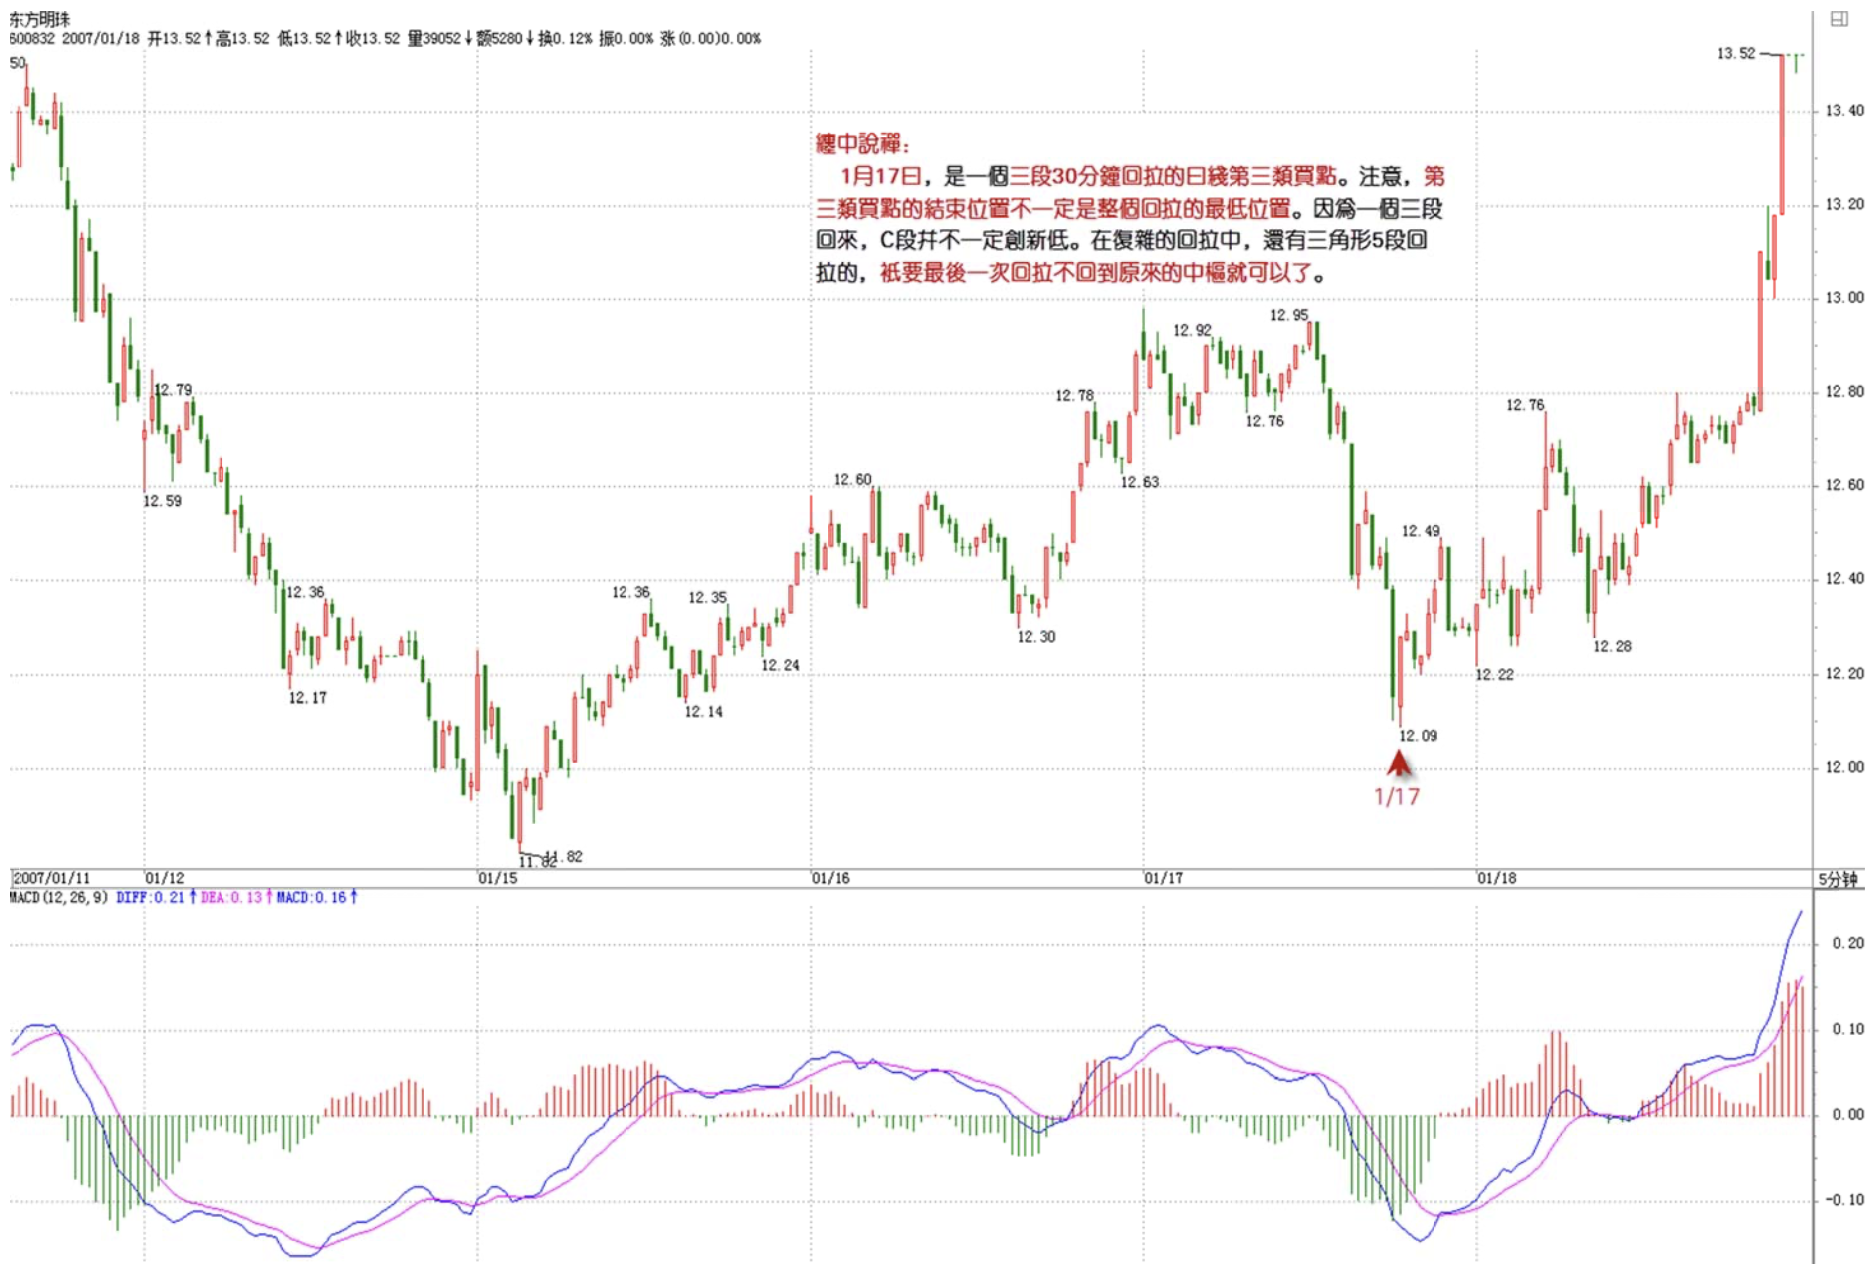
January 17 is a daily third-type buy point with three 30-minute segments pulling back. Note: the ending position of a third-type buy point isn't necessarily the absolute lowest point of the entire pullback, because in a three-segment return, segment C doesn't necessarily make a new low.
In complex pullbacks, there are also triangular five-segment pullbacks — as long as the final pullback doesn't return to the original hub, it's fine.
Oriental Pearl (600832)
缠中说禅 2007/1/18 22:14:31
[Anonymous] 勇敢的心
2007-01-18 21:48:42
Chan: if it didn't make a new high at the time, does that mean it's not divergence, because it hadn't formed a trend yet?
===
Even with a new high it's not necessarily a trend — you need to clearly distinguish the concepts. That's why there's also consolidation divergence judgment.
缠中说禅 2007/1/18 22:20:10
[Anonymous] 勇敢的心
2007-01-18 21:45:51
May I ask Chan: today at 11:20 I identified a 5-minute divergence on 600198, so I sold 600198 at 17.6 in the afternoon — was that correct?
==
There's no divergence on the 5-minute — barely on the 1-minute. Why "barely"? Because currently we can only see the lowest 1-minute resolution. Today, this stock had a momentary high above 18 yuan at the opening instant. To reflect this kind of movement, you'd need a 1-second chart for precision. Since exchanges don't provide such charts, in some ultra-rapid movements, even the 1-minute chart will show some distortion. This isn't a problem with the theory, but with exchanges not providing the most detailed data.
Generally speaking, the most precise, lowest-level chart would be every transaction plotted in sequence. The 1-minute chart we currently look at is already somewhat crude. But for larger-scale movements, the impact is minimal.
缠中说禅 2007/1/18 22:23:32
[Anonymous] 大风
2007-01-18 22:19:57
Teacher, let me ask a question
Can't I just look at the daily chart?
If so, then how do you understand Chán Zhōng Shuō Chán trend hub: within a certain level's trend type, the part overlapped by at least three consecutive sub-level trend types.
Isn't the sub-level of the daily chart the 30-minute chart?
Please answer, teacher — even though the question is a bit naive, I really want to know
Sigh````````````````````````````````you just won't answer me, what can I even do about it, so painful
===
Of course you can, but the premise is you never play short-term trades and only go after mega-scale moves — meaning only major bull markets, holding from bottom all the way to the top. For medium-term adjustments, many judgments require the sub-level chart, even the sub-sub-level chart. For some rapid movements, like real estate stocks these past two days, if you don't look at 5-minute or 30-minute charts, the reversal warnings are completely invisible.
缠中说禅 2007/1/18 22:25:07
Gan Tang
2007-01-18 22:20:33
On 000989's daily chart from October 23rd onward, there should be very obvious divergence — the triangles getting smaller and smaller, right?
===
A triangle with no new highs — how could there be divergence? First get the concepts clear.
缠中说禅 2007/1/18 22:29:11
[Anonymous] 咕咚
2007-01-18 22:15:21
Xintian International 5-minute chart
- From January 16 09:35 to 17th 9:55, a hub formed before segment A;
- From January 17 9:55 to 17th 13:00, the upward segment A formed;
- From January 17 13:00 to 18th 10:15, a hub formed as segment B;
- From January 18 10:15 to 18th 10:45, segment C formed;
- Comparing segment C to segment A, divergence appeared at around 7.8 yuan;
But no significant decline followed — instead it hit the daily limit up before the close.
My analysis above must have gone wrong somewhere. I suspect segment B's hub wasn't clearly formed.
Is this the case? How can this kind of situation be prevented?
________________________
The high and low points of the 5-minute movements on January 17-18 overlap with each other, so it can only be considered hub extension and no divergence actually formed?
Chan sister, is that correct?
===
First get clear on the difference between divergence and consolidation divergence. Then carefully study the situation about Vanke's third-type buy point in the article above.
缠中说禅 2007/1/18 22:40:17
Everyone —
You must first distinguish between trends and consolidation, then get clear on divergence versus consolidation divergence. The three scenarios within consolidation divergence — especially the situation where a third-type buy point forms — must be thoroughly understood. Note: after consolidation divergence, a massive drop doesn't necessarily follow — otherwise how could the third-type buy point scenario even exist? Whereas divergence produced within a trend must at minimum pull back into segment B's hub — so you can know in advance the minimum decline.
Furthermore, the intensity of a divergence-induced pullback is closely related to level. If the daily chart is in the middle of a rise that's just getting started, with MACD just making new highs and red bars extending vigorously, then even if divergence appears on the 5-minute chart, its downward force is obviously limited — so you can only play small short differences, or even ignore it. But in the final stage of a daily trend, especially during an extension phase of the rise, a single 1-minute divergence is enough to trigger a crash. So this must be examined comprehensively across multiple levels. You absolutely cannot dump everything the moment you see divergence and wait for a 50% drop — where in the world does that happen?
All right, everyone study well. First get the most fundamental things clear. Signing off, goodbye.
缠中说禅 2007/1/18 15:13:08
There's not much to say about today's broad market. ICBC's breakdown is to complete the third segment of the trend, so it's perfectly normal. When this segment completes, the second segment of the weekly-level hub will emerge.
On the individual stock front, still mid-to-low-priced stocks. No need to mention pharmaceuticals and spirits — agriculture, environmental protection, automobiles, technology, etc. will all perform.
Note: China's greatest abundance is people. Anything related to having lots of people will be exploited — like the spirits.
Under current circumstances, individual stocks are far more important than the index.
ICBC (601398)