Waiting for That Much-Anticipated Weekly Slump
2007/9/18 15:53:21
First, it must be declared that what this ID talked about yesterday was donkeys — it has nothing to do with any stock. As for certain boring stocks that happened to produce boring moves like hitting the daily limit, that has absolutely nothing to do with this ID. This ID never recommends any stock here. At most, it's just some mumbling in a dream. If this ID were to recommend something, recommending donkey-meat fire-buns would be more practical.
The current movement is extremely simple: it's a question of whether it's a true breakout or a false breakout. Generally speaking, if it's false, the verdict comes within three or four days — first a couple of doji stars or something similar, then a feint followed by a downward plunge. If following this script, around Thursday would be the day for the dive. Moreover, right now there's a weekly slump every week — once it slumps, everyone feels refreshed, and then you go about your business.
Of course, using this ID's theory, there's none of this hassle, and you absolutely don't need to proclaim nonsense like "this is the top of the century." If you operate on the 30-minute level, what tops and bottoms? As long as you follow the rhythm and never participate in 30-minute-level declines, then in your eyes the world has only three types of activity: 30-minute-level rises, consolidation, and declines. Century tops, walking through fire and over blades — you can still roam free through it all. The same applies to operations at other levels.
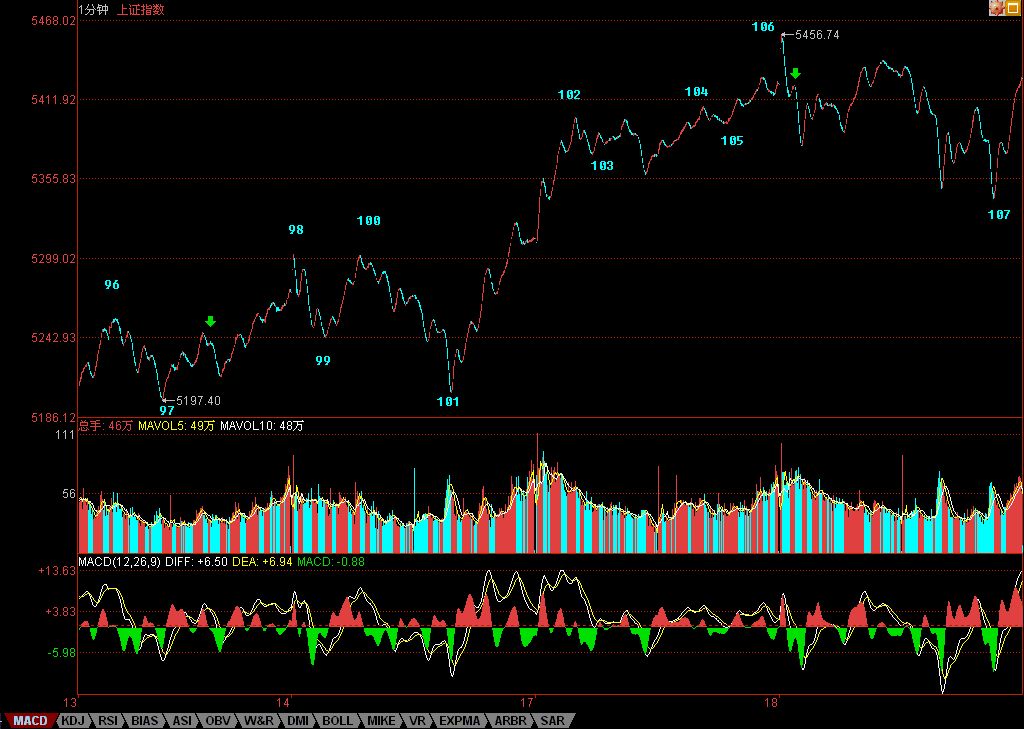
The current situation is very simple. For short-term traders, we're still in the hub oscillation of the original 5-minute hub from candles 76-85. The only question now is whether a third-type buy point for this 5-minute hub appears. If it doesn't appear, then the hub oscillation continues — and at that point, this 5-minute hub would expand into a 30-minute hub oscillation, which would be even more interesting.
For ultra-short-term traders, the answer to yesterday's question is right there in the chart — those who can't figure it out, please study it carefully. Currently, it's a hub oscillation of candles 102-105. Note that the current move departing from the original 5-minute hub hasn't been completed yet, so it's not yet a pullback. Today's oscillation low was just above 78, which shows that this hub oscillation isn't just empty talk — even at such a distance, it still exerts its influence.
On individual stocks, nothing much to say. Even if it's a false breakout, as long as this large hub oscillation exists, individual stock opportunities remain abundant. Before the holiday, there's again the tedious question of whether to hold stocks or hold cash — the key is still your operating level and the performance within that level. For those who are completely unfamiliar with this ID's theory, just watch the 5-day or 5-week moving average, especially the 5-week moving average — this is the key for the medium and short term.
There's some boring pipeline from Xinjiang about to be listed that I need to discuss soon. Can't answer questions anymore. Heading off now, see you.