A Quiz for Everyone — All Who Have Time, Please Come In
2007/7/17 22:34:40
Got back late, tired, don't feel like writing an article. So let's just have a quiz instead. By the way, yesterday's lesson should have been numbered 65 — I made an error in haste and have already corrected it.
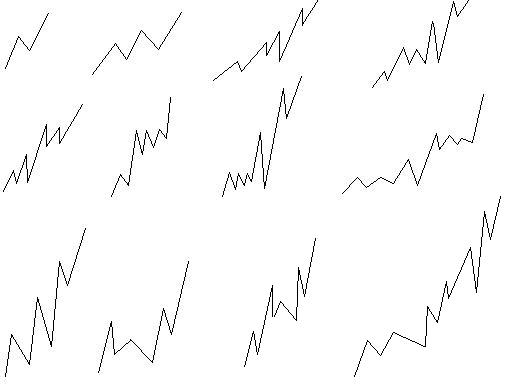
Please look at the diagram below containing 12 types of trends, where each stroke in each trend represents one stroke (bi) from an actual trend. The question is: how many of these constitute a line segment trend? Phrased differently: how many diagrams do not constitute a line segment, how many are exactly one line segment, and how many are at least two connected line segments?
The question is simple. Please examine carefully — these patterns are frequently encountered in actual trends. Additionally, distinguishing things like fractals, strokes, and line segments can only be done according to definitions — through continuous chart-reading until proficiency comes naturally. There is absolutely no other method. These have standard answers — definitions are the authority, and everything else is meaningless.
Furthermore, according to the strictest definitions, concepts like divergence can only exist after a minimum-level hub exists, which then gives rise to minimum-level trend types, which in turn give rise to divergence and similar concepts. Generally speaking, discussing divergence below the line segment level is meaningless. However, one can use force comparison methods analogous to divergence to discuss divergence-like phenomena below the line segment level — but this is different from actual divergence. When using the nested interval method to precisely locate buy/sell points below the line segment level, what's actually used is this force comparison of divergence-like phenomena. Generally speaking, for large capital, precise positioning doesn't need to go below line segment level — for instance, the 1-minute or even 30-minute level interval is precise positioning enough for large capital. Of course, for retail investors, using the divergence-like method, one can even pinpoint to a specific price on the stroke-level chart. But in actual operations this has little practical significance, especially for retail investors with poor execution channels — even if you see that price, you might not be able to execute at it. Therefore, don't use too low a level for operations — it's too exhausting, and especially meaningless today when transaction costs have increased dramatically.
Alright, this ID needs to rest. Everyone take your time answering the question. See you.