The Non-Question of "Who Am I? Where Do I Come From? Where Am I Going?"
2006/12/28 15:30:28
Who am I?
Where do I come from?
Where am I going?
Human rationality is nothing more than a series of brainwave games, and within this series of games there is a non-question of a question: "Who am I? Where do I come from? Where am I going?" This question supposedly has no standard answer. But in reality, apart from the imperial examinations and examination-style survival, what truly requires a standard answer?
Yet this question is not a particularly important question. A far more important question is: "Who is the one asking the question?" This question can be pursued infinitely—for example, "Who is the one asking who is asking the question?", "Who is the one asking who is asking who is asking the question?", and so on. This somewhat resembles the game that the little Qi Garden clerk surnamed Zhuang from the Warring States era played with a butterfly—a game that supposedly has something to do with dreams.
Su Dongpo said: "Life is like a dream." Of course, this simile was merely something the esteemed Su pilfered from the Diamond Sutra. "Who am I? Where do I come from? Where am I going?", "Who is the one asking who is asking the question?", "Who is the one asking who is asking who is asking the question?"—all of these are like nightmares. But whether nightmares or daydreams, they are nothing but brainwave games. Where is there any dream?
Then, when there are no dreams and no thoughts, who is the master? The mentally ill and those in vegetative states are not in a state of no dreams and no thoughts. And even if someone could truly be without dreams and without thoughts, with brainwaves completely stopped, physiological processes completely halted, and yet not dead—wouldn't that still be a world-shaking great dream of ignorance?
The true you has never experienced birth or death—what does birth and death have to do with you? What do the brainwaves of "Who am I? Where do I come from? Where am I going?", "Who is the one asking who is asking the question?", "Who is the one asking who is asking who is asking the question?" have to do with you? What does you have to do with you? The cosmos and universe are but a speck of dust in your heart—why torment yourself? And which heart is your heart, after all?
"You possess a bright pearl, long locked away beneath the dust of toil. Today the dust is cleared and light emerges, illuminating mountains and rivers in myriad blossoms." Don't let famous verses blind your eyes. What nonsense bright pearl—die away!
Replies
缠中说禅 2006/12/28 15:47:41
[Anonymous] lazycat588
2006-12-28 15:36:05
Top!
Just bought 580992 and got caught in a dive, depressed. By the time I recovered someone already grabbed the first comment.
Still depressed!
===
Warrants always dive before a major holiday—such an obvious pattern should have been known already. You can't mess around blindly in the stock market; you must be attentive. Wait until after the holiday—things will get better.
缠中说禅 2006/12/28 15:49:57
[Anonymous] 白纸
2006-12-28 15:37:44
Chan mm, in the "Chán Zhōng Shuō Chán trend hub" theorem, does "sub-levels and below" include the sub-level itself? Thank you!
Glad to see a new article!
===
Of course it includes it.
Note:
Hubs and consolidations are not the same thing. Of course, since consolidation has only one hub, it's easy to confuse them.
缠中说禅 2006/12/28 15:56:20
[Anonymous] 白纸
2006-12-28 15:48:40
Chan mm, isn't it too late to buy component stocks now? I've been busy for two months and still haven't gained anything! Haven't gotten started with the "Teaching You to Trade Stocks" series either.
=========
This ID emphasized this issue repeatedly long ago—go back and look at the 1996 price action of 000019.
Everyone, pay attention to this rhythm. The top 50 stocks will definitely step up to a new level first, then the remaining 250 out of the 300 will catch up. This rhythm can be grasped.
As for third-tier stocks, they'll catch up even later.
A bull market is actually the simplest: each stage has a leading sector, and everything else plays catch-up.
The leading sector of the first stage is component stocks.
The second stage is growth stocks—that's a matter for later.
The third stage is restructuring stocks—that's the last supper. Will appear in N years.
We're just at the beginning of the bull market. If you haven't made money yet, don't worry—once the direction is clear going forward, opportunities will be more than you can keep up with.
缠中说禅 2006/12/28 15:58:09
[Anonymous] Heart Zen
2006-12-28 15:44:44
"Zen Master," good afternoon. Today's market is exactly as you said—only the top 50 blue chips are surging while everything else falls! I've spent the past two days just reading, studying, and trying to understand the two most recent articles. I don't fully understand yet—could you give another practical example?
Also, I couldn't resist asking, "Zen Master": I've been stuck in 600779 for a long time and am wounded badly. Looking at its 30-minute chart, has it already formed three consecutive trend movements and produced a hub? Should it go up next?
====
The ones that fell will catch up, but they still can't compare to the leaders. That's why in a bull market you must always hold the leading stocks of each stage.
缠中说禅 2006/12/28 16:05:28
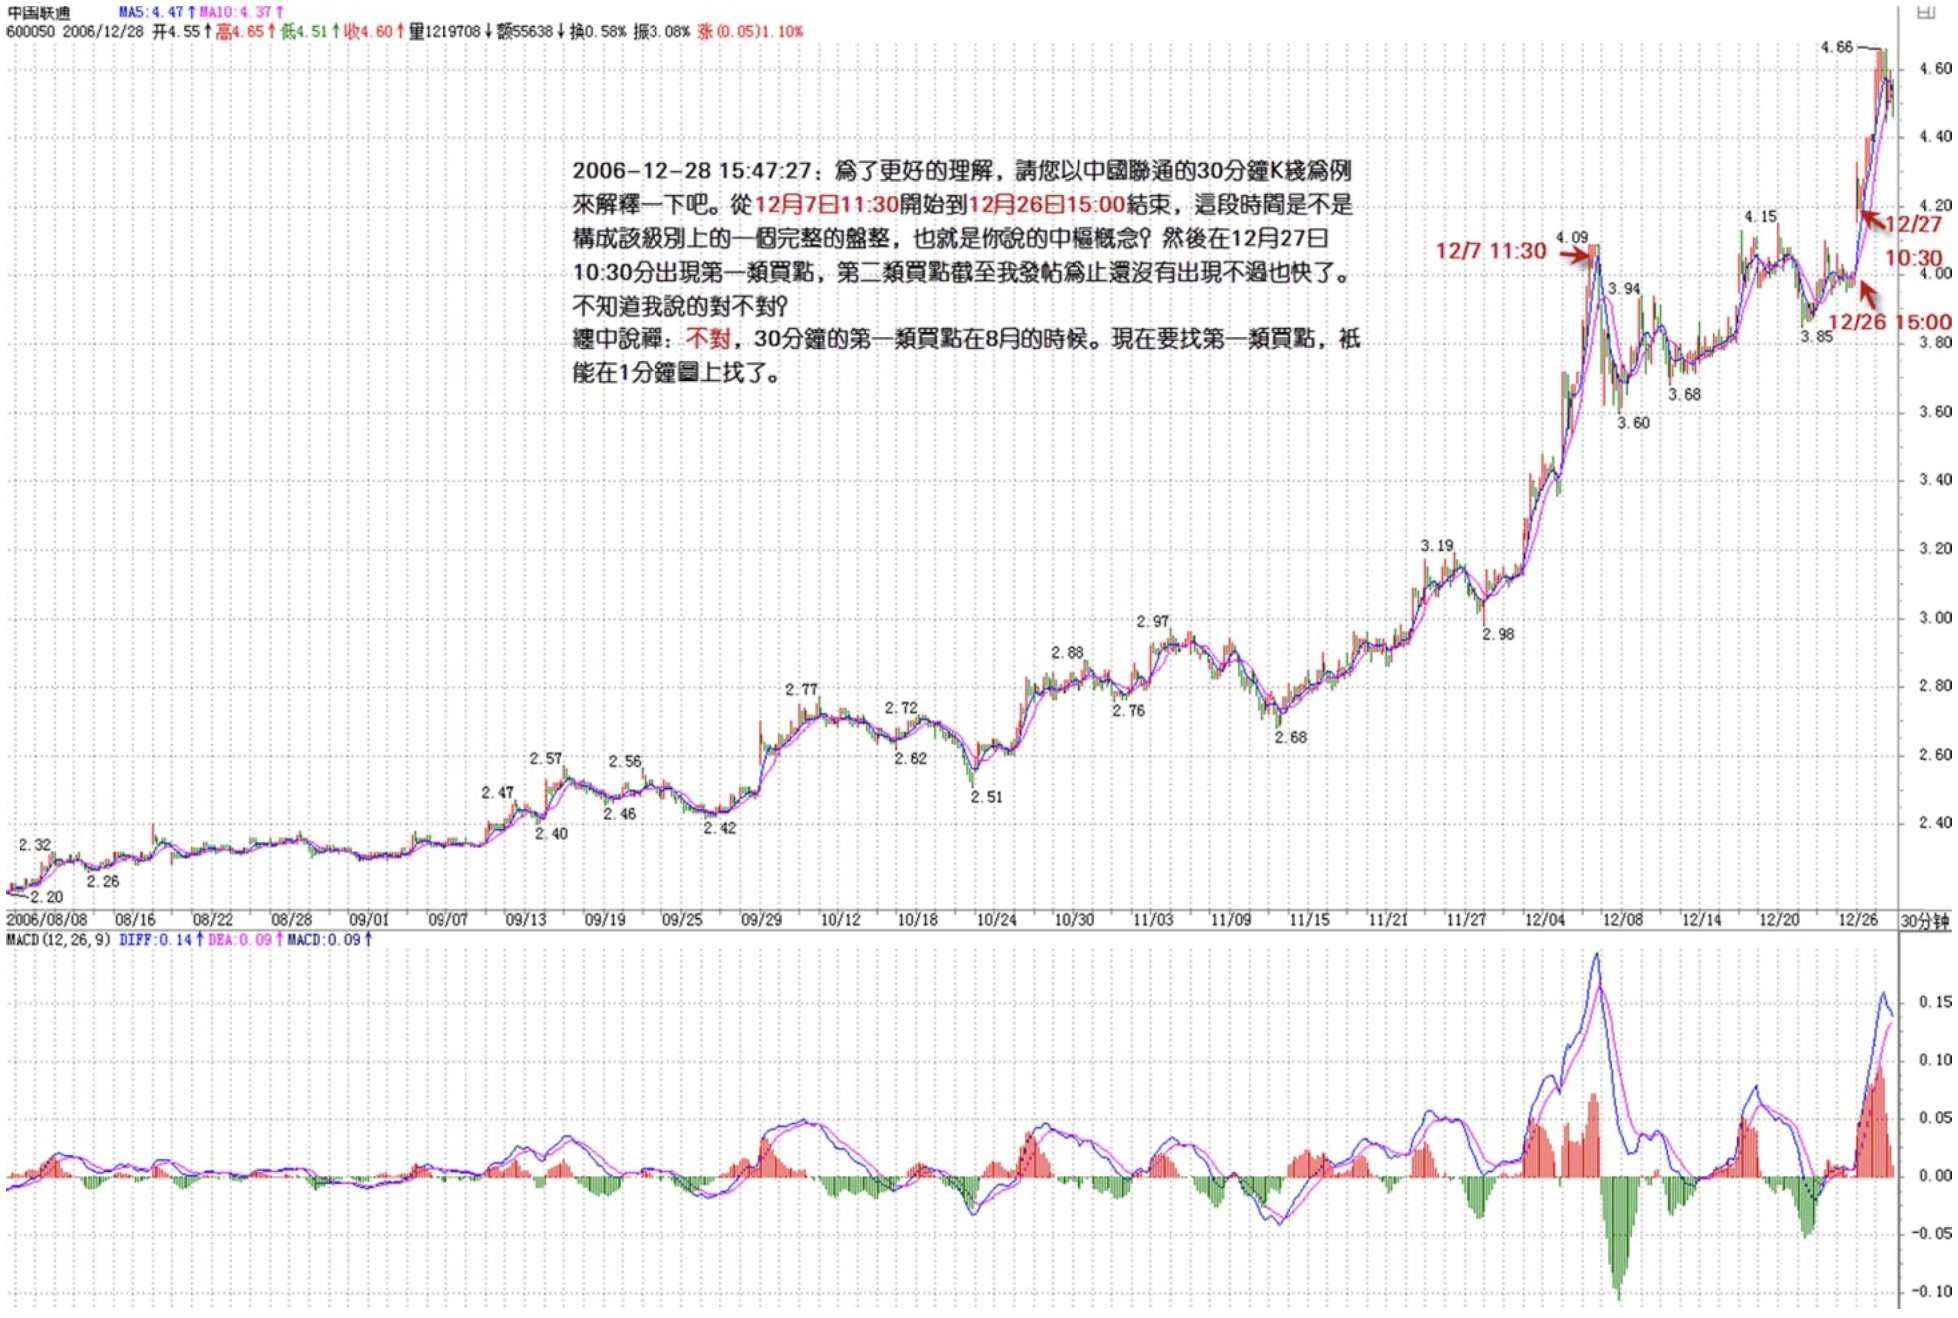
Xiao Ming
2006-12-28 15:47:27
I'll move my question from the previous post over here:
To better understand, could Chan mm please use the 30-minute K-line of China Unicom as an example to explain?
From 12/7 11:30 to 12/26 15:00, does this period constitute a complete consolidation at that level, i.e., the hub concept you described?
Then on 12/27 at 10:30, the first-type buy point appeared, and the second-type buy point hasn't appeared yet as of this posting but should be coming soon.
Am I correct?
===
Incorrect. The 30-minute first-type buy point was back in August. To find first-type buy points now, you can only look on the 1-minute chart.
Also, I bought 601333 today. Can Chan mm comment on the outlook?
==
This ID also holds that stock, though it was bought a couple of days ago. This ID has no interest in predicting price movements. The only thing this ID does is wait for the sell signal to appear.
缠中说禅 2006/12/28 16:12:34
[Anonymous] 学习
2006-12-28 15:52:51
[Anonymous] aa
2006-12-28 15:36:45
What nonsense
===========
I feel that on the 30-minute chart, Oriental Pearl has formed a hub between 11.53 and 10.97. It's currently moving within the hub.
Not sure if this is correct—let's discuss.
===
Note this issue: a hub is defined by the first three sub-level movements. What comes after is an extension of the trend type. In the extension of a consolidation trend type, the movement pattern is oscillation around that hub. Please clarify this issue before proceeding with further analysis.
Please continue your analysis.
缠中说禅 2006/12/28 16:24:22
[Anonymous] 白纸
2006-12-28 16:13:02
Chán Zhōng Shuō Chán
This ID also holds that stock, though it was bought a couple of days ago. This ID has no interest in predicting price movements. The only thing this ID does is wait for the sell signal to appear.
===
According to what Chan mm said, this stock only broke through its IPO-day high yesterday!
===
Different capital sizes require different timing for operations. If this ID, with such large capital, also entered after the breakout, others would trap this ID and force me into becoming a market maker. This ID has no interest in being a market maker. Of course, this ID doesn't enter every new stock on the second day after listing. Right now it's the era of super-large-cap stocks—cheap shares can't be let others grab them, or it would affect one's position in the industry.
But for retail investors, entering after the breakout is beneficial—it greatly improves your capital utilization rate.
缠中说禅 2006/12/28 16:28:15
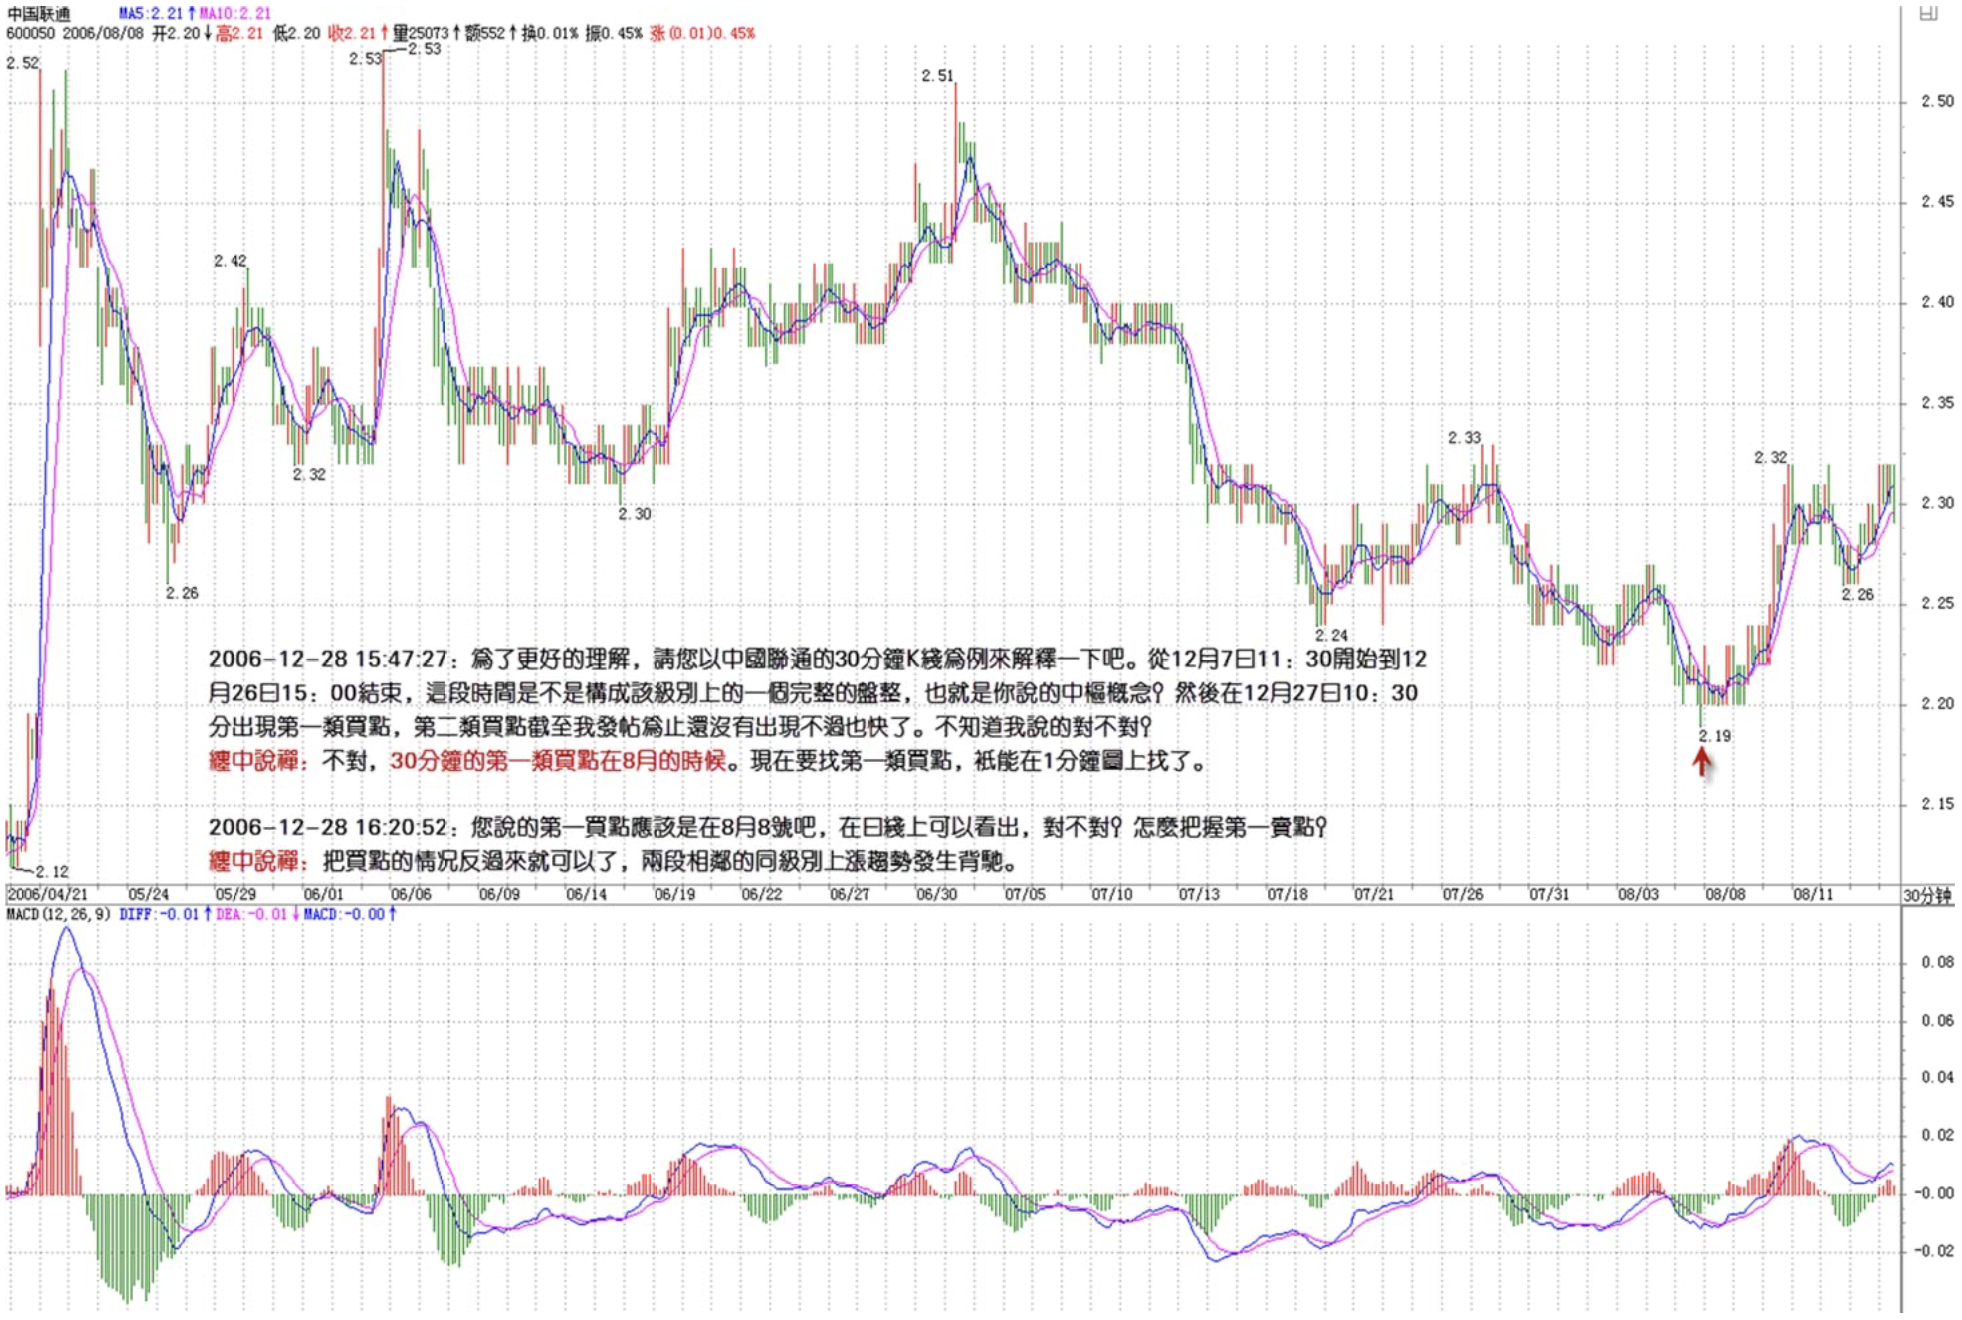
[Anonymous] iris
2006-12-28 16:20:52
"Incorrect. The 30-minute first-type buy point was back in August. To find first-type buy points now, you can only look on the 1-minute chart."
==================================================
Chan jie, the first buy point you mentioned should be around August 8th, right? It can be seen on the daily chart, correct? And Chan jie, how do you identify the first sell point?
===
Reverse the buy point situation—divergence between two adjacent same-level uptrend segments.
缠中说禅 2006/12/28 16:33:16
[Anonymous] Heart Zen
2006-12-28 16:26:47
"Note this issue: a hub is defined by the first three sub-level movements. What comes after is an extension of the trend type. In the extension of a consolidation trend type, the movement pattern is oscillation around that hub."
"Zen Master," from the above, does it mean that after the hub, if the trend continues to extend, it's consolidation? But what signal marks the end of this oscillating consolidation movement around the hub? You mentioned before that the turning point after consolidation is key.
===
A trend type containing one hub is consolidation, but consolidation can keep extending, continuously oscillating around the hub—this is called extension of consolidation.
Similarly, trends can also extend. Study lessons 17 and 18 carefully—it's all in there.
缠中说禅 2006/12/28 16:37:02
[Anonymous] 学习
2006-12-28 16:30:14
For 600832's 30-minute hub, do I overlap it with the 5-minute chart movements, then look at the first three segments of the 5-minute chart? That would make the hub range between 11.40 and 11.13—is this understanding correct?
On the 30-minute chart, I'm referring to the range from 12/11 to 12/19.
===
There is only one price action; there can be many charts of that action. Looking at it on a 30-minute chart gives you the 30-minute view; looking at it on a daily chart gives you the daily view. But the price action is only one, composed of continuous trades. Only successive, different trend movements can overlap—there's no overlapping between 30-minute and 5-minute.
You can say that certain three segments on the 5-minute chart overlap, but you cannot say the 5-minute and 30-minute overlap.
缠中说禅 2006/12/28 16:40:21
[Anonymous] 白纸
2006-12-28 16:31:15
[Anonymous] 小溪
2006-12-28 16:27:02
Hello Chan jj! On a single chart (such as a daily K-line chart), do trend movements also have different levels?
===
Of course there are different levels. Chan mm covered this previously.
===
This understanding is correct, but needs to be more precise. Price action is categorized by levels, but on a particular chart—say a 30-minute chart—daily-level action may only show up as connections of 30-minute movements, while 1-minute-level details won't be visible on the 30-minute chart. Looking at higher-level charts essentially filters out lower-level information.
缠中说禅 2006/12/28 16:48:30
Xiao Ming
2006-12-28 16:34:32
Based on Chan mm's analysis above, it looks like my purchase of 601333 today was correct. Hehe.
Isn't it the era of large-cap stocks now? My stock selection logic was simple: whichever had the largest trading volume. I narrowed it to three Shanghai market top-volume stocks: ICBC, China Unicom, and 601333. After much deliberation, I chose the last one. After all, it's a new stock with no accumulated gains. And getting in now means roughly the same cost basis as the market maker. Haha.
But, will there be a shakeout soon?
===
Any method can be right sometimes, but you must clarify its effective range. If all retail investors liked this method, market makers would be thrilled.
缠中说禅 2006/12/28 16:50:21
Signing off for now. More tonight. Goodbye.
缠中说禅 2006/12/28 20:29:57
[Anonymous] 戈石
2006-12-27 21:25:13
Dear blogger:
I'm studying diligently every day. Main takeaway: the first buy point—there's been real practical gains. I especially want to learn the Chán Zhōng Shuō Chán trend hub theory, which is the core issue when reading charts. At lesson 17, I thought I understood, but at lesson 18, problems arose: within a certain level's trend type, Chán Zhōng Shuō Chán trend hubs are intuitive and don't require looking at sub-level charts—just three overlapping segments. "Note: the first three sub-level trend types must all be completed before they constitute a hub at that level." Why emphasize "completed trend types"? If one of the three segments is not a completed trend type at the sub-level, then the three overlapping segments at this level can't form a Chán Zhōng Shuō Chán trend hub? Eagerly awaiting your answer!!!
===
How would you know what type an incomplete one will evolve into? For example, when the third one appears, the first two must be complete—otherwise there wouldn't be a third. But if the third one isn't complete—say at the 30-minute level, a gap at the most basic level appears, directly jumping outside the range of the first two types—there can't be overlap at all, and the hub can only form in subsequent price action.
An extreme example: a stock opens limit-up for 30 consecutive days—30 horizontal lines going up. On the daily chart, no hub can form; at most, 30 hubs form on the 1-minute chart. But 1-minute is not the sub-level of daily.
A daily hub can only form after the limit-up is broken and three completed trend types appear on the 30-minute chart.
缠中说禅 2006/12/28 20:34:01
[Anonymous] x股
2006-12-28 18:55:34
Blogger, I have a question—please advise.
On the daily chart, the curve formed by single daily K-line candles—is this the sub-level trend of daily level? In other words, do you use the hub formed by daily K-line curves to judge daily-level trends?
I always find levels hard to grasp—probably because I haven't studied enough charts and lack chart intuition.
Also, regarding the end of a trend, is it determined by whether a new hub forms in the same direction? So does that mean there's a hub at the end of every trend? And actually, the start and end of a trend are not necessarily defined by price, but can always be defined by hubs—is that correct?
===
A few daily K-lines cannot possibly form a daily hub. A daily hub can only be found on the 30-minute chart where three completed, overlapping trend types appear.
Forming a daily hub requires at least a dozen or so daily K-lines. If in an uptrend the 5-day moving average is never breached, a daily hub definitely cannot form—at most a 30-minute hub forms. This is the expression of strength. If the 5-day line isn't broken, the uptrend is very strong.
缠中说禅 2006/12/28 20:35:30
[Anonymous] 无言
2006-12-28 20:31:52
Chan jie, I wanted to grab the first comment today but you posted so late. I really have understood your concepts of trends and divergence. Starting from 002069, today I found a second-type buy point on the 30-minute chart for 002098, entered at 11.32, and got another limit-up. You haven't answered my posts the past few days. Sometimes when I understand something, I can't express it well. When Wang Yifu competes, he can't even see the bullseye—it's all just feel from years of training. I think there's no need to drag this out so long here. Just lay out all the theorems and let everyone practice in real trading—that's the only way to internalize it.
===
Everyone here is at different levels. Look how many people still haven't even grasped the most basic concepts. What's the use of going fast if people can't digest it?
缠中说禅 2006/12/28 20:42:17
[Anonymous] 插班生
2006-12-28 16:45:30
After repeatedly studying the hub concept, it seems three consecutive descending candles can form one, and three consecutive ascending candles can also form one. Is that correct?
In a trend, the smaller the hub value, the stronger the trend, and a gap is the strongest. Is that right?
I think I'm going mad studying this.
====
How could three consecutive declines work? Decline + decline is still a decline—it counts as only one trend type.
The smaller the level of hub the trend lingers at, the greater the trend's strength. A gap does not equal a hub—it's merely a connection at the most basic level. A gap indicates that the force leaving the original hub is relatively strong, but if a very large-level hub appears after the gap, it proves the strength was limited. The strongest scenario is, of course, when after a gap there's a 5-minute or even shorter hub before the trend continues—that's the strongest. For example, consecutive direct limit-up closings is the strongest. Why? Because the hubs after each gap are all at the 1-minute, most basic level.
This ID's theory can explain all kinds of phenomena. Everyone should also use their own brains—once you understand it, you can explain many phenomena yourself. That's how you develop a deeper understanding of the theory.
缠中说禅 2006/12/28 21:13:16
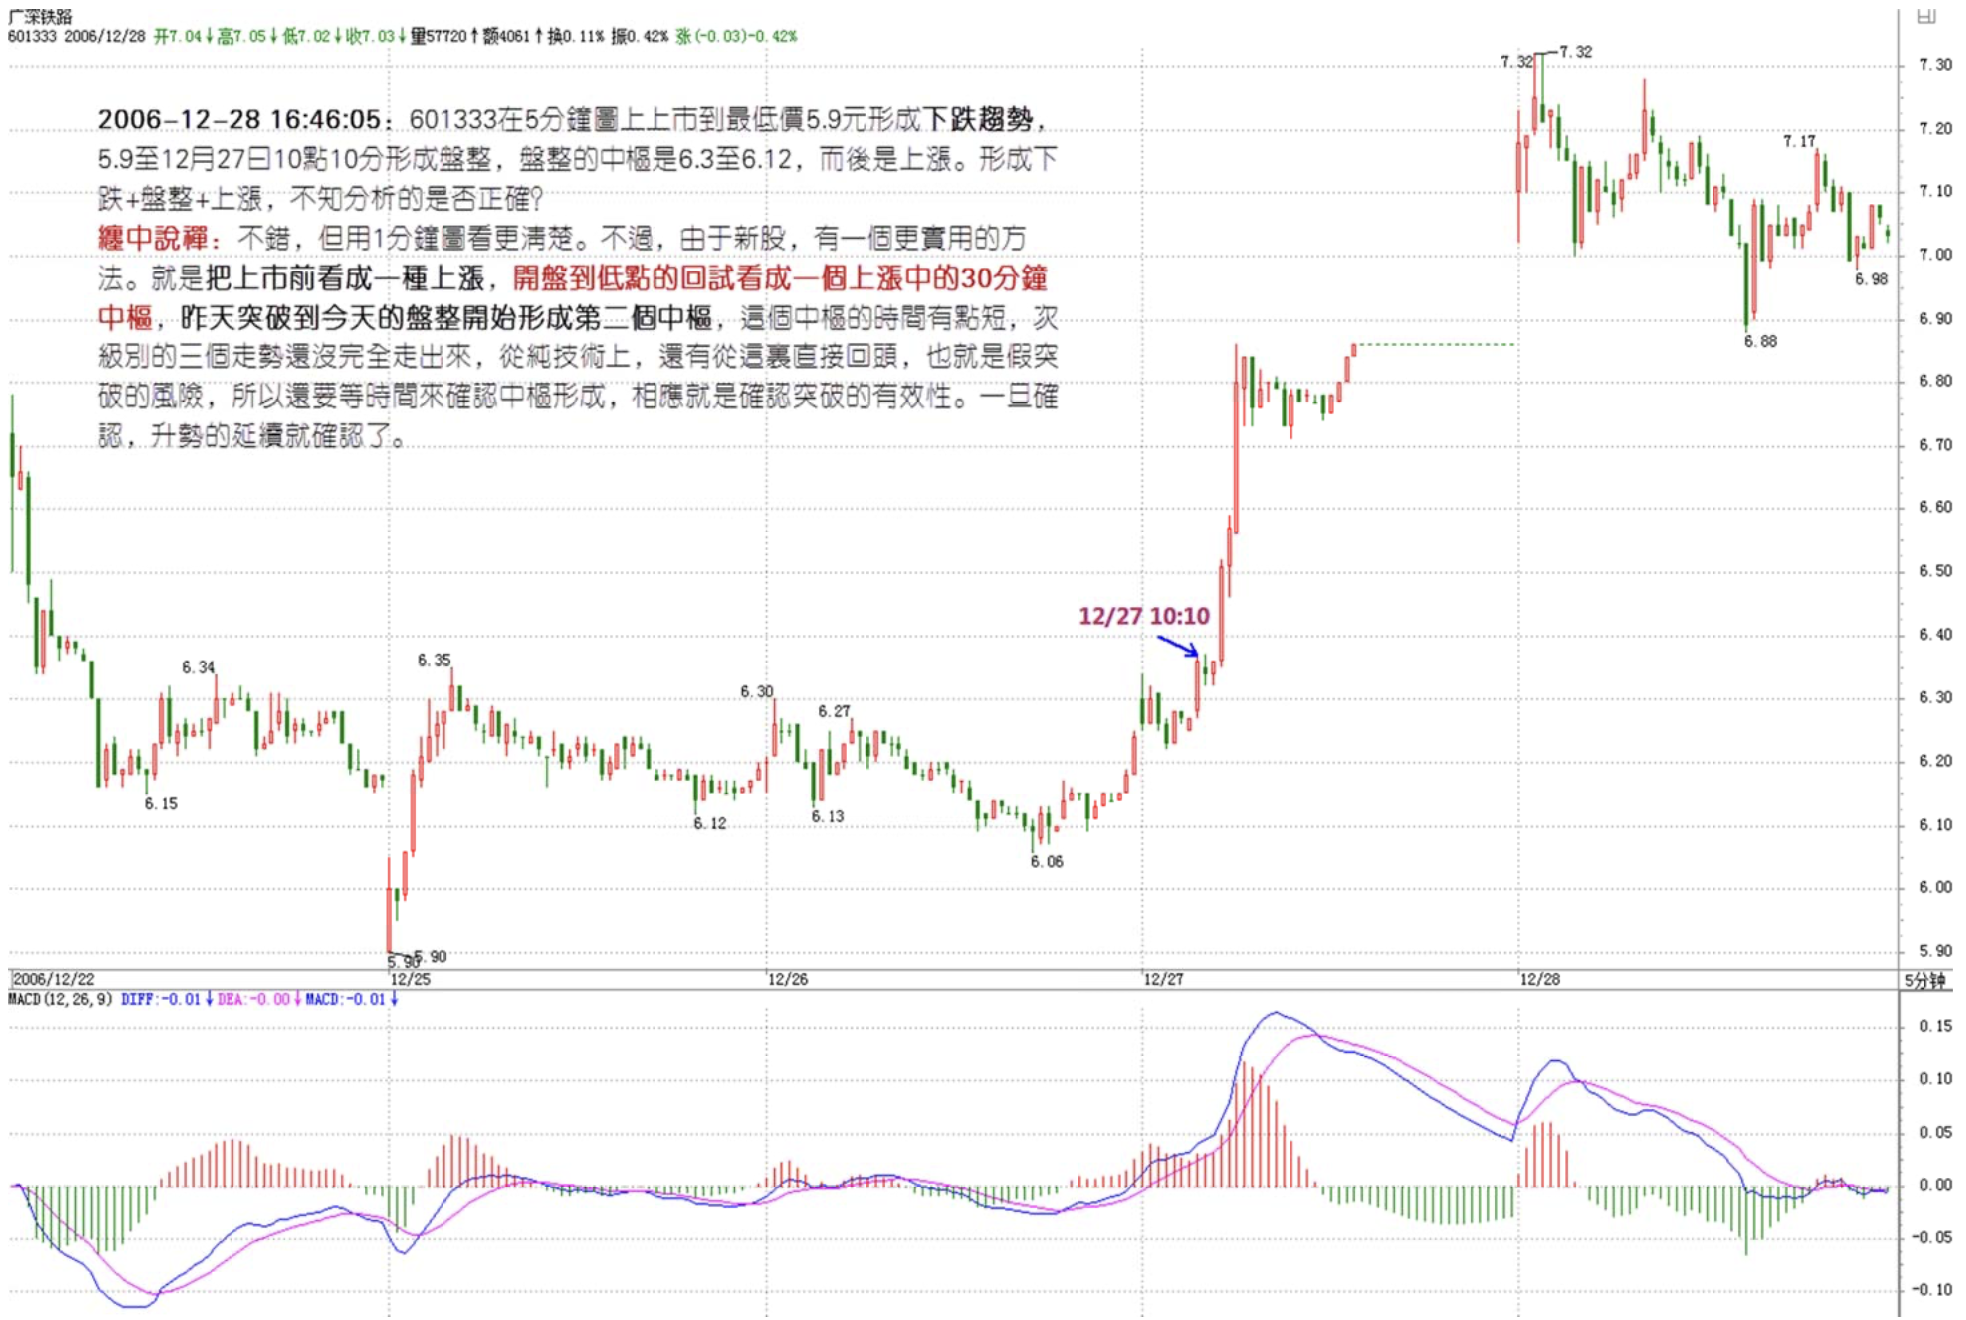
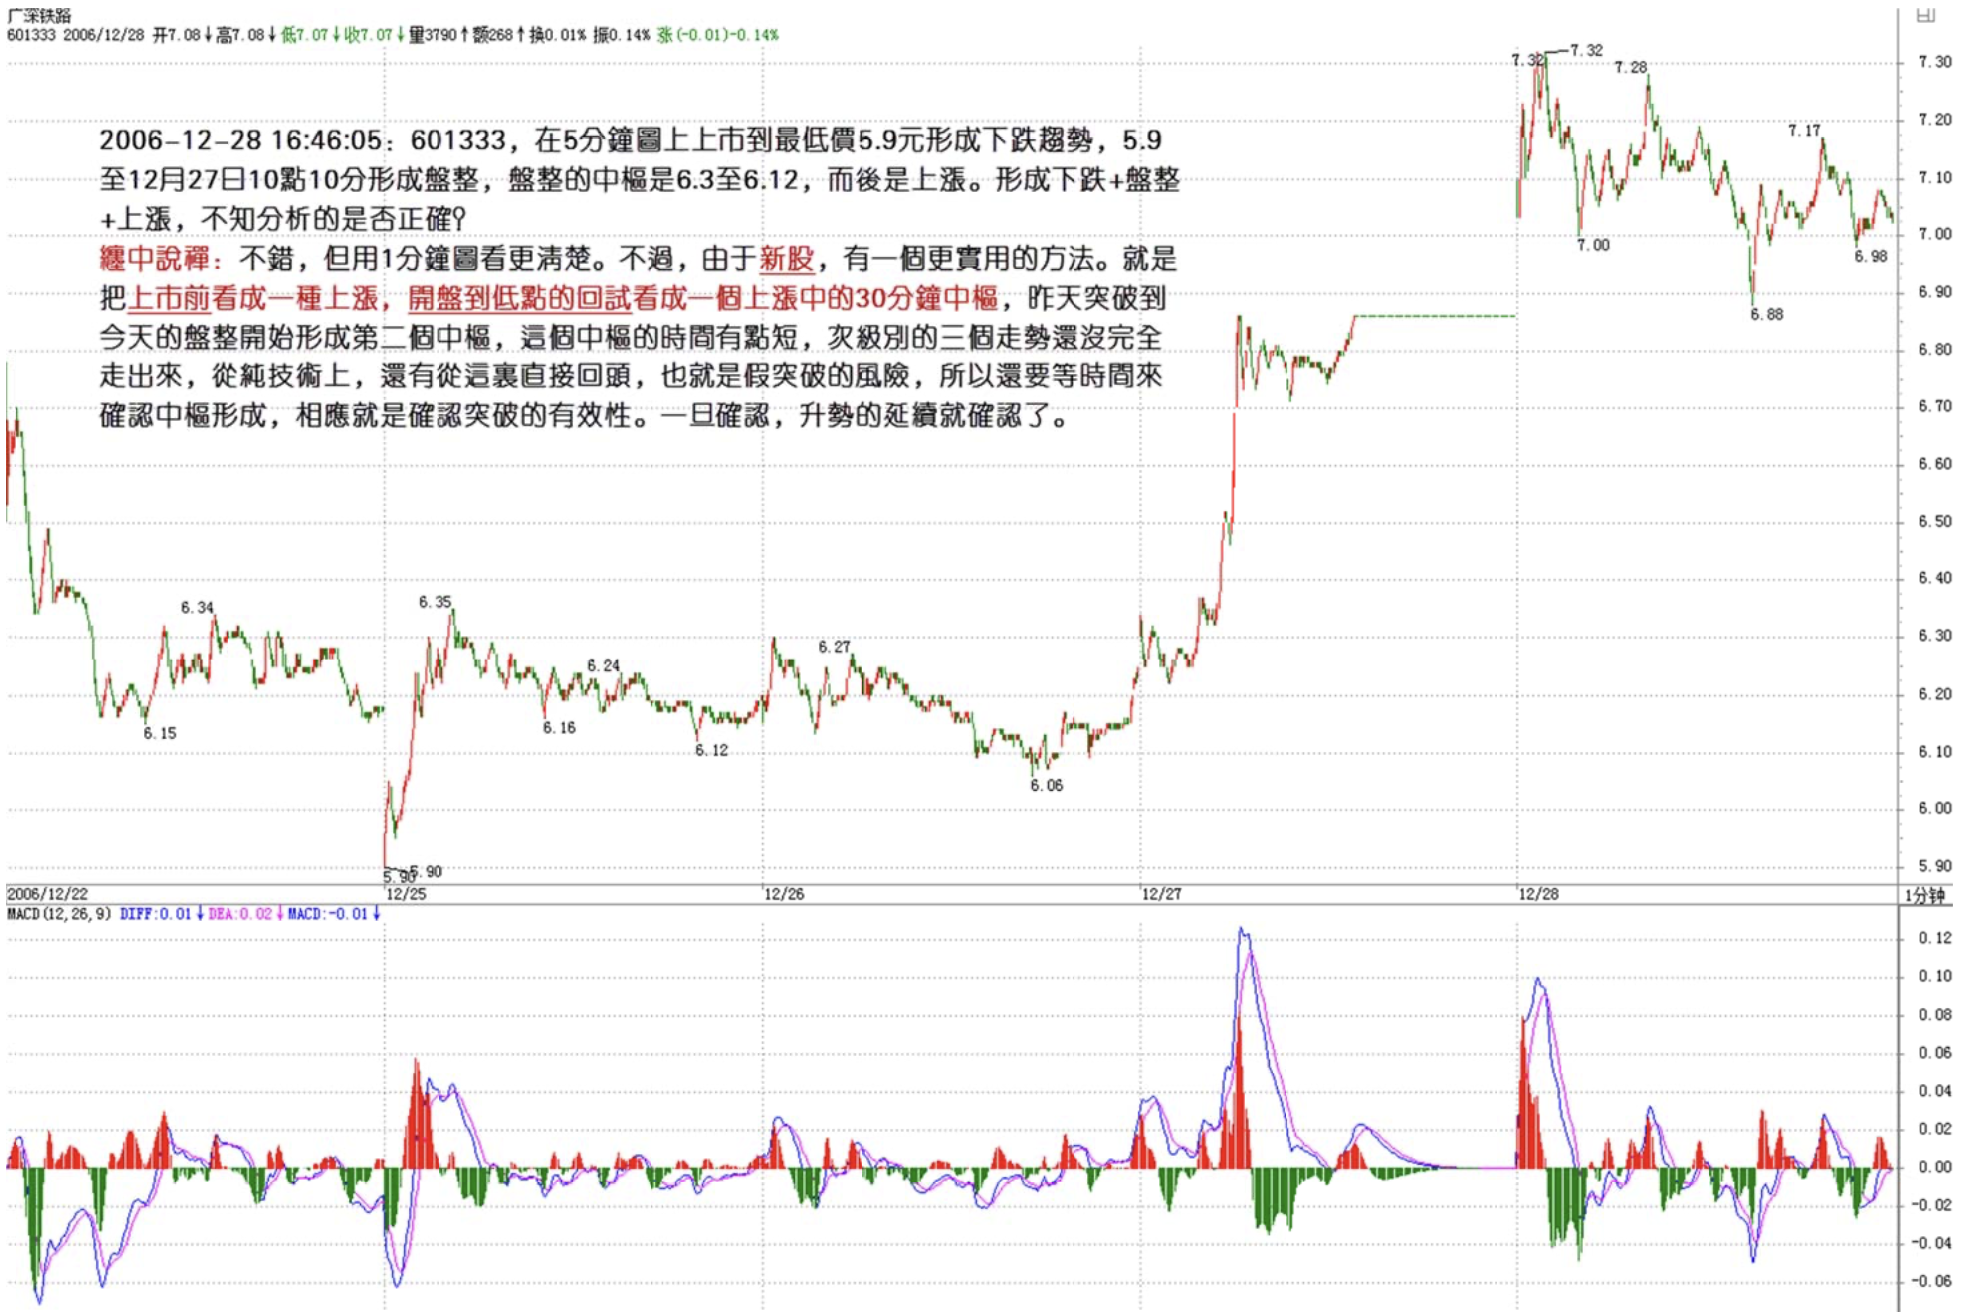
[Anonymous] 在路上
2006-12-28 16:46:05
Chan jie, on the 5-minute chart of 601333, from listing to the low of 5.9 there's a downtrend, from 5.9 to 12/27 at 10:10 there's consolidation, the hub range of the consolidation is 6.3 to 6.12, followed by an uptrend. Forming: downtrend + consolidation + uptrend. Is this analysis correct? Please advise.
===
Not bad, but it's clearer on the 1-minute chart.
However, since it's a new stock, there's a more practical method. Treat the pre-listing as a kind of uptrend. The pullback from the opening to the low point is a 30-minute hub within an uptrend. Yesterday's breakout through today's consolidation begins forming the second hub, but this hub's time is a bit short—the three sub-level trend types haven't fully played out yet. From a purely technical standpoint, there's still the risk of a direct reversal from here (i.e., a false breakout), so we need more time to confirm hub formation—which is confirming the validity of the breakout. Once confirmed, the continuation of the uptrend is confirmed.
缠中说禅 2006/12/28 21:14:43
[Anonymous] Leisurely
2006-12-28 20:42:37
Live in the present.
Here's a horizontal banner for you.
===
Is there any kind of living that isn't in the present? What do you need that nonsensical "present" for?
缠中说禅 2006/12/28 21:16:34
[Anonymous] 想飞
2006-12-28 21:07:43
"Note: hubs and consolidations are not the same thing. Of course, since consolidation has only one hub, it's easy to confuse them."
Blogger, could you elaborate on the difference?
Also, to determine whether a hub at this level has formed, must one look at the sub-level trends?
===
To determine a hub at this level, check whether three consecutive sub-level trend types produce an overlap. For the difference between hubs and consolidation, read their respective definitions and you'll understand.
缠中说禅 2006/12/28 21:17:34
[Anonymous] 在路上
2006-12-28 21:15:30
[Anonymous] 在路上
2006-12-28 16:46:05
Chan jie, on the 5-minute chart of 601333, from listing to the low of 5.9 there's a downtrend, from 5.9 to 12/27 at 10:10 there's consolidation, the hub range of the consolidation is 6.3 to 6.12, followed by an uptrend. Forming: downtrend + consolidation + uptrend. Is this analysis correct? Please advise.
============
On the 5-minute chart of 601333, from the high of 7.32 to now there's only one hub, range 7.14 to 7.06. It's currently still oscillating around the hub?
Please advise, Chan jie.
===
The answer is above.
缠中说禅 2006/12/28 21:19:56
[Anonymous] 水蒸气
2006-12-28 20:53:21
Chan jiejie, I'll buy some 601333 tomorrow too!
===
At this position, first confirm it's not a false breakout before making a move. See the analysis above.
缠中说禅 2006/12/28 21:30:41
[Anonymous] 小强
2006-12-28 21:18:59
[Anonymous] 天地e心
2006-12-28 00:28:34
[Anonymous] 插班生
2006-12-27 15:36:32
iris
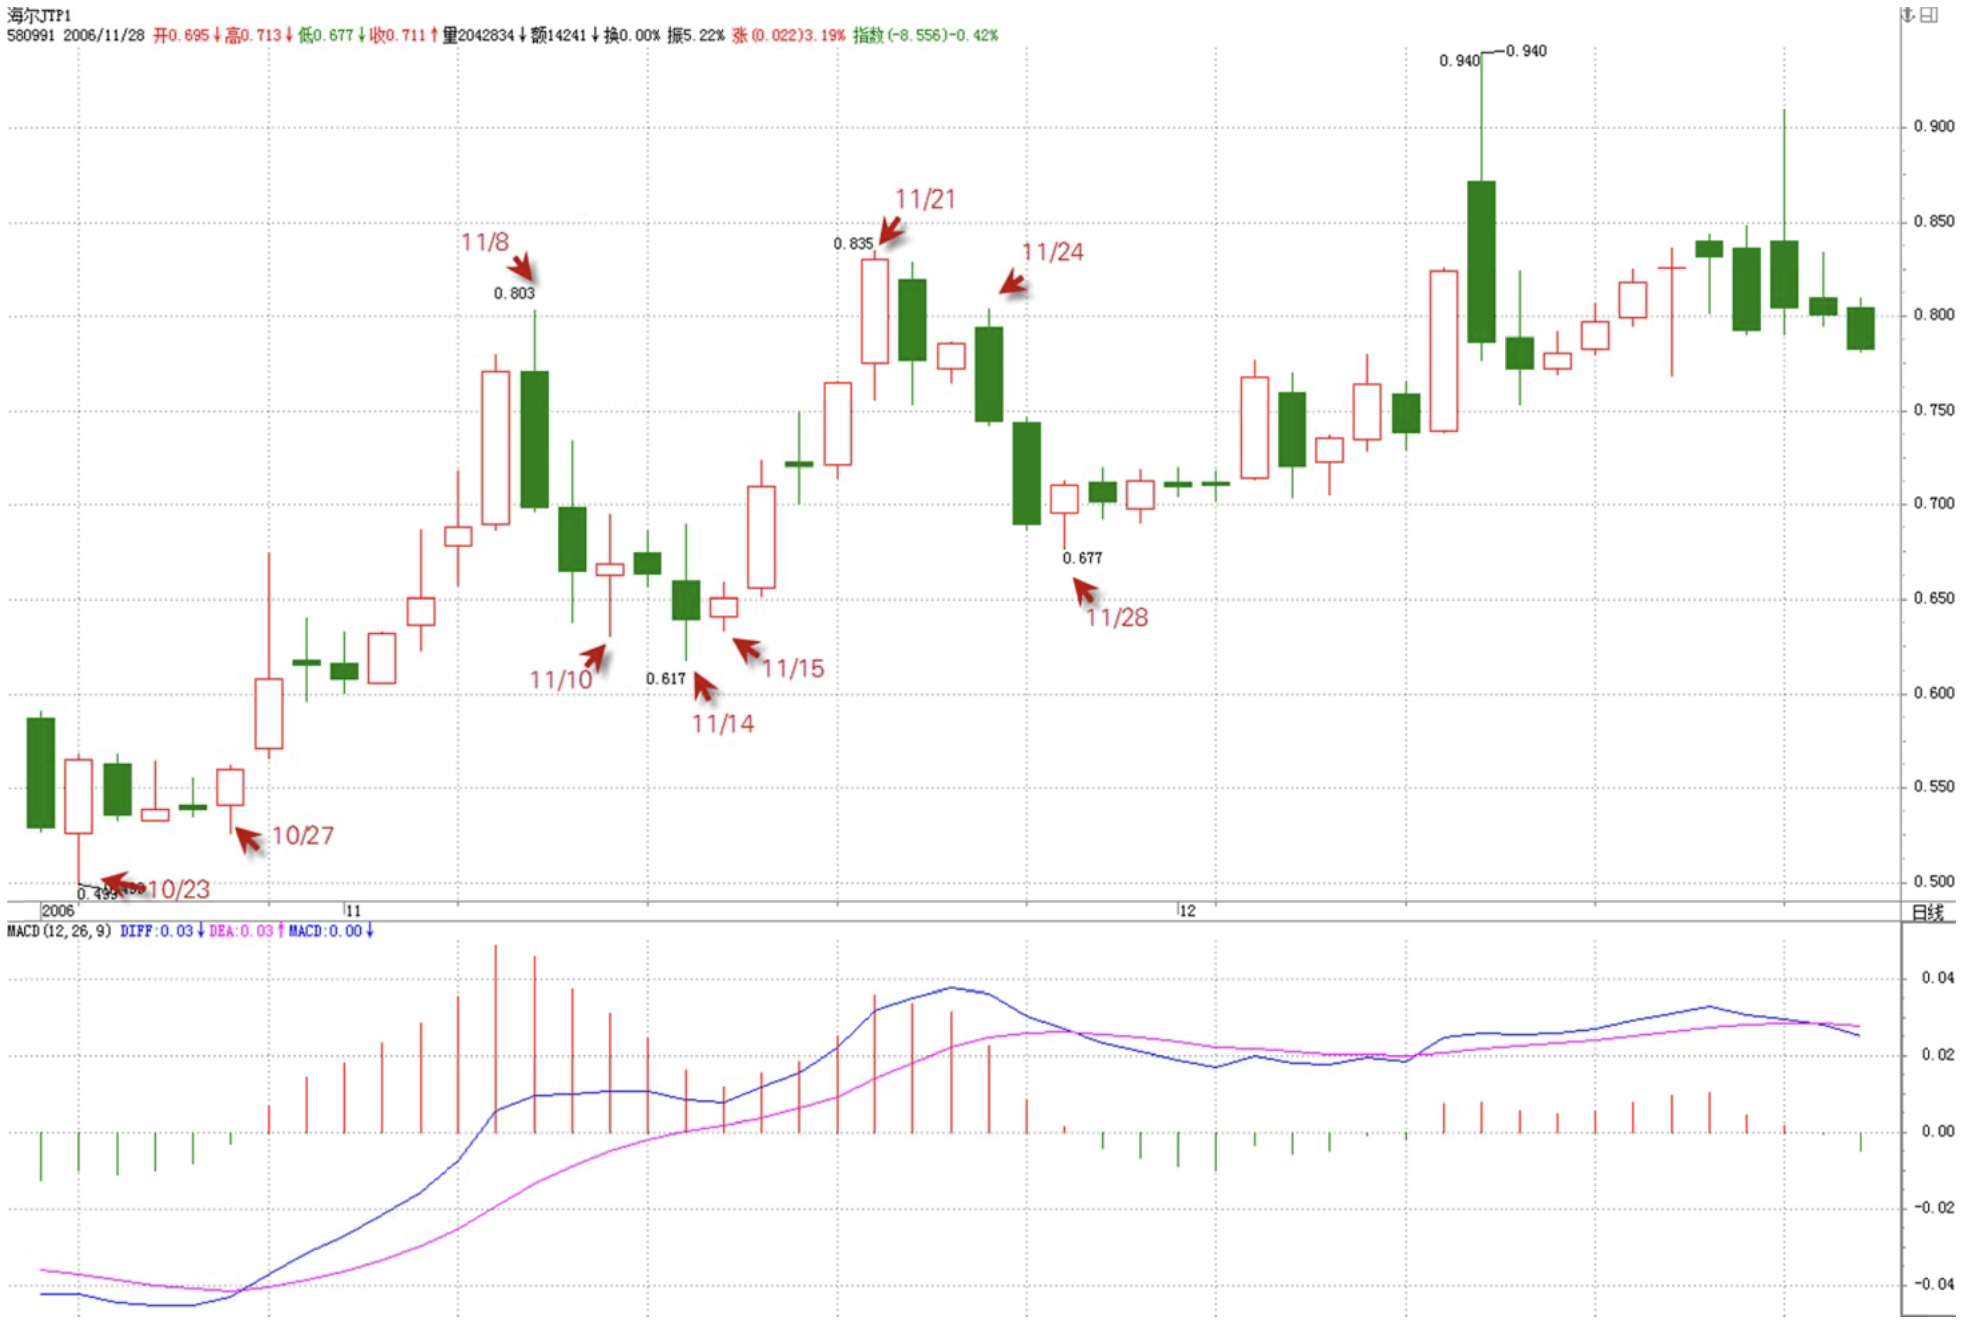
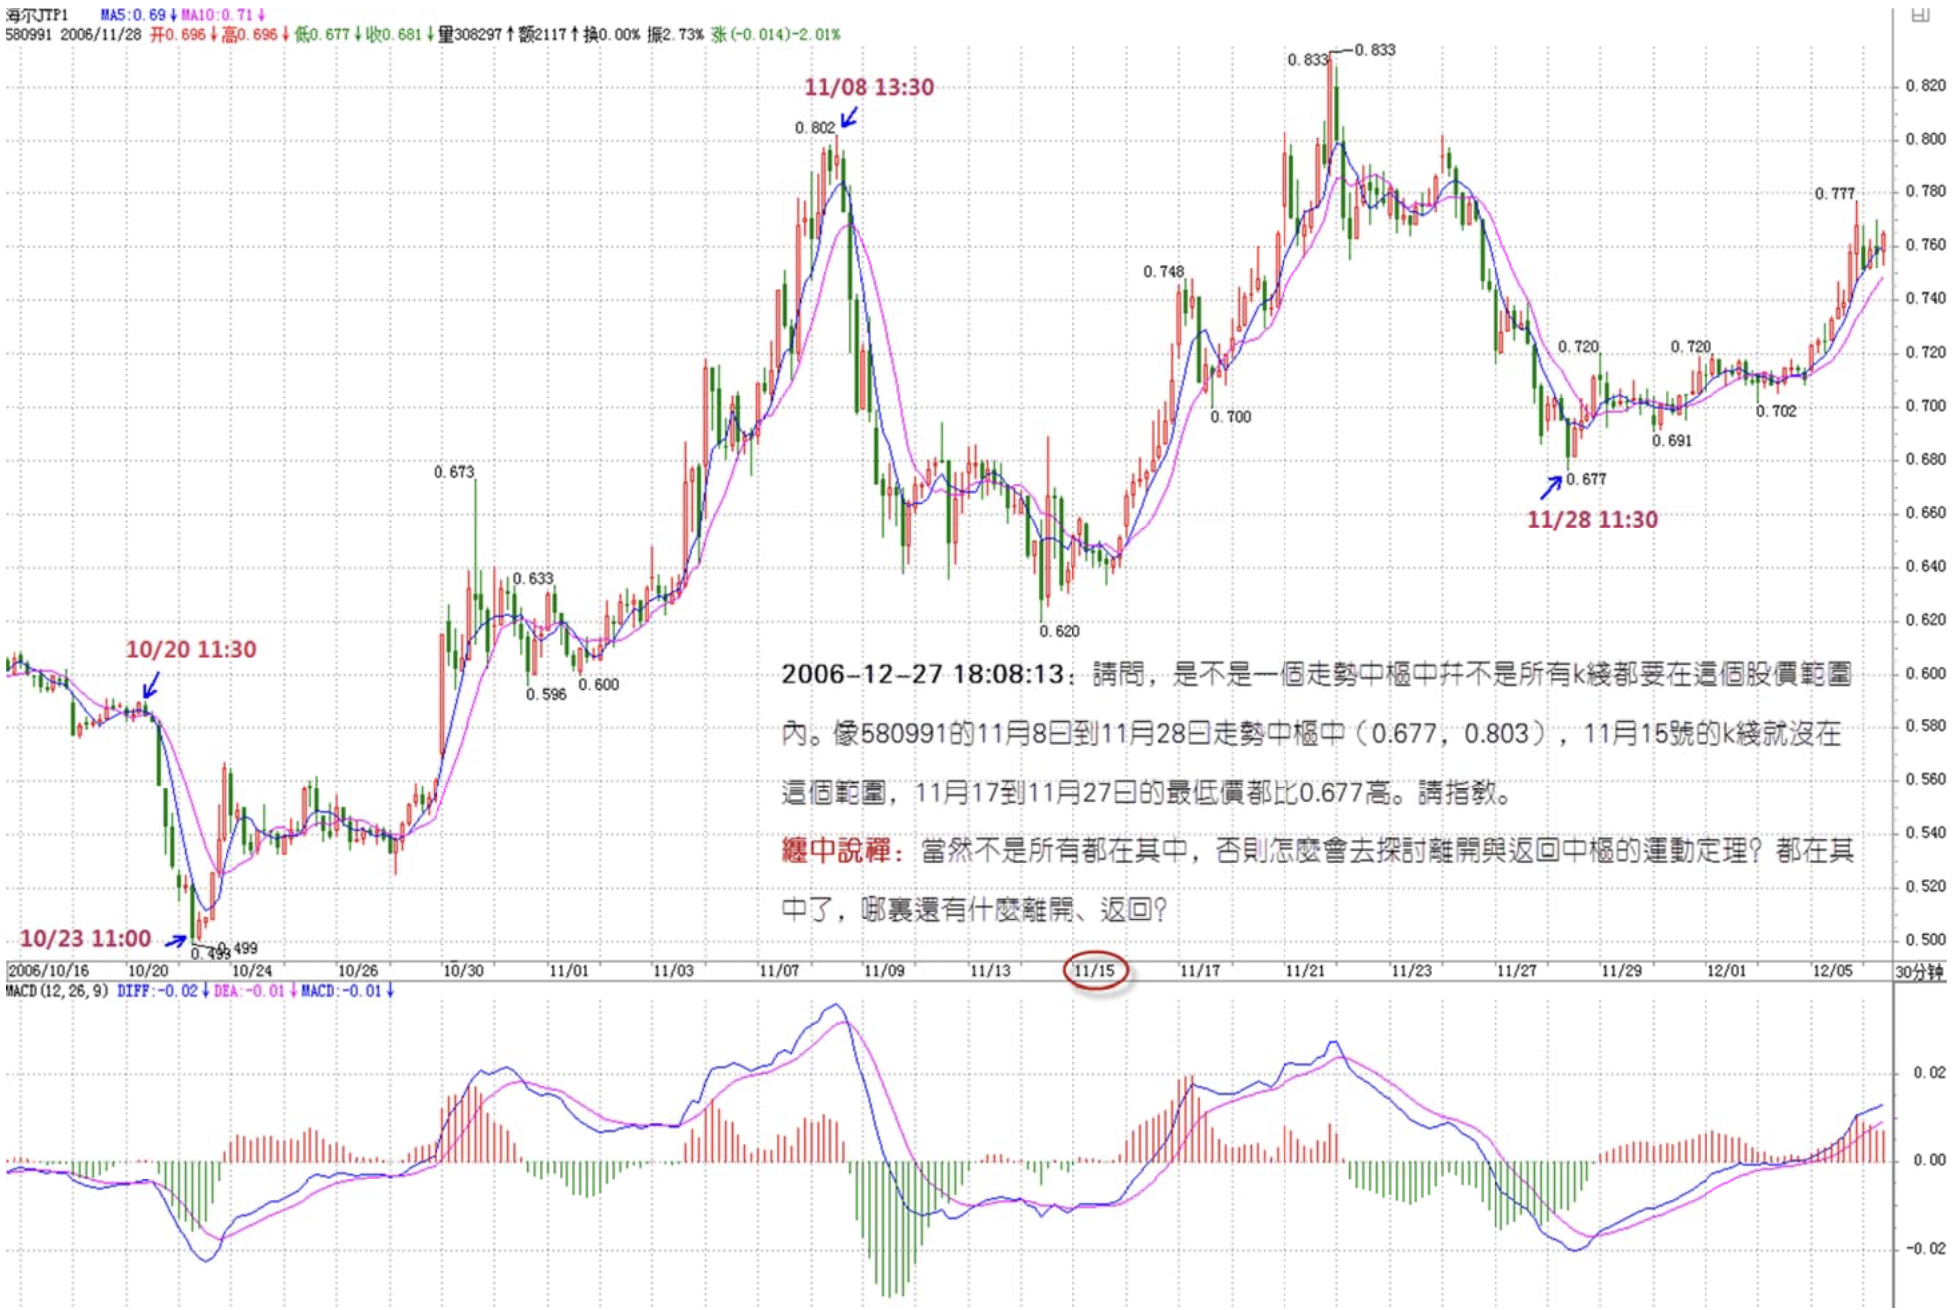
For example, on the daily chart of 580991, from 10/27 to now there's only one hub, from 11/8 to 11/28. This hub can be seen as four consecutive time periods—11/8 to 11/10, 11/10 to 11/15, 11/15 to 11/24, 11/24 to 11/28—forming sub-level trend types whose overlap creates the hub.
========
Question: 580991 from 10/27 to now has only one hub, from 11/8 to 11/28. Why isn't it from 10/27 to 11/21?
That works too. You've just expanded the overlapping portion of the hub—from 0.803–0.686 to 0.803–0.617. But the fact that there's only one hub on the daily chart hasn't changed.
=============================
Chan mm, is what this guy said correct?
====
In a rebound or uptrend, the hub is measured starting from the pullback high. In a decline or downtrend, the hub is measured starting from the bounce low.
A hub is somewhat like a pendulum. The rebound high is like pulling the pendulum up high, then letting go, and it swings back three times to confirm.
缠中说禅 2006/12/28 21:32:30
[Anonymous] 想飞
2006-12-28 21:29:59
Blogger, I may not have been clear earlier. What I meant was: to determine a daily-level hub, must one always look at the corresponding 30-minute chart movements?
===
Generally yes, but once you're experienced, you can roughly tell that certain combinations of daily K-lines would definitely produce three or more trend types on the 30-minute chart, and you can skip looking at the 30-minute.
缠中说禅 2006/12/28 21:33:59
It's too late. Signing off. Goodbye.
缠中说禅 2006/12/28 21:42:45
[Anonymous] 一样一样
2006-12-28 21:20:25
Chan jie, I came a bit late, sorry. Could you please look at 000897, which has a classic ascending triangle pattern—how should this be analyzed using your theory? Where and under what conditions would the sell point be? Please share your insights.
====
Let me answer this before leaving. Look at the sub-level chart. After a hub forms, subsequent price action doesn't necessarily exceed the hub's range. For example, in a converging triangle pattern, the action always stays within the hub's range—it's like spatial compression. That's why triangle breakouts are quite explosive, though pullbacks and fakeouts are also frequent. In wave theory, this is even treated as the primary formation of the fourth wave, and the theoretical basis lies right here. When a compressive pattern forms after a hub, it means the forces of bulls and bears are balanced and deadlocked. Even after a breakout, the opposing pressure is very great and can easily constitute the final leg of a move. But this final leg is often extremely frantic—even more so in futures.
Goodbye.
缠中说禅 2006/12/28 15:45:14
You'll continue to see the power of component stocks. Some say the current rise is absurd—this ID doesn't feel that at all. Compared to 1996, it's far behind. Compared to 1991 or even 1993, even more so. The rebound in August-September 1994, in terms of index speed, was also faster than this time. There's nothing to say—the former leading stocks were just called Development and Changhong. Now they've been replaced by ICBC and the like—not a shred of novelty.
This ID no longer wants to keep saying that the first wave is component stocks—it's been said too many times, it's boring. If comparing to 1996, there shouldn't be any major correction until 4500. Next year, or the year after at the latest, it should reach 6000 no matter what. Otherwise, this ID would be utterly disappointed with this rally.
After New Year's Day, and especially around the time China Life goes public, a platform-style rapid oscillation is necessary. This is the biggest short-term risk. As for the medium to long term, here's yet another phrase that's been said countless times: we are only in the first stage of the bull market.